Copyright
©The Author(s) 2024.
World J Hepatol. May 27, 2024; 16(5): 832-842
Published online May 27, 2024. doi: 10.4254/wjh.v16.i5.832
Published online May 27, 2024. doi: 10.4254/wjh.v16.i5.832
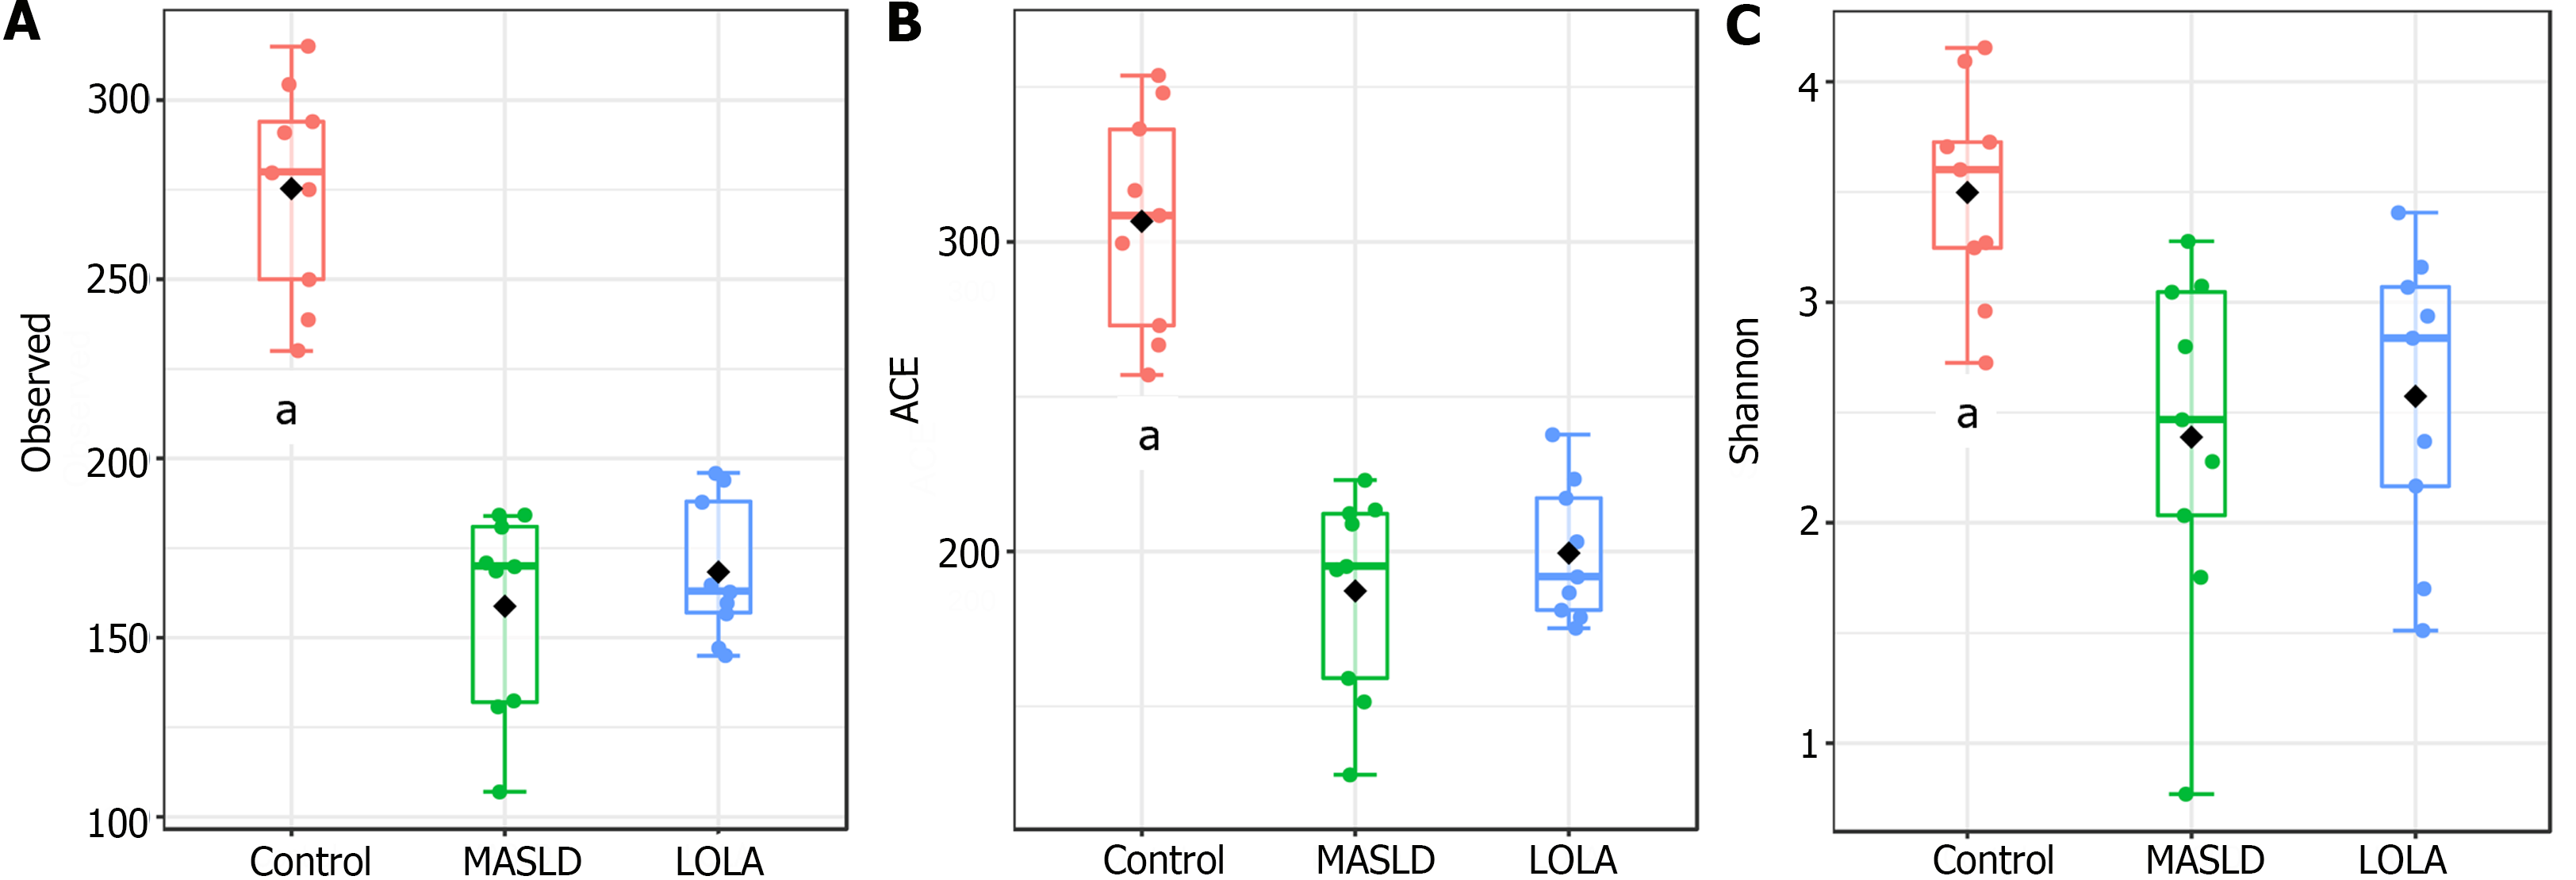
Figure 1 Alpha diversity analysis according to different metrics.
A: Observed; B: ACE; C: Shannon. Statistical confidence was accessed using the multivariate Kruskal-Wallis test. aP-value < 0.05. MASLD: Metabolic-dysfunction associated steatotic liver disease; LOLA: Ornithine aspartate.
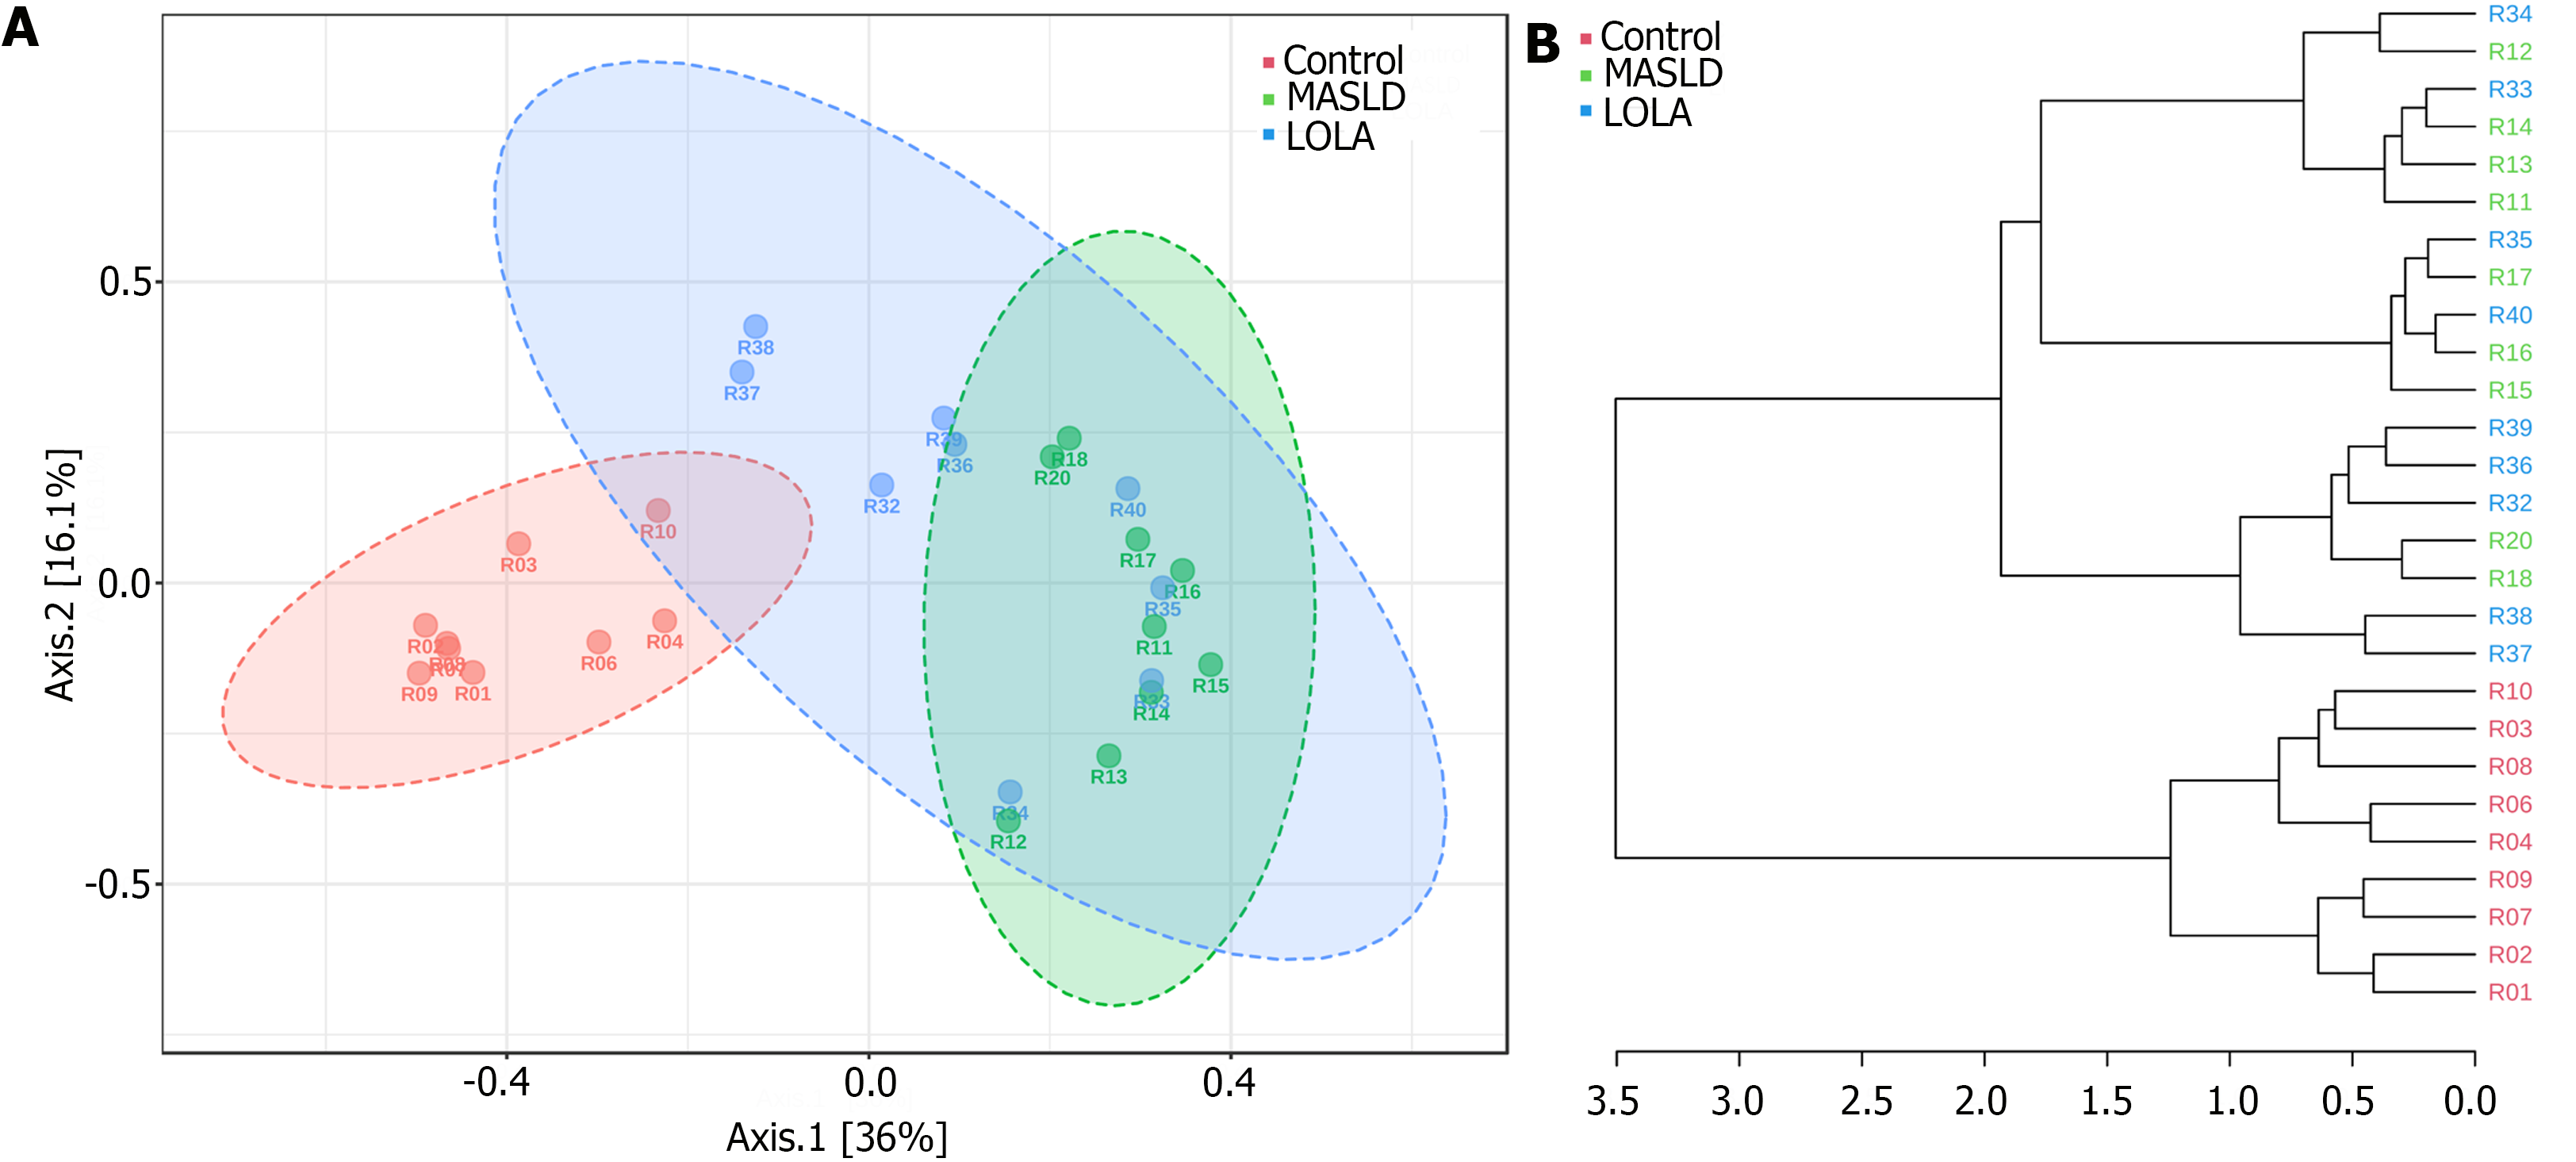
Figure 2 Beta diversity analysis using principal coordinates analysis and dendrogram clustering to evaluate similarities and differences among bacterial community structures.
A: Principal coordinate analysis of bacterial community structures based on the Bray-Curtis distance metric; B: Hierarchical clustering dendrogram based on the Bray-Curtis dissimilarity index. Samples were colored according to the experimental group: Control, metabolic-dysfunction associated steatotic liver disease, and ornithine aspartate. Statistical confidence for the sample grouping was accessed using analysis of similarities. MASLD: Metabolic-dysfunction associated steatotic liver disease; LOLA: Ornithine aspartate.
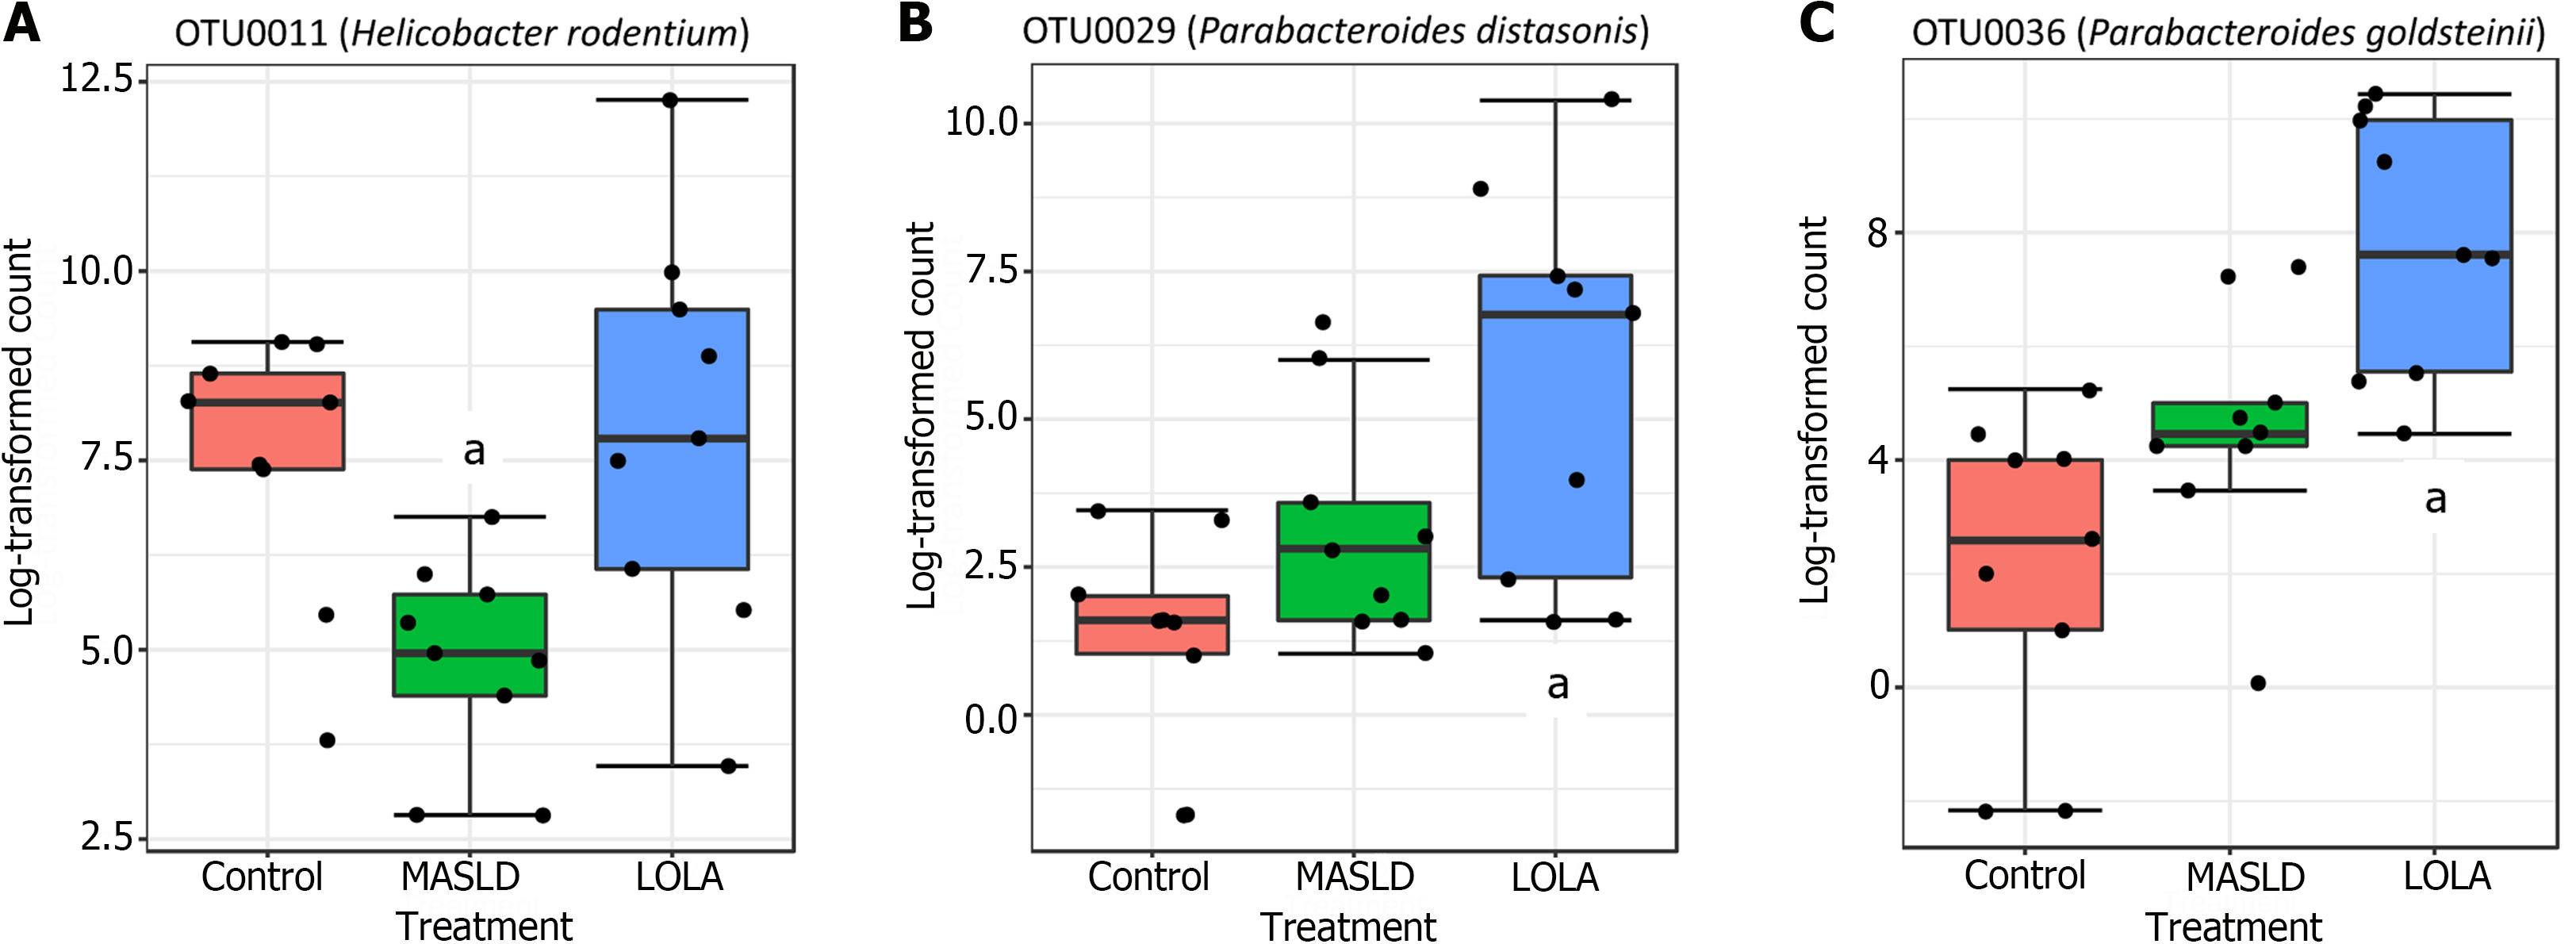
Figure 3 Differential abundant operational taxonomic units between ornithine aspartate and metabolic-dysfunction associated steatotic liver disease by Lefse.
Statistical confidence was assessed using the Kruskal-Wallis test. Taxa were ranked by linear discriminant analysis (LDA) score. Differences were considered significant for a logarithmic LDA score threshold of ± 2.0 and P-value < 0.05. aP-value < 0.05. MASLD: Metabolic-dysfunction associated steatotic liver disease; LOLA: Ornithine aspartate.
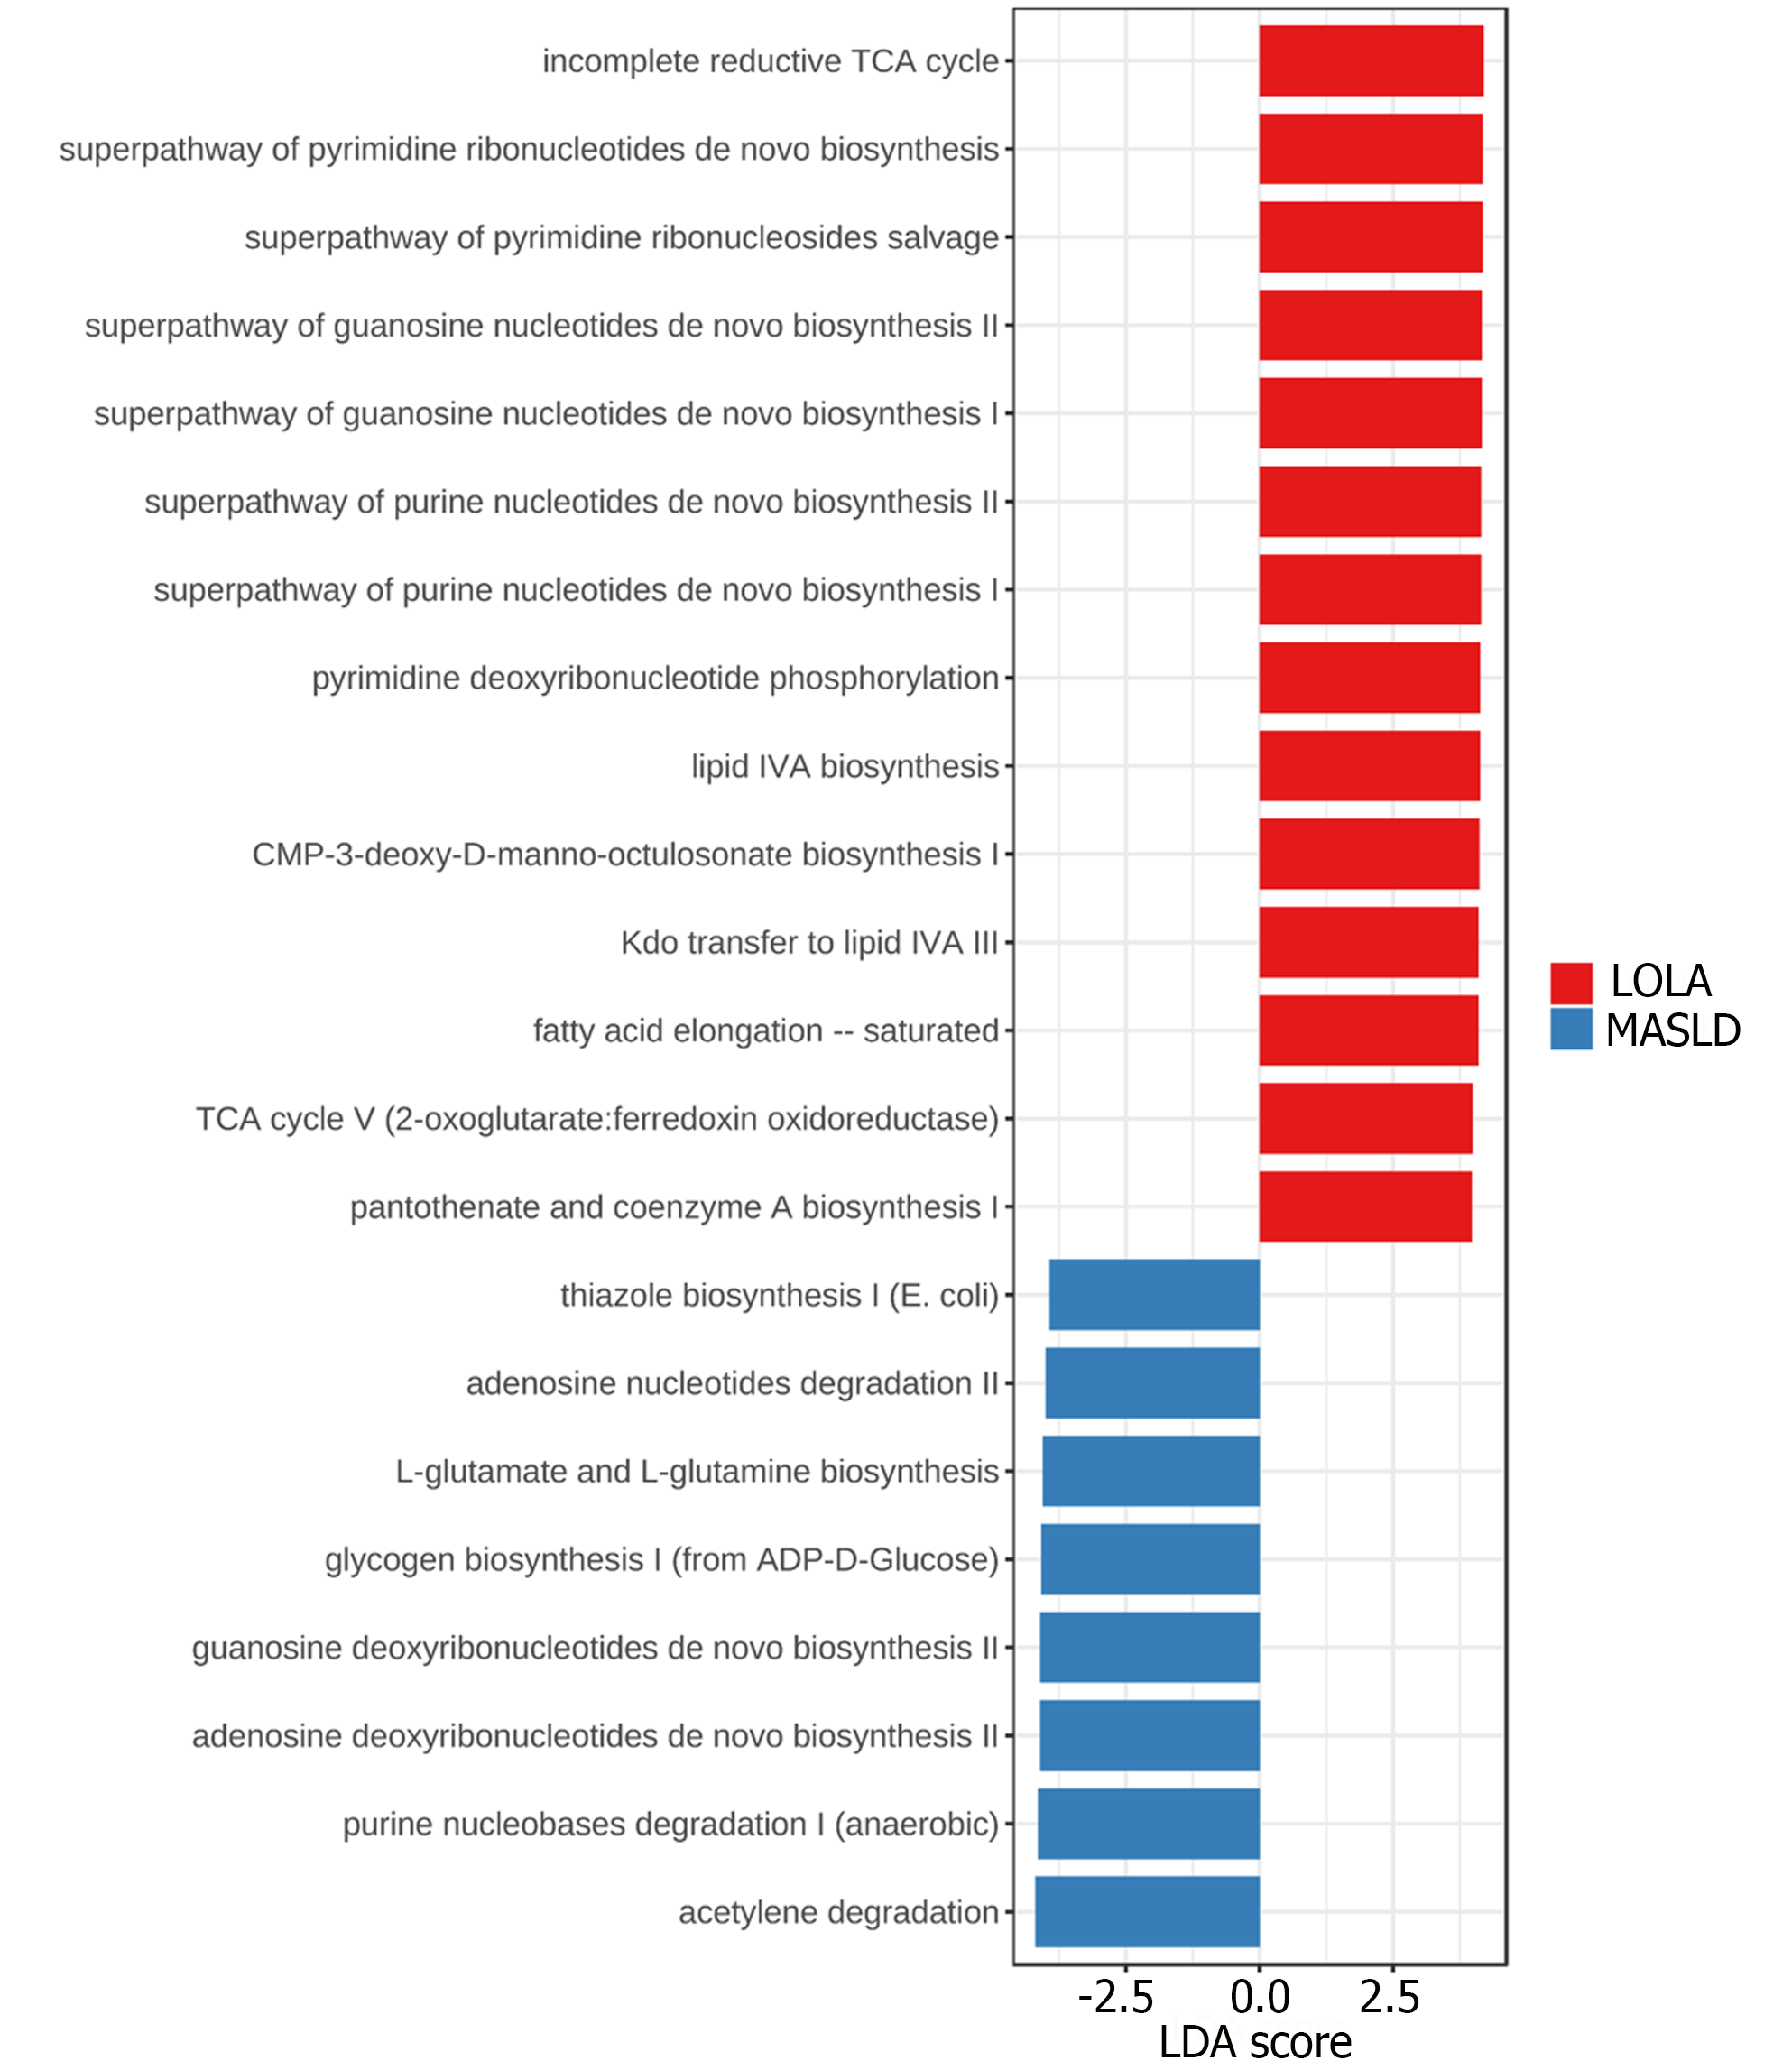
Figure 4 Differentially abundant metabolic pathways between metabolic-dysfunction associated steatotic liver disease and ornithine aspartate by Lefse analysis.
Statistical confidence was assessed using the Kruskal-Wallis test. Metabolic pathways were ranked by linear discriminant analysis (LDA) score. Differences were considered significant for a logarithmic LDA score threshold of ± 4.0 and P-value < 0.05. MASLD: Metabolic-dysfunction associated steatotic liver disease; LOLA: Ornithine aspartate.
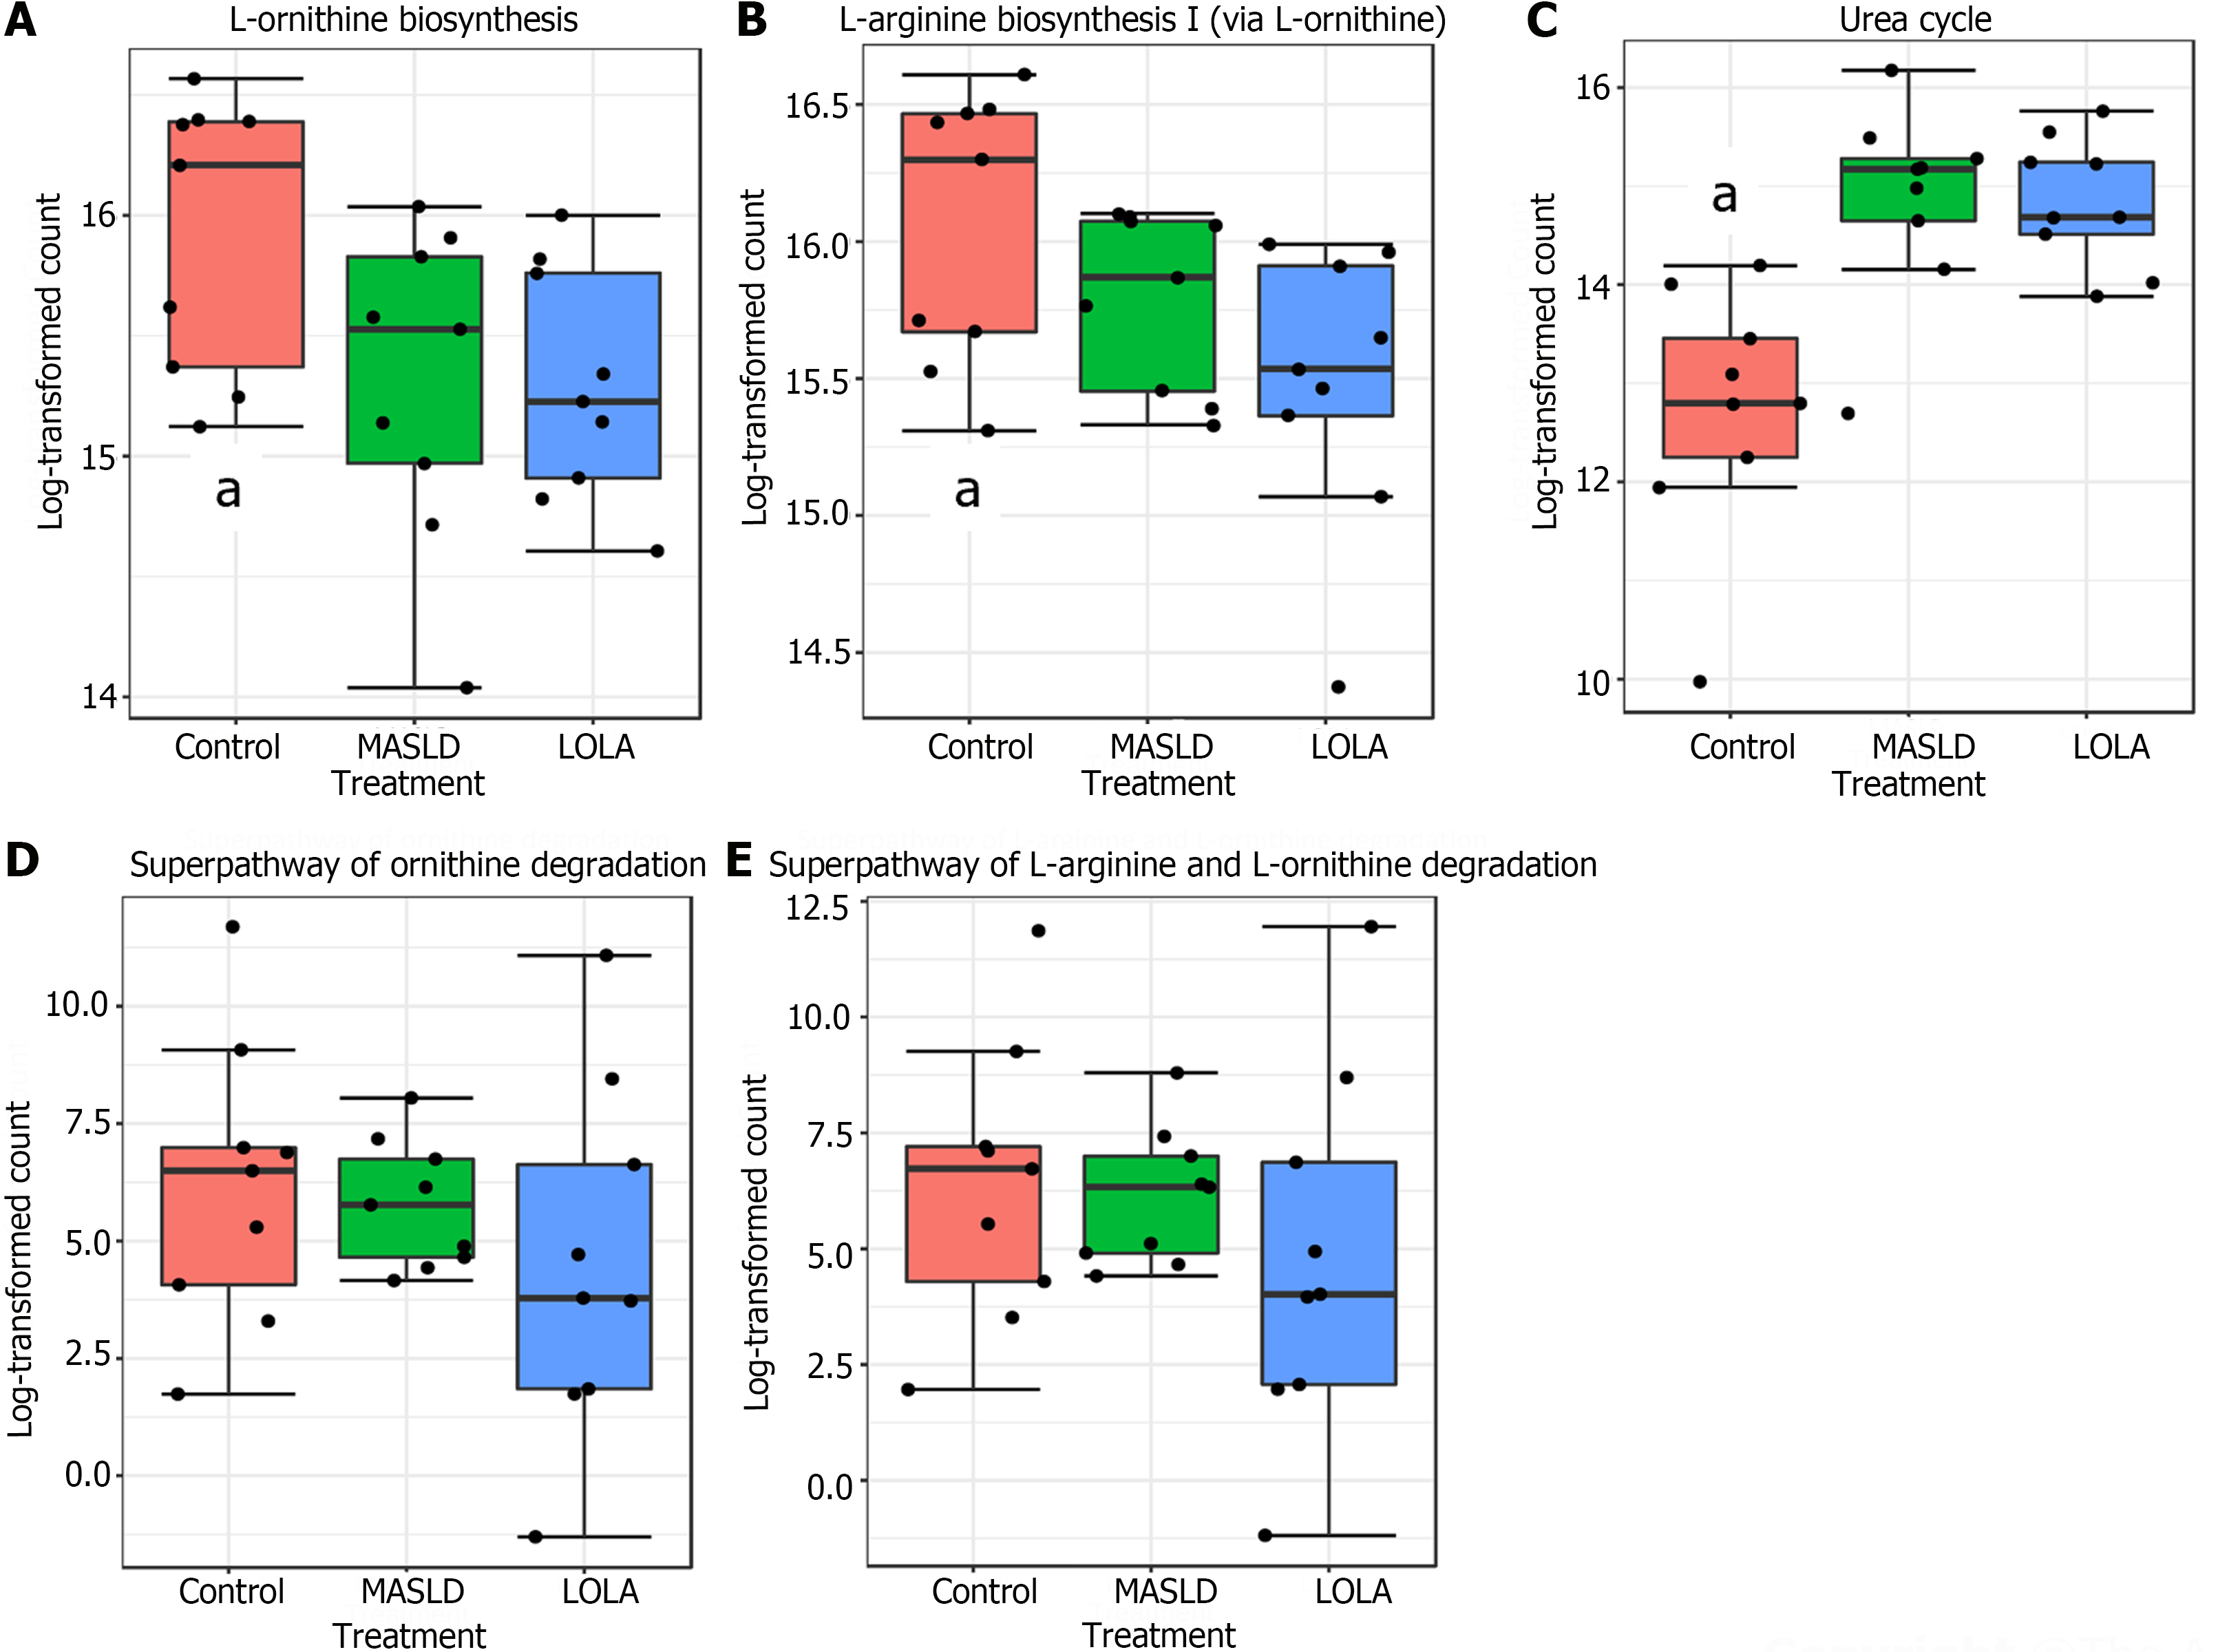
Figure 5 Predicted metabolic pathways related to L-ornithine in each group.
Statistical confidence was assessed using the Kruskal-Wallis test. Metabolic pathways were ranked by linear discriminant analysis (LDA) score. Differences were considered significant for a logarithmic LDA score threshold of ± 4.0 and P-value < 0.05. aP-value < 0.05. MASLD: Metabolic-dysfunction associated steatotic liver disease; LOLA: Ornithine aspartate.
- Citation: Lange EC, Rampelotto PH, Longo L, de Freitas LBR, Uribe-Cruz C, Alvares-da-Silva MR. Ornithine aspartate effects on bacterial composition and metabolic pathways in a rat model of steatotic liver disease. World J Hepatol 2024; 16(5): 832-842
- URL: https://www.wjgnet.com/1948-5182/full/v16/i5/832.htm
- DOI: https://dx.doi.org/10.4254/wjh.v16.i5.832


