Copyright
©The Author(s) 2024.
World J Hepatol. May 27, 2024; 16(5): 791-799
Published online May 27, 2024. doi: 10.4254/wjh.v16.i5.791
Published online May 27, 2024. doi: 10.4254/wjh.v16.i5.791
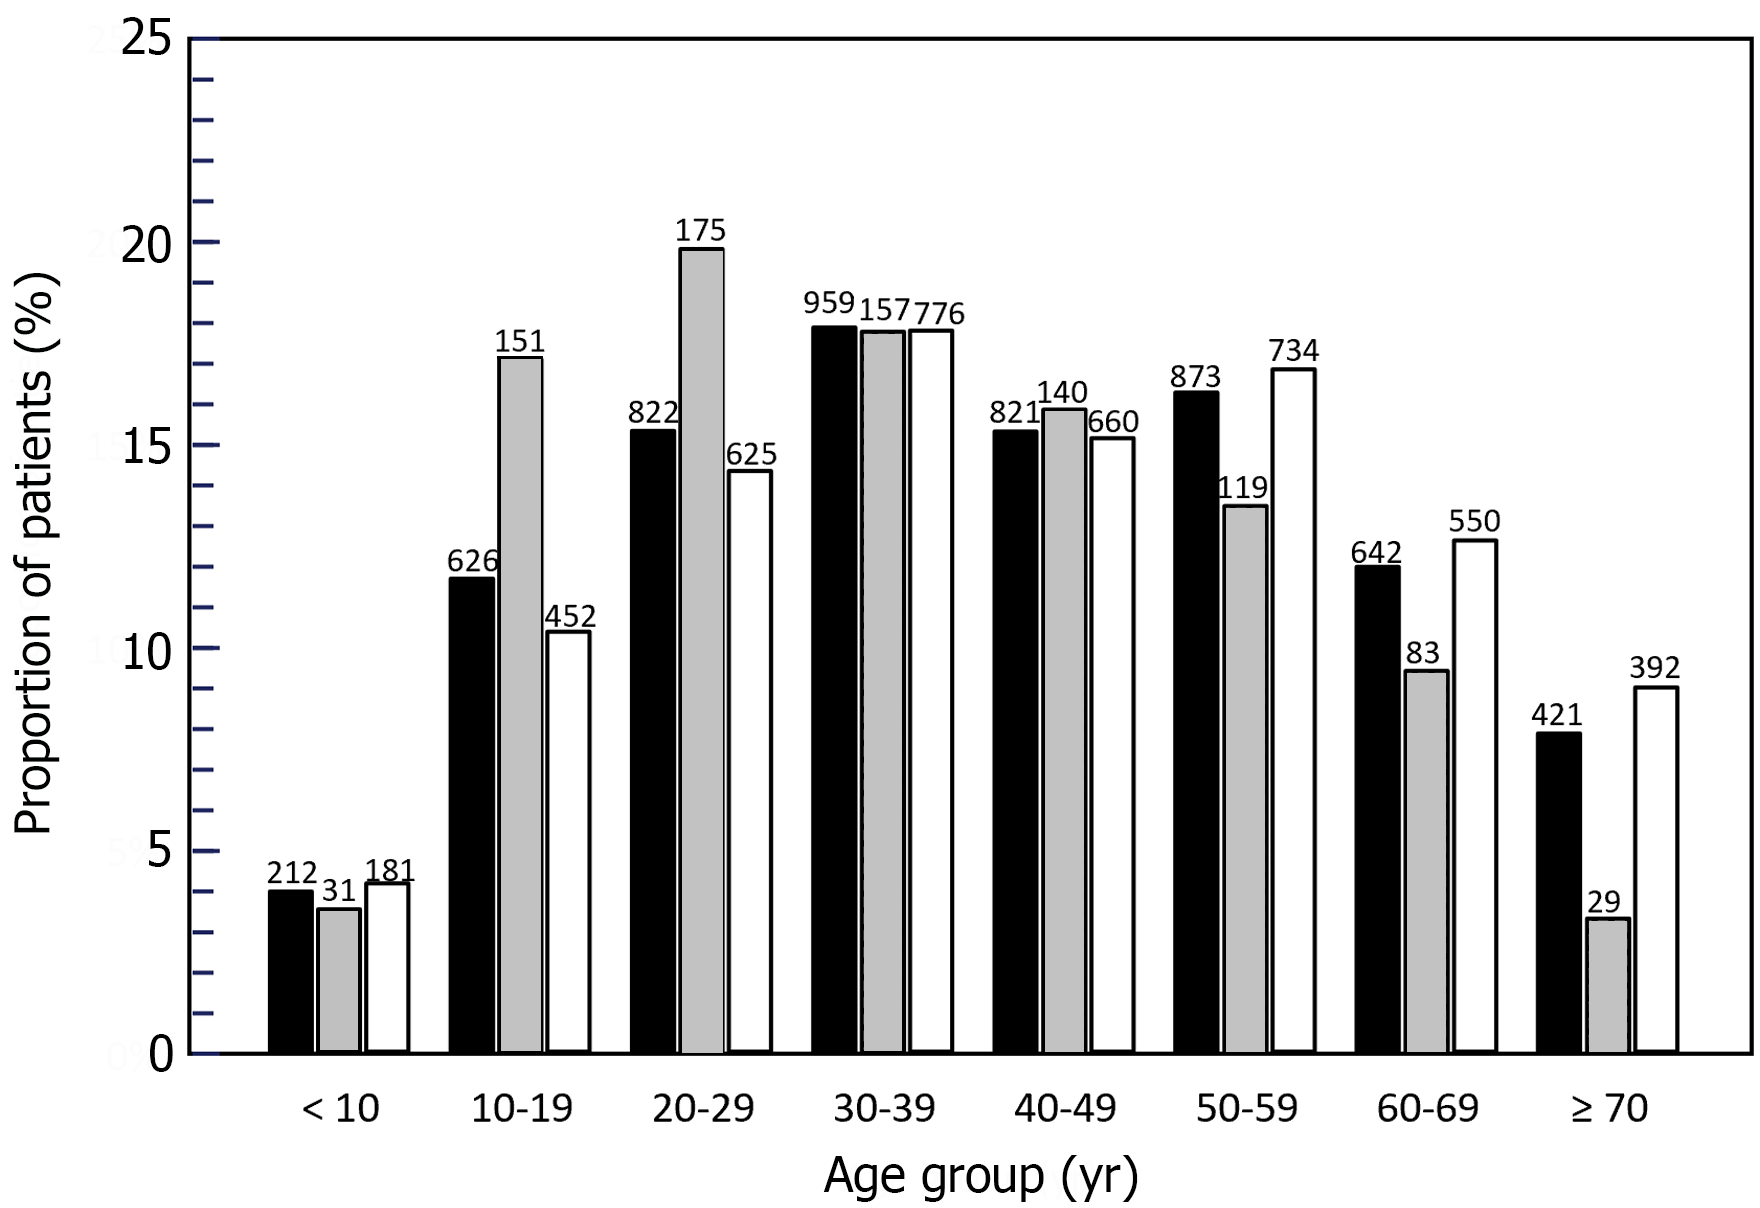
Figure 1 Age distribution of the analysis population on the index date.
Black columns: All patients (n = 5376); Grey columns: Patients with documented treatment; White columns: Patients with no documented treatment. The numbers over each column indicate the absolute number of patients in each age group.
Figure 2 Distribution of clinical manifestations over time.
A: No documented treatment; B: With documented treatment. Black columns: Hepatic manifestations; Grey columns: Neurological symptoms; White columns: Psychiatric manifestations.
- Citation: Daniel-Robin T, Kumar P, Benichou B, Combal JP. Characteristics of patients with Wilson disease in the United States: An insurance claims database study. World J Hepatol 2024; 16(5): 791-799
- URL: https://www.wjgnet.com/1948-5182/full/v16/i5/791.htm
- DOI: https://dx.doi.org/10.4254/wjh.v16.i5.791


