Copyright
©The Author(s) 2024.
World J Hepatol. Mar 27, 2024; 16(3): 439-451
Published online Mar 27, 2024. doi: 10.4254/wjh.v16.i3.439
Published online Mar 27, 2024. doi: 10.4254/wjh.v16.i3.439
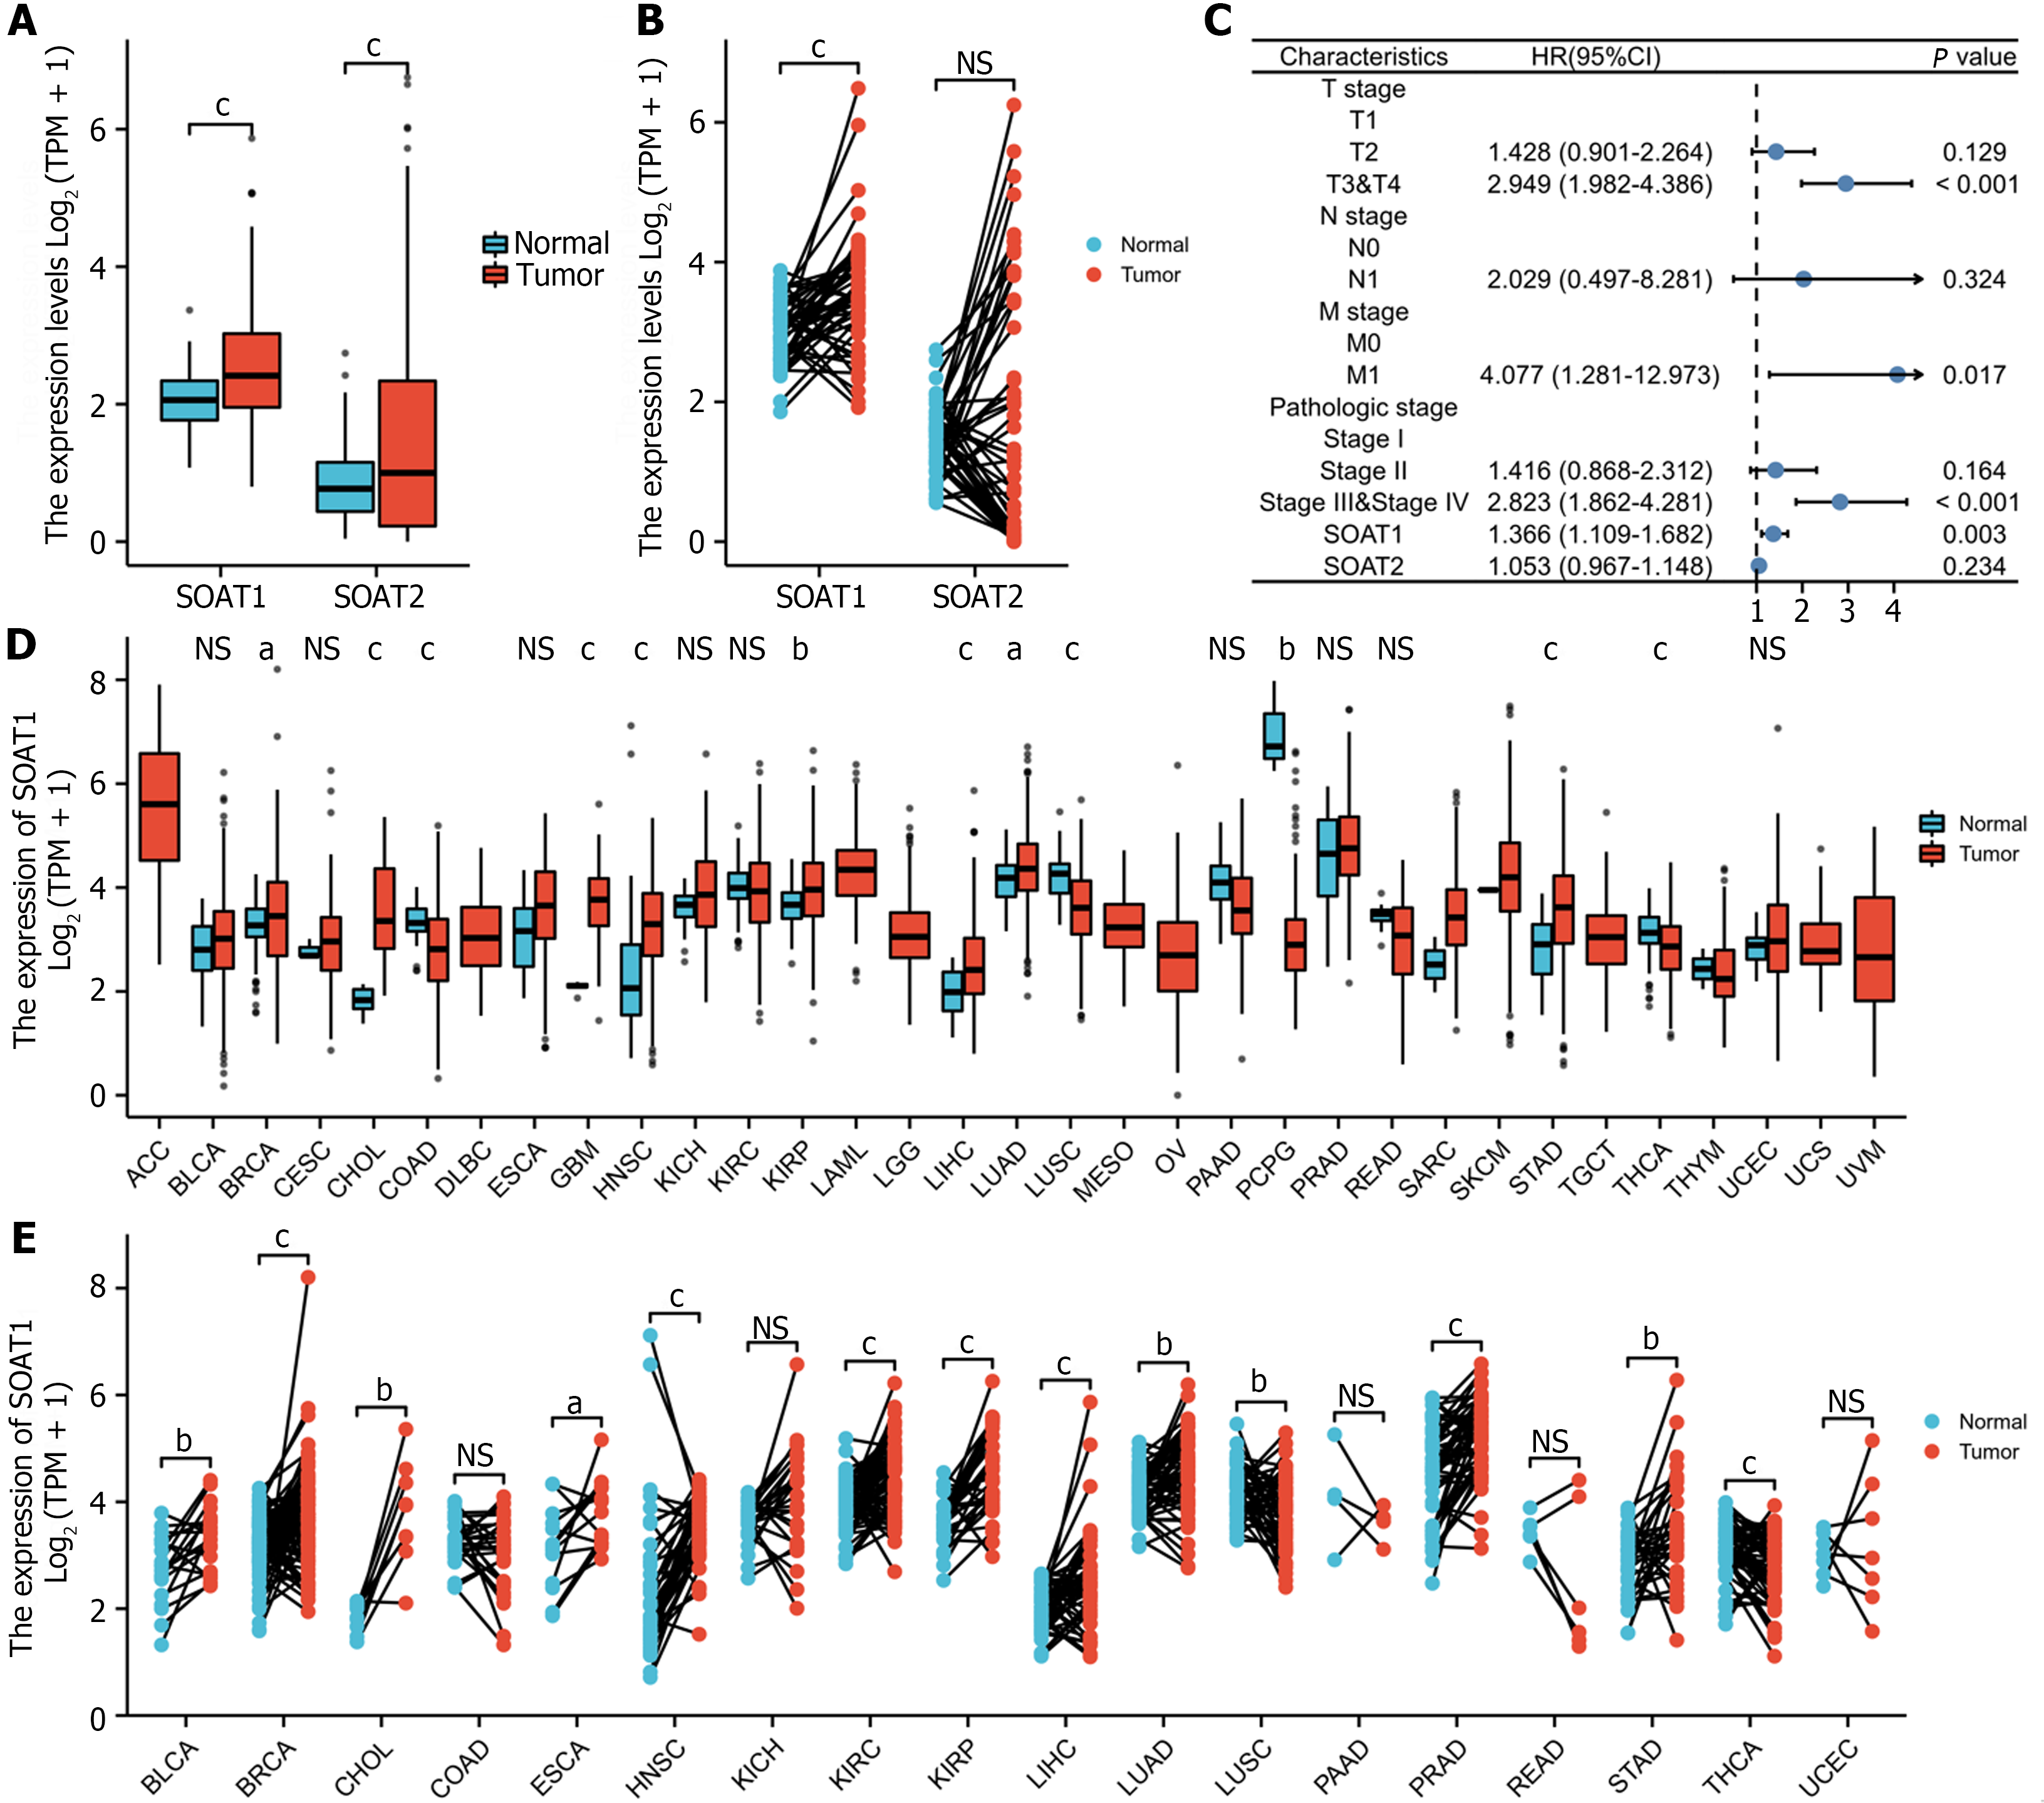
Figure 1 Expression of sterol O-acyltransferase 1 and sterol O-acyltransferase 2 in The Cancer Genome Atlas-liver hepatocellular carcinoma.
A: Sterol O-acyltransferase 1 (SOAT1) and SOAT2 expression in the unpaired samples in The Cancer Genome Atlas (TCGA) liver hepatocellular carcinoma TCGA-LIHC; B: SOAT1 and SOAT2 expression in the paired samples in TCGA-LIHC; C: Forest diagram of univariate analysis of patients’ characteristics and SOAT1 expression; D: SOAT1 expression in the unpaired samples in TCGA pan-cancer; E: SOAT1 expression in the paired samples (E) in TCGA pan-cancer. aP < 0.05; bP < 0.01; cP < 0.001; NS: Not significant.
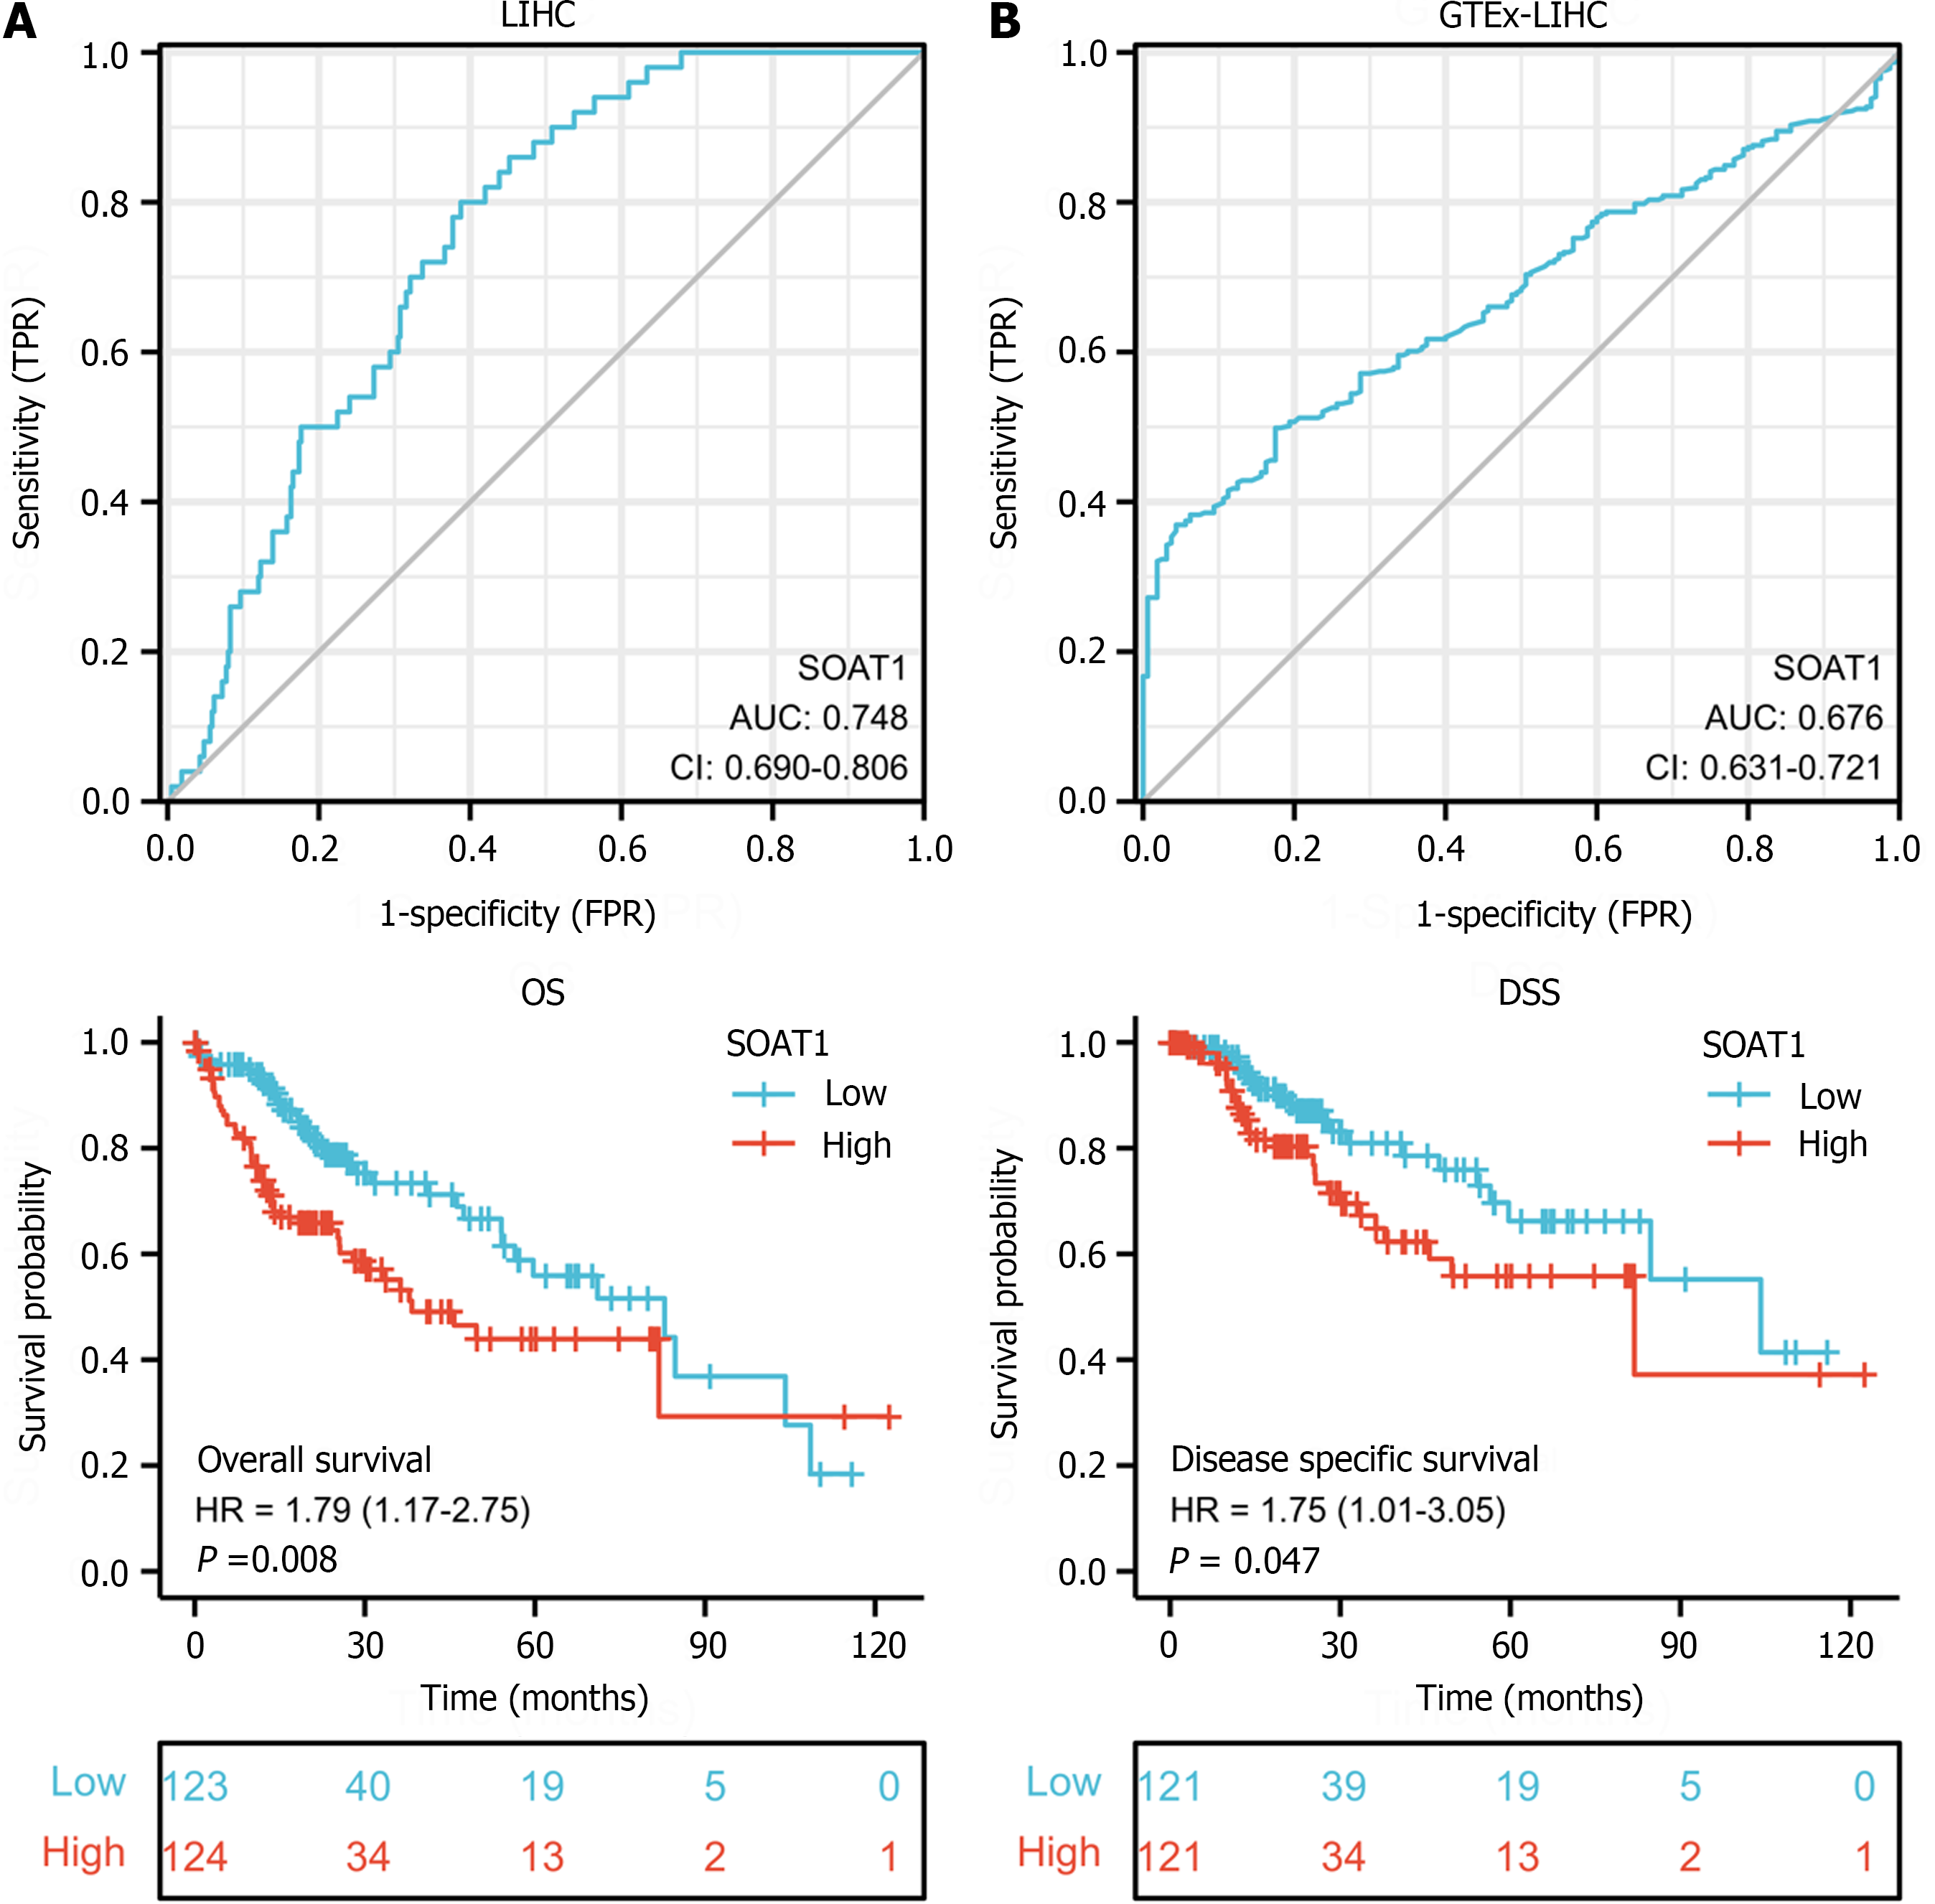
Figure 2 Diagnostic and prognostic value of sterol O-acyltransferase 1 expression in The Cancer Genome Atlas-liver hepatocellular carcinoma.
A: Area under the curve (AUC) of sterol O-acyltransferase 1 (SOAT1) expression in tumor samples from liver hepatocellular carcinoma (LIHC) patients compared with para-carcinoma tissues; B: AUC of SOAT1 expression in tumor samples from LIHC patients compared with GTEx; C: Association between OS and SOAT1 expression demonstrated the prognostic value of SOAT1 expression in The Cancer Genome Atlas (TCGA)-LIHC; D: Association between DSS and SOAT1 expression demonstrated the prognostic value of SOAT1 expression in TCGA-LIHC.
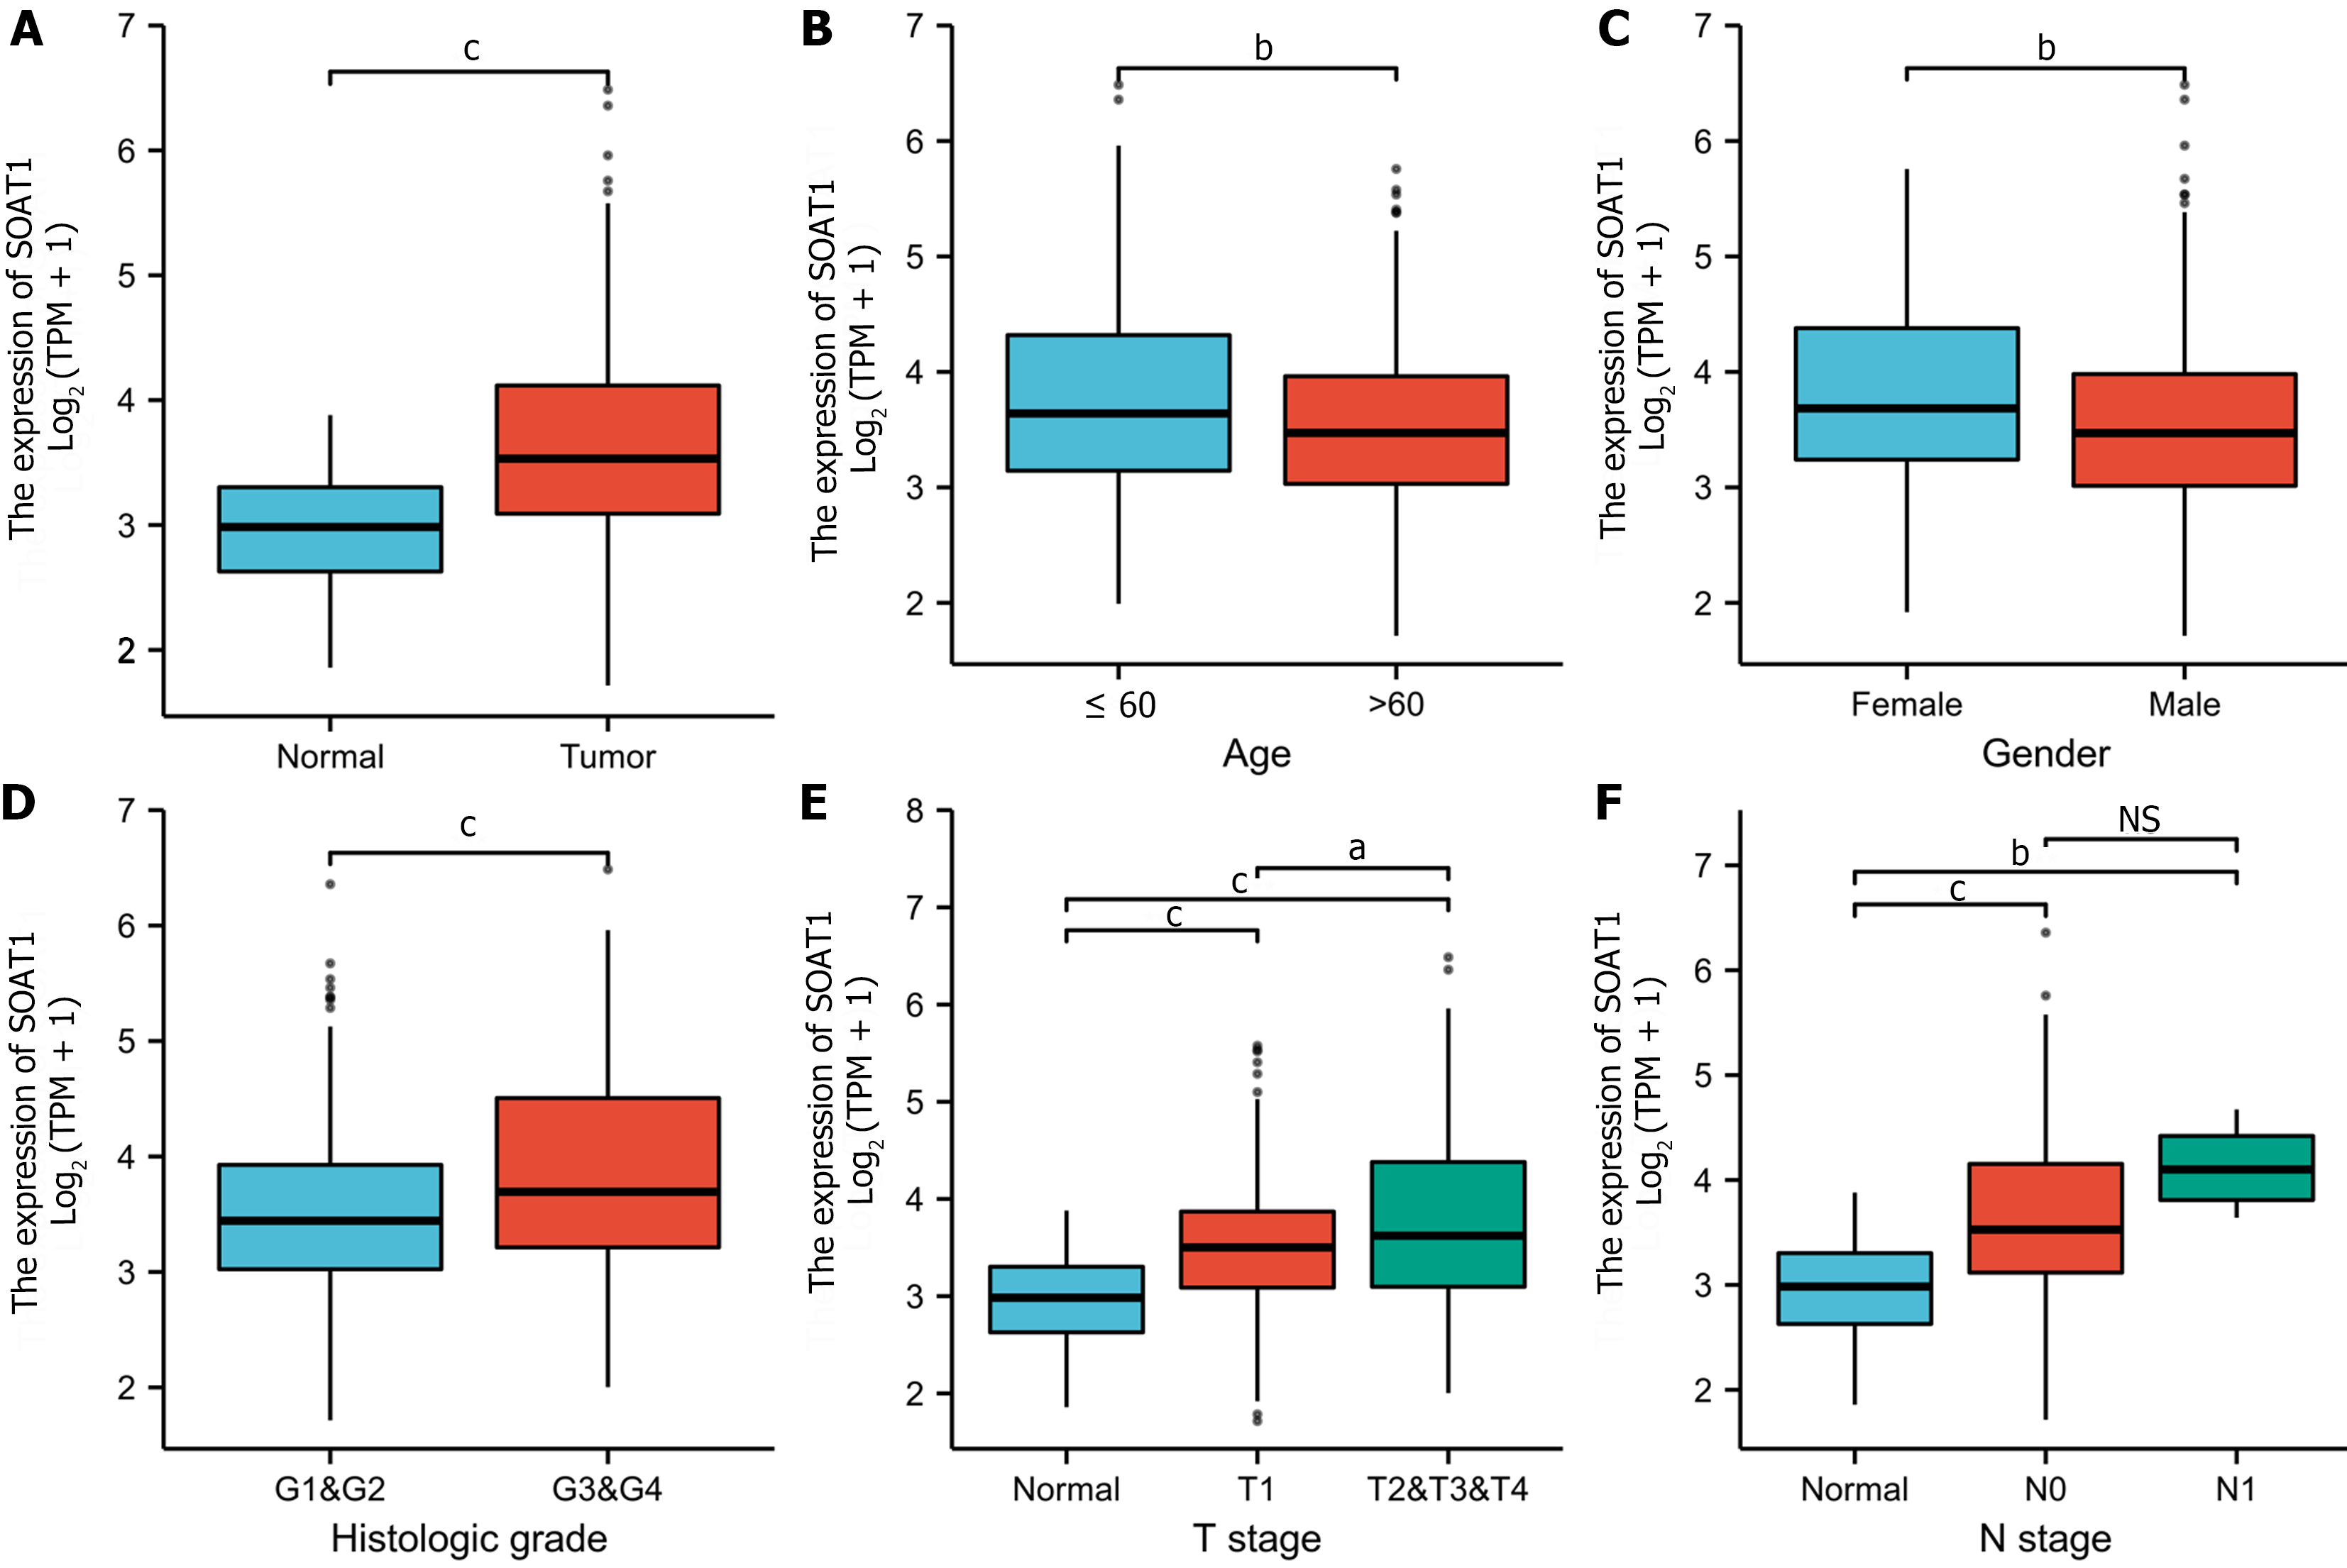
Figure 3 Subgroup analysis of sterol O-acyltransferase 1 expression in liver hepatocellular carcinoma.
A: Sterol O-acyltransferase 1 (SOAT1) expression in tumor and normal tissues; B: Association between SOAT1 expression and age; C: Association between SOAT1 expression and gender; D: Association between SOAT1 expression and histologic grade; E: Association between SOAT1 expression and T stage; F: Association between SOAT1 expression and N stage (F). aP < 0.05; bP < 0.01; cP < 0.001; NS: Not significant.
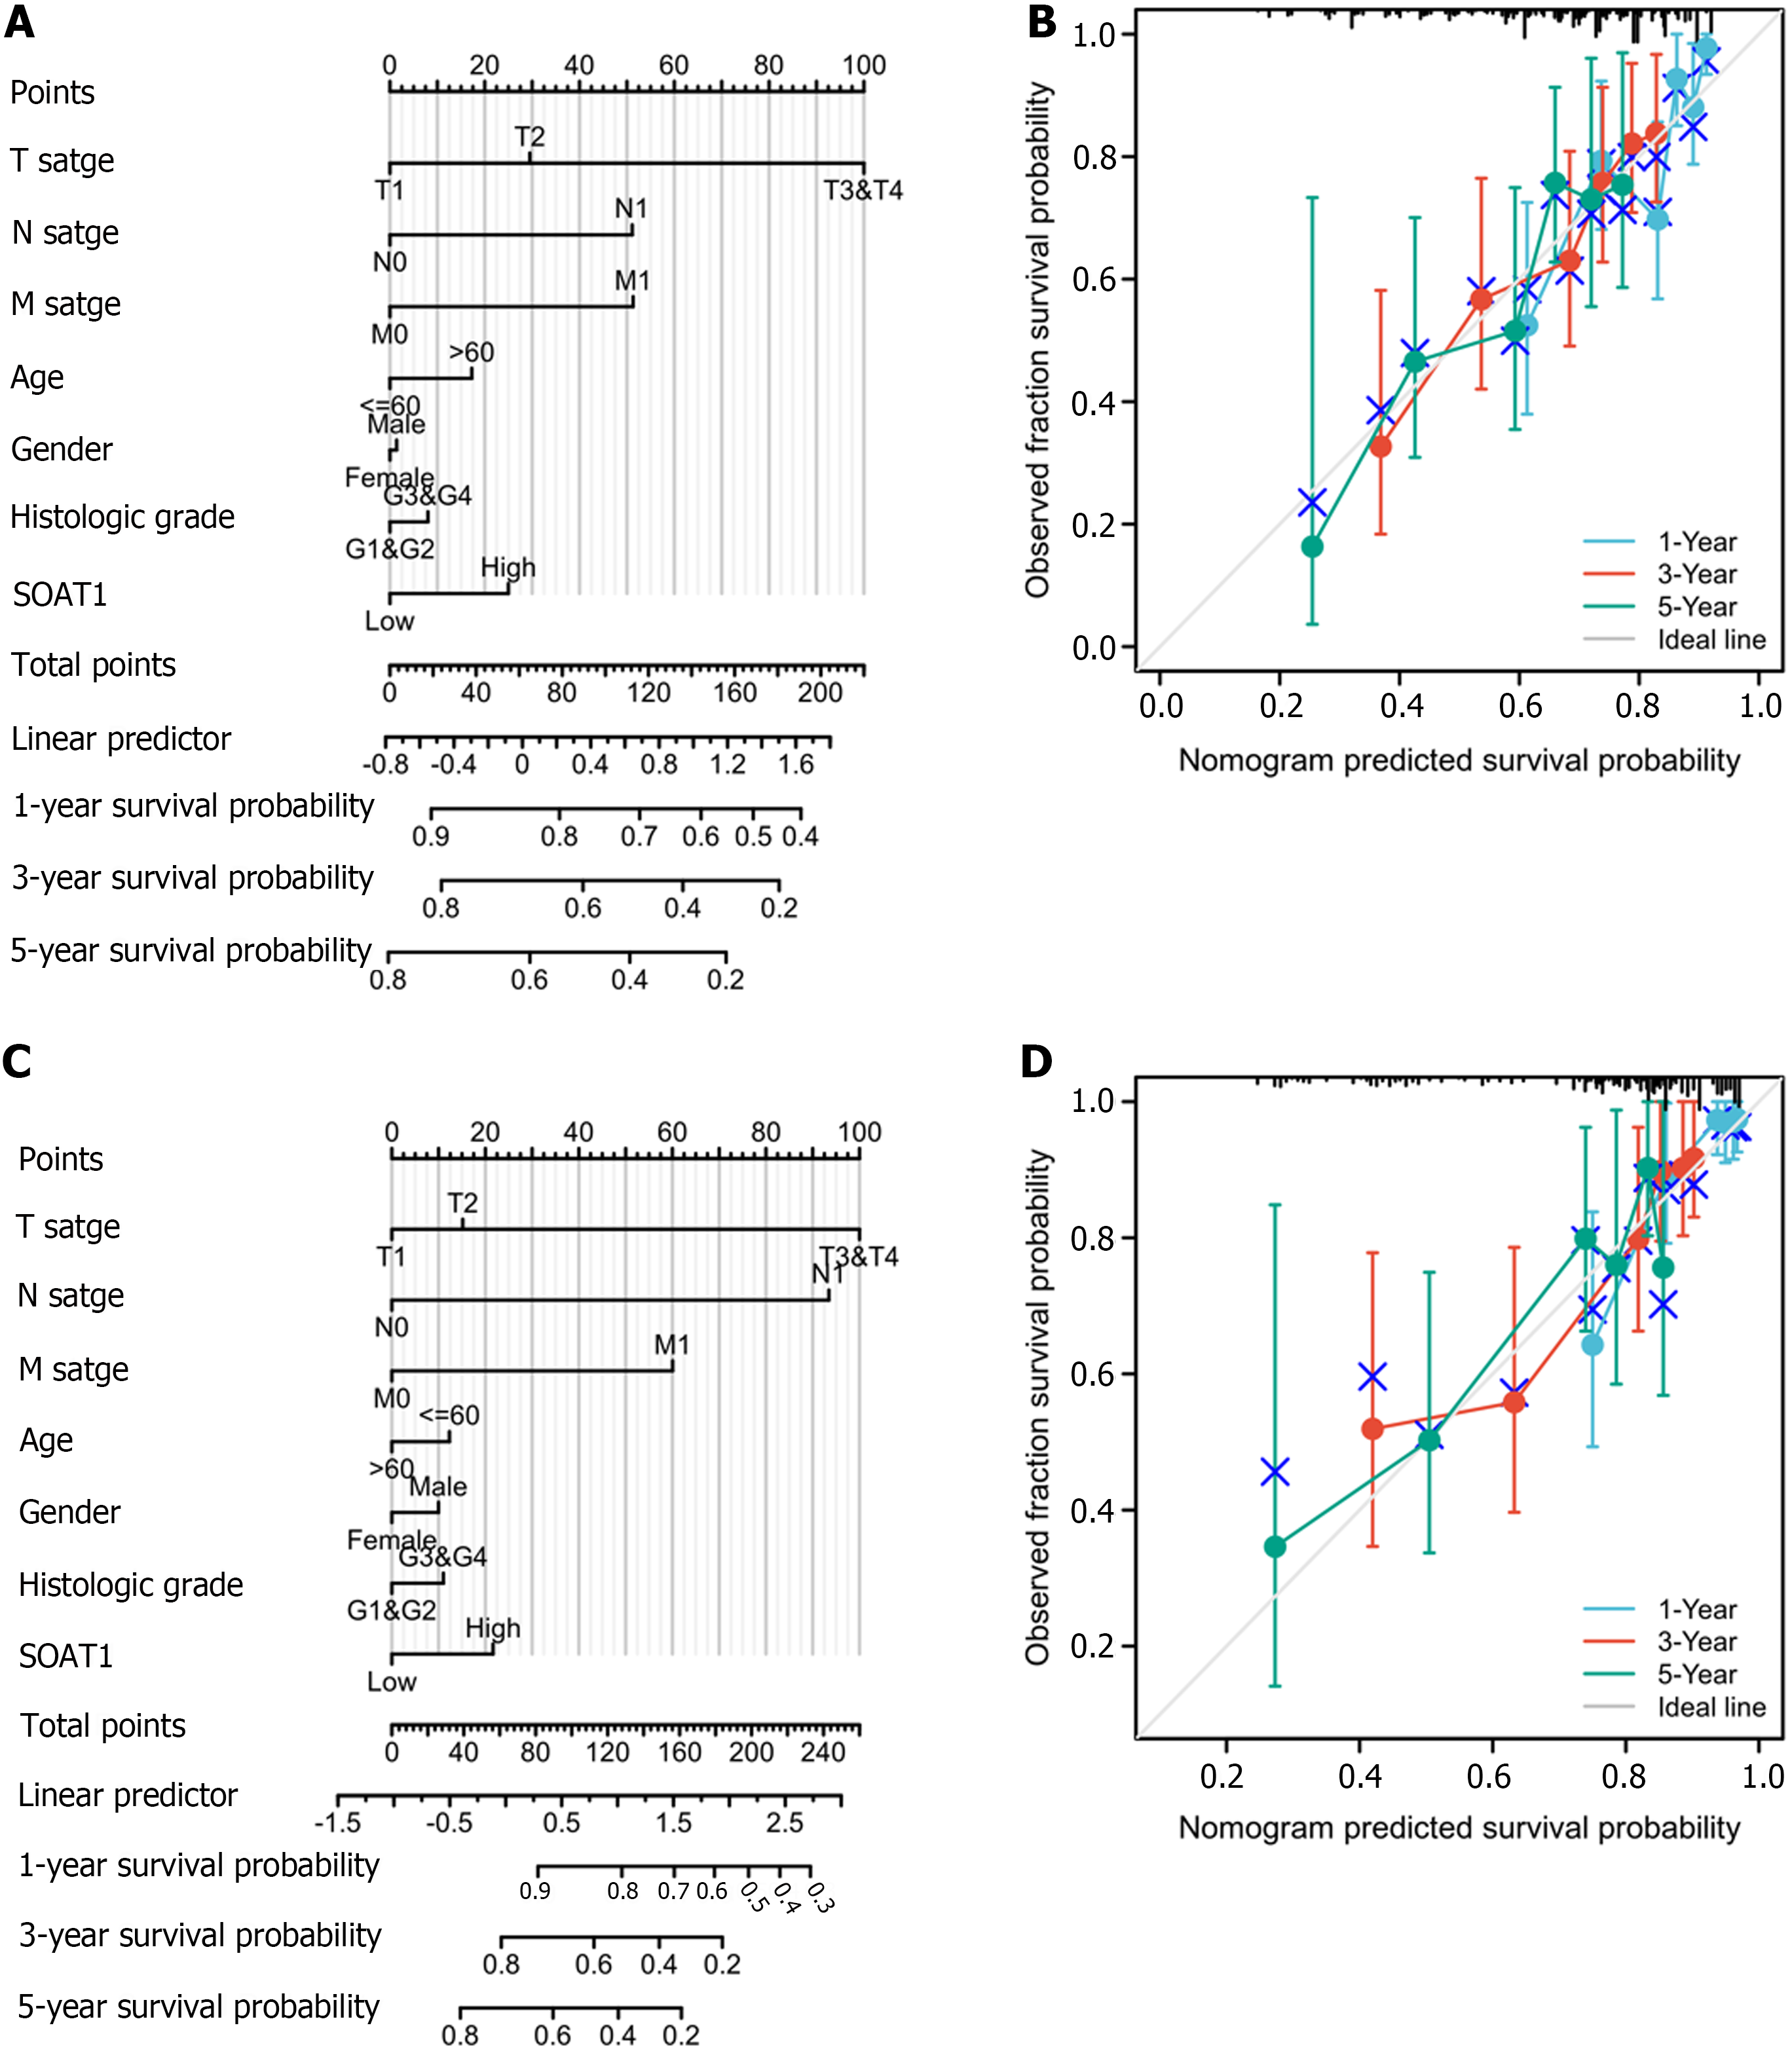
Figure 4 Prognostic value of sterol O-acyltransferase 1 expression in liver hepatocellular carcinoma.
A: Nomograms for 1-, 3-, and 5-year overall survival in different subgroups based on sterol O-acyltransferase 1 (SOAT1) expression and other clinical characteristics in liver hepatocellular carcinoma (LIHC); B: Calibration for 1-, 3-, and 5-year overall survival in different subgroups based on SOAT1 expression and other clinical characteristics in LIHC; C: Nomograms for 1-, 3-, and 5-year disease specific survival in different subgroups based on SOAT1 expression and other clinical characteristics in LIHC; D: Calibration for 1-, 3-, and 5-year disease specific survival in different subgroups based on SOAT1 expression and other clinical characteristics in LIHC.
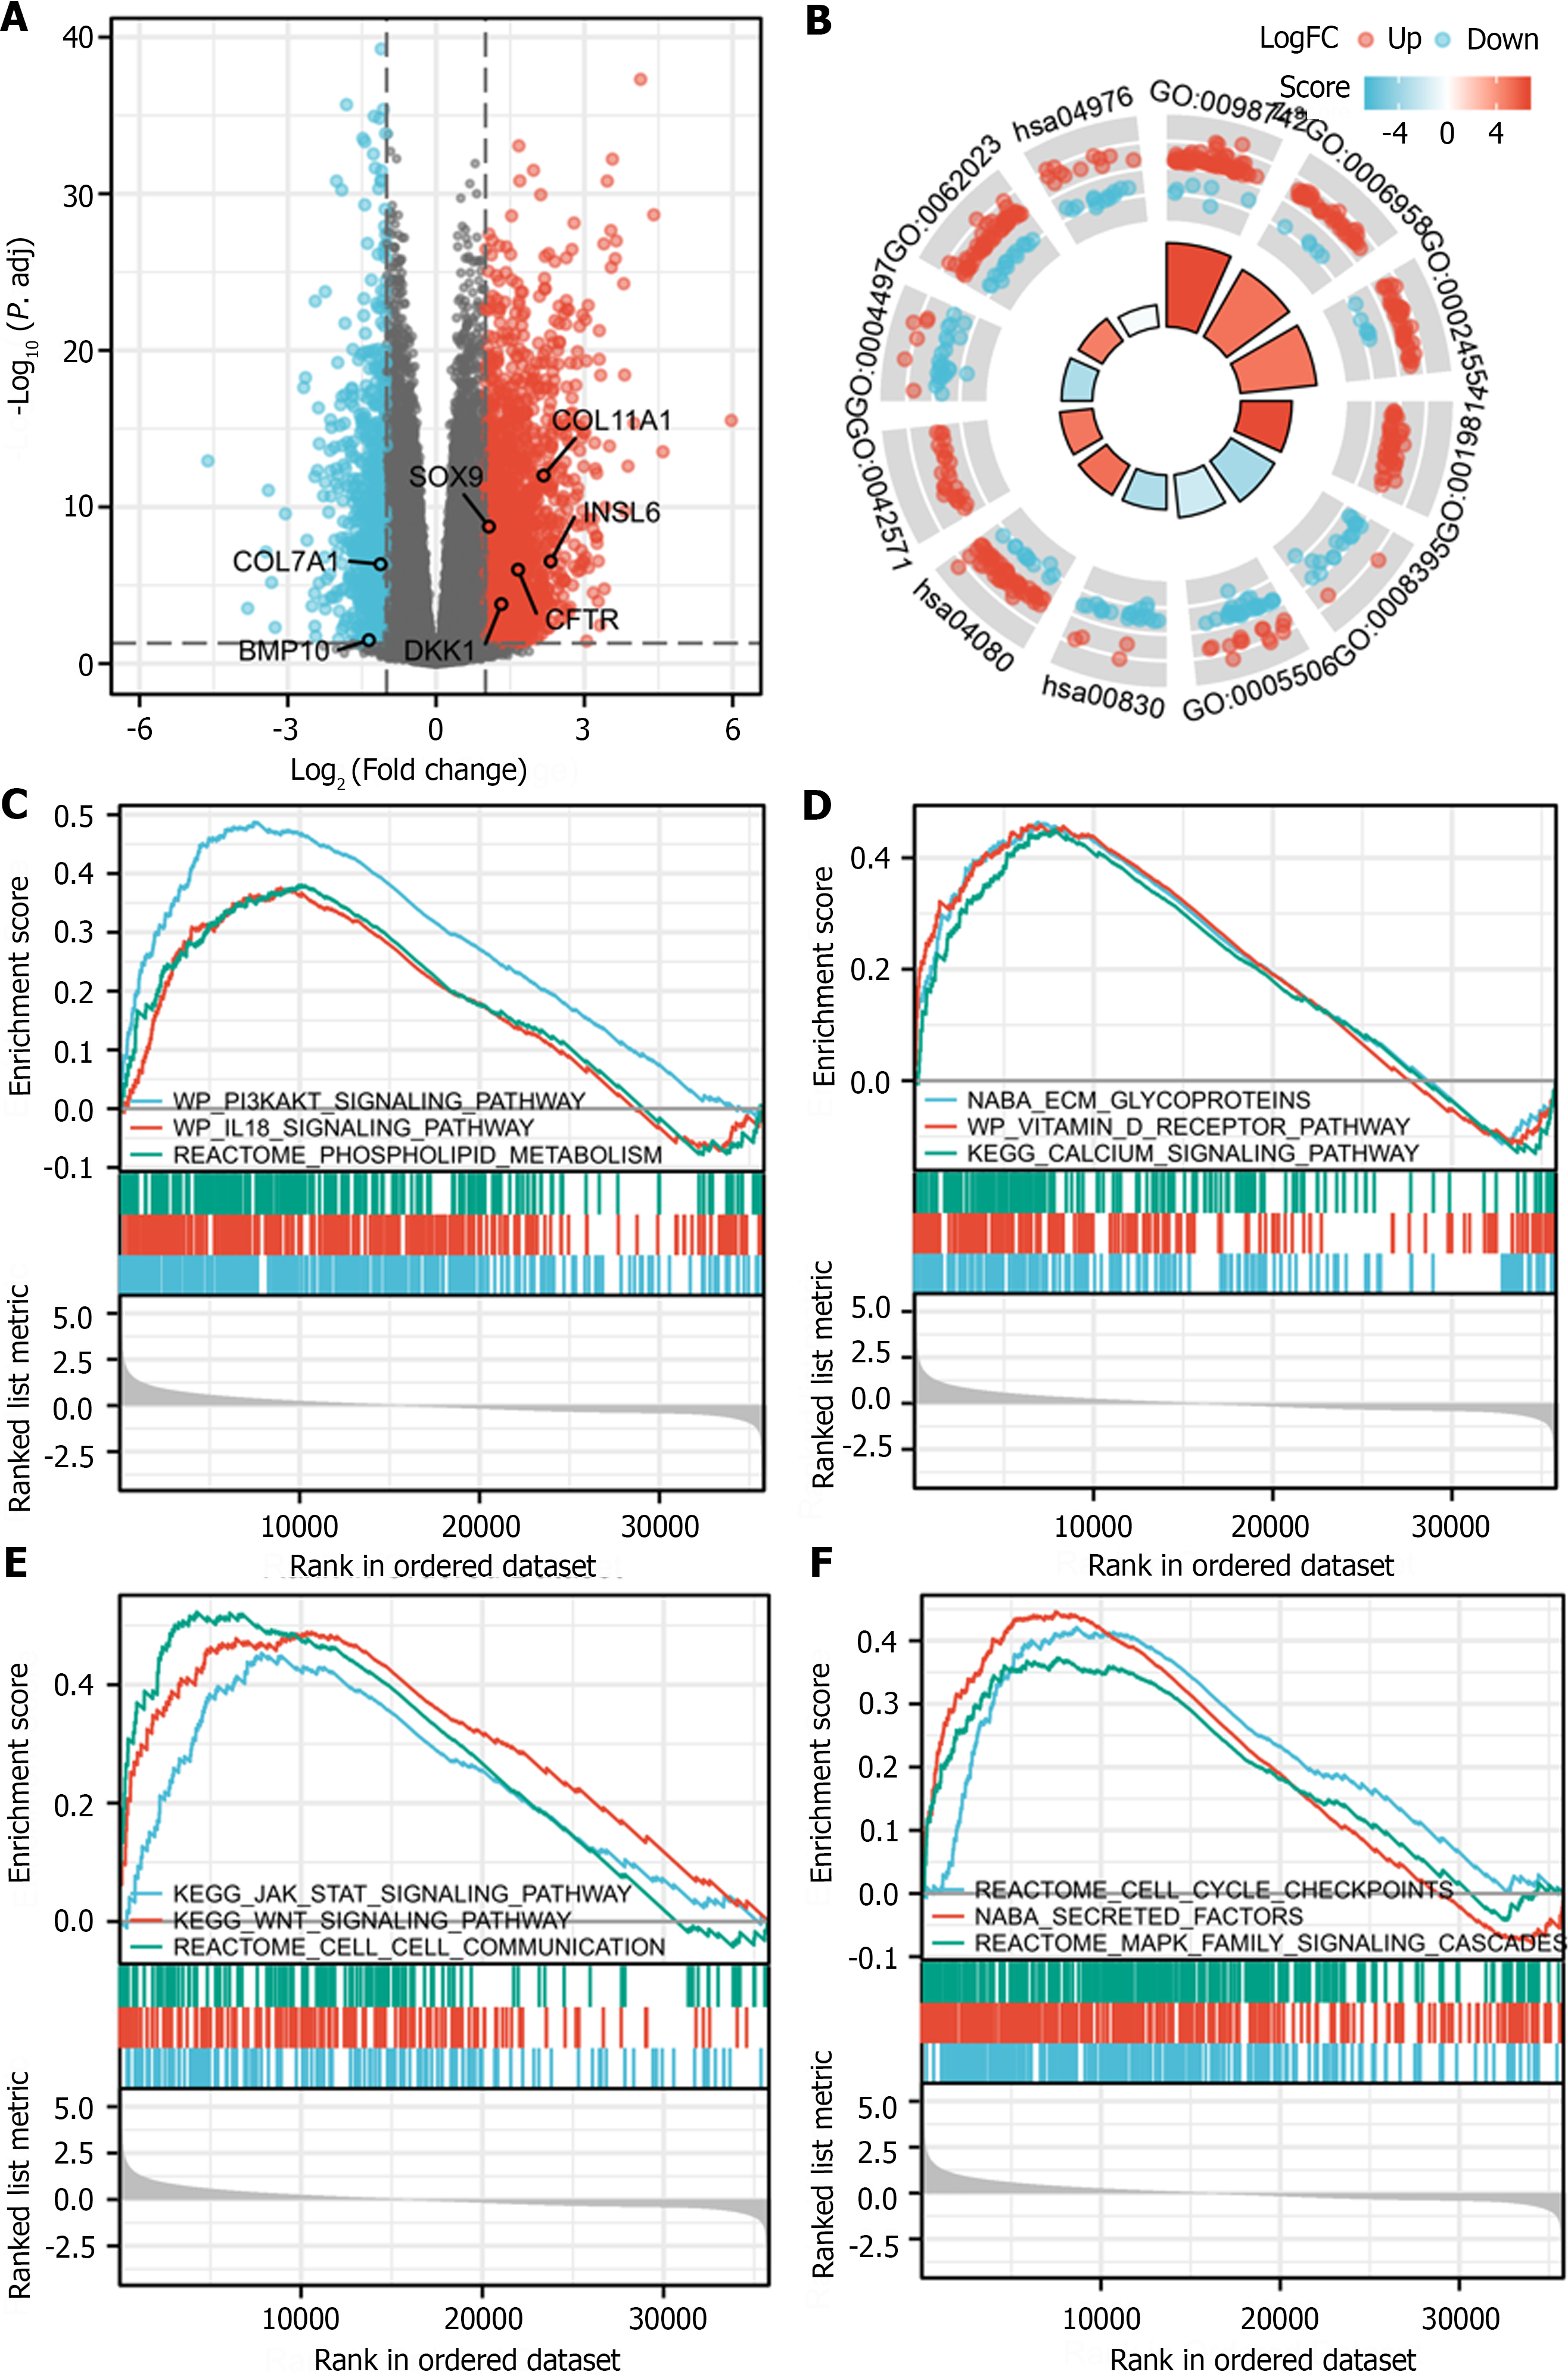
Figure 5 Differentially expressed genes between high and low sterol O-acyltransferase 1 expression groups in liver hepatocellular carcinoma.
A: Volcano plot of differentially expressed genes (DEGs) between high and low sterol O-acyltransferase 1 (SOAT1) expression groups in liver hepatocellular carcinoma (LIHC); B: Top GO terms and KEGG pathways enriched by DEGs between high and low SOAT1 expression groups in LIHC; C-F: Gene set enrichment analysis of DEGs between high and low SOAT1 expression groups in LIHC.
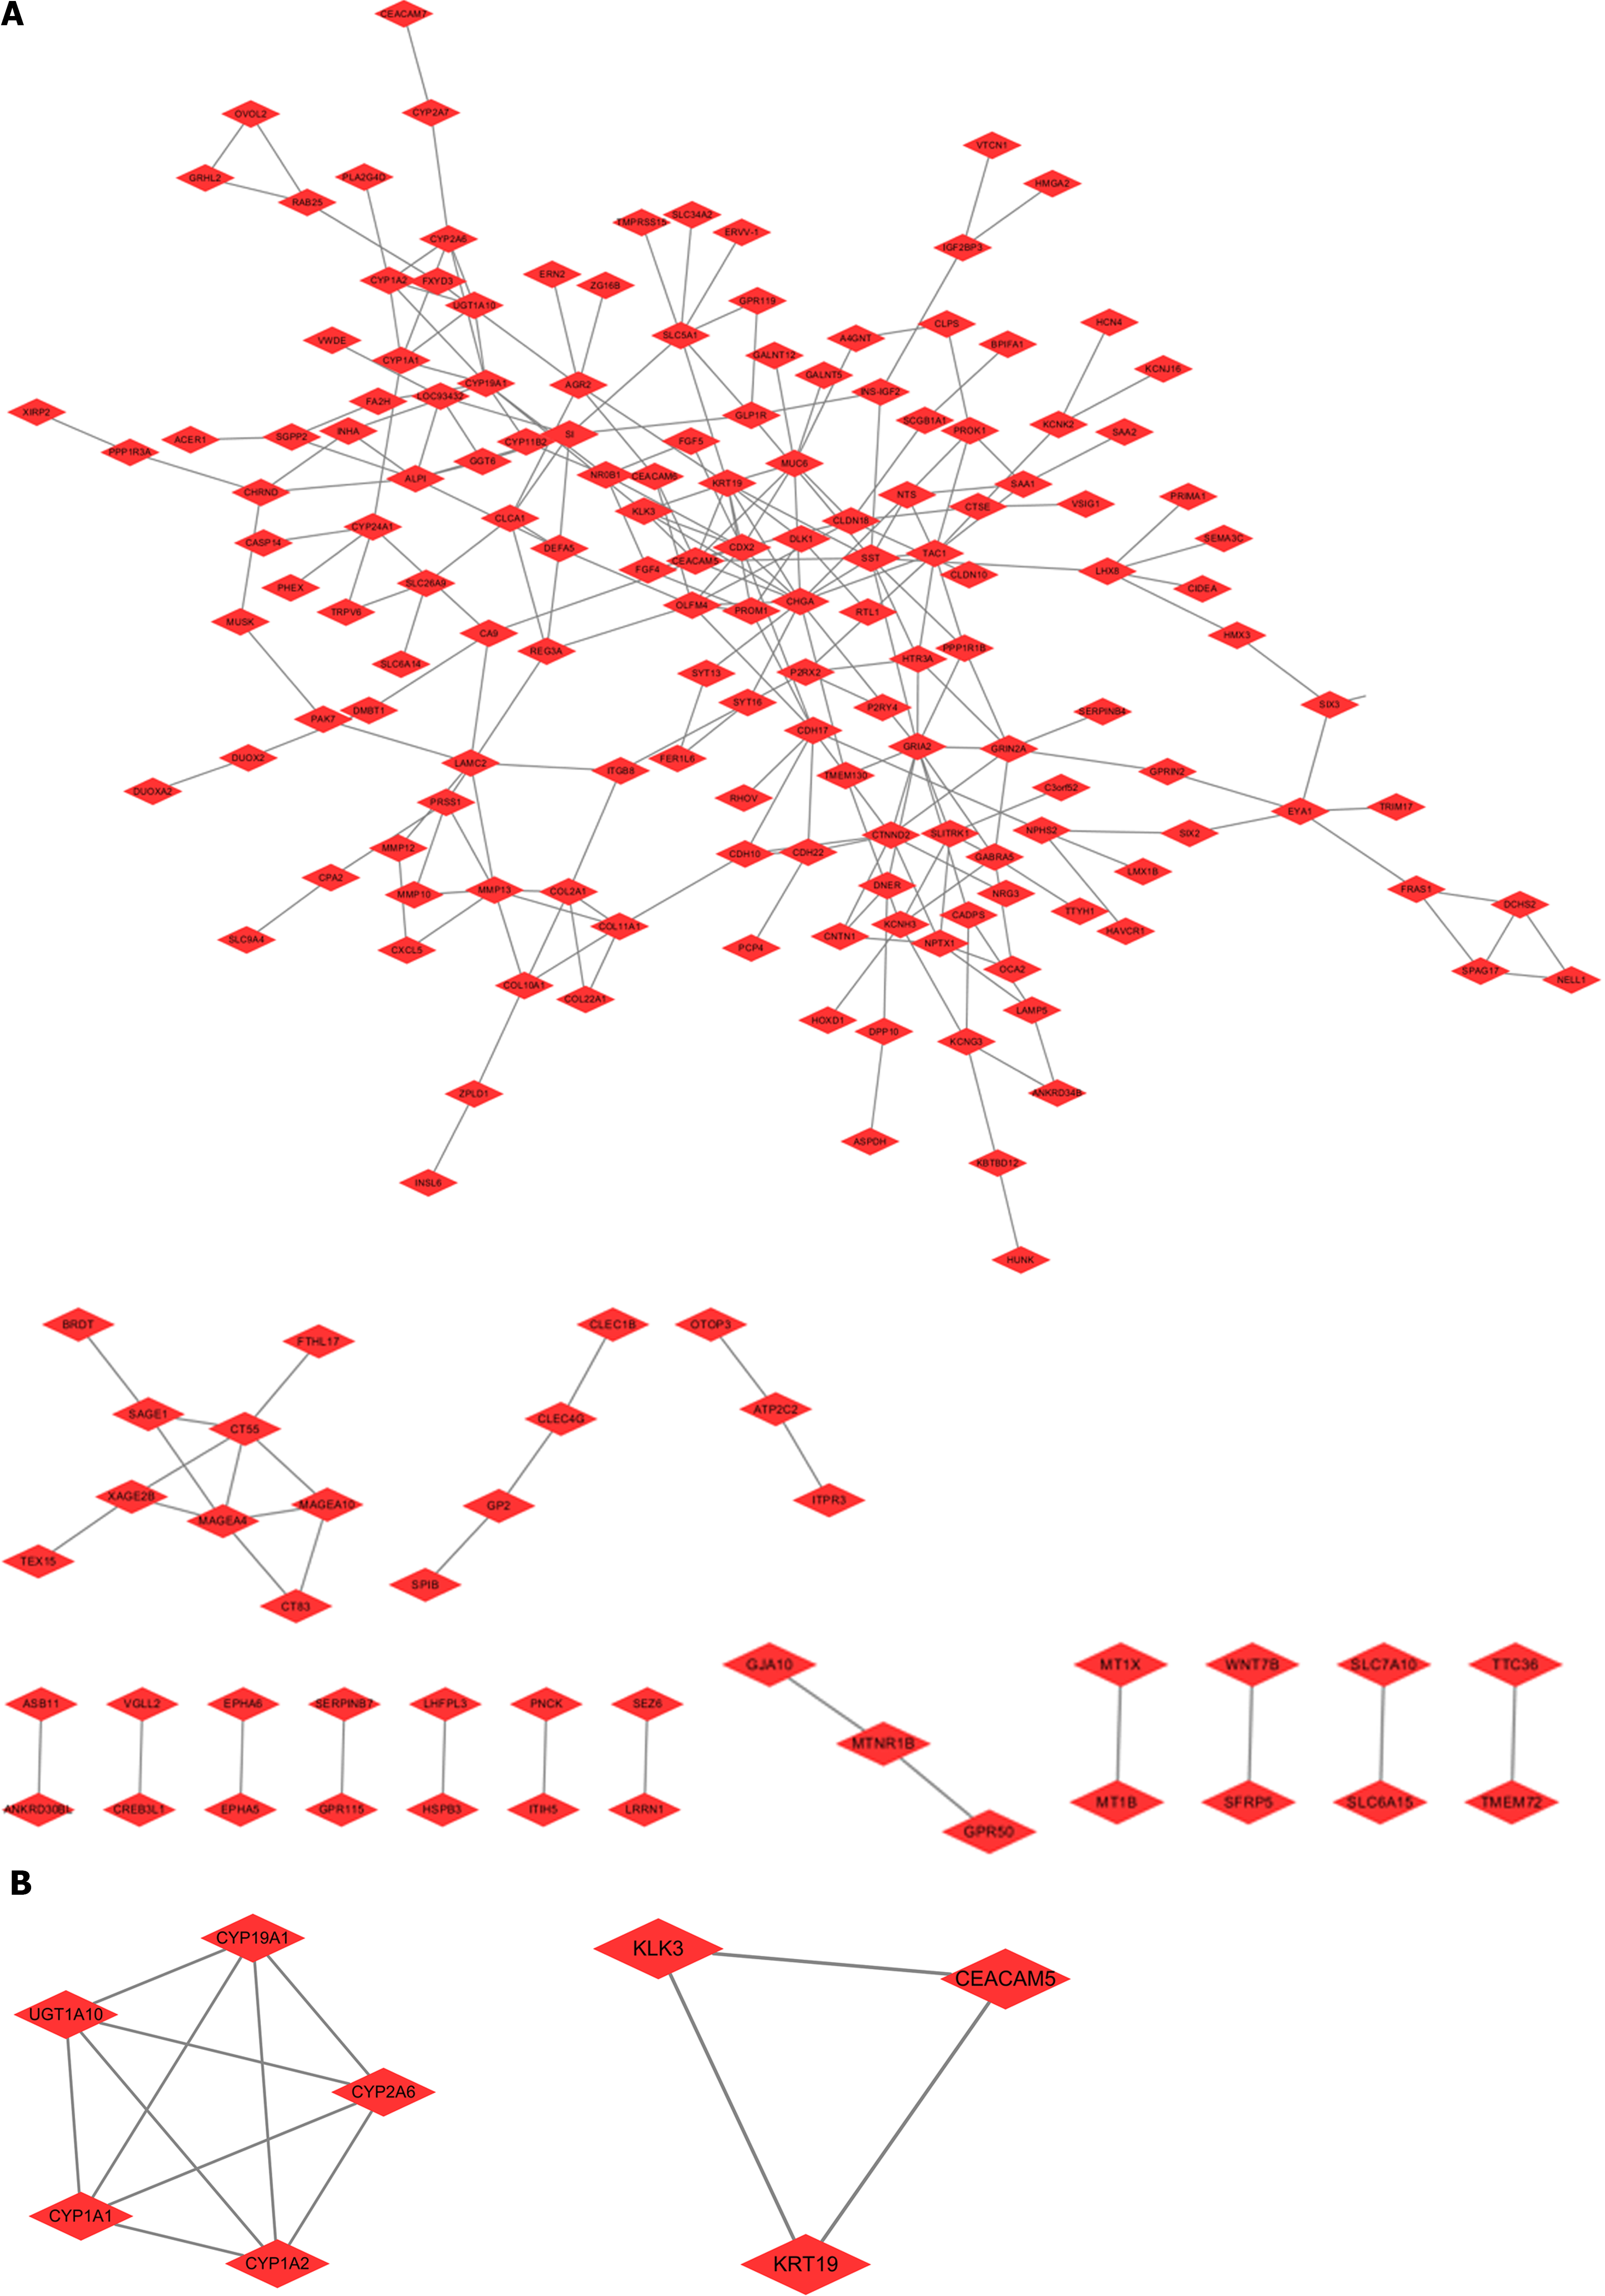
Figure 6 Protein–protein interaction network and hub genes of differentially expressed genes between the high and low sterol O-acyltransferase 1 expression groups.
A: Protein–protein interaction network of differentially expressed genes between high and low sterol O-acyltransferase 1 expression groups; B: Hub genes (two modules) screened using the Cytoscape plugin MCODE.
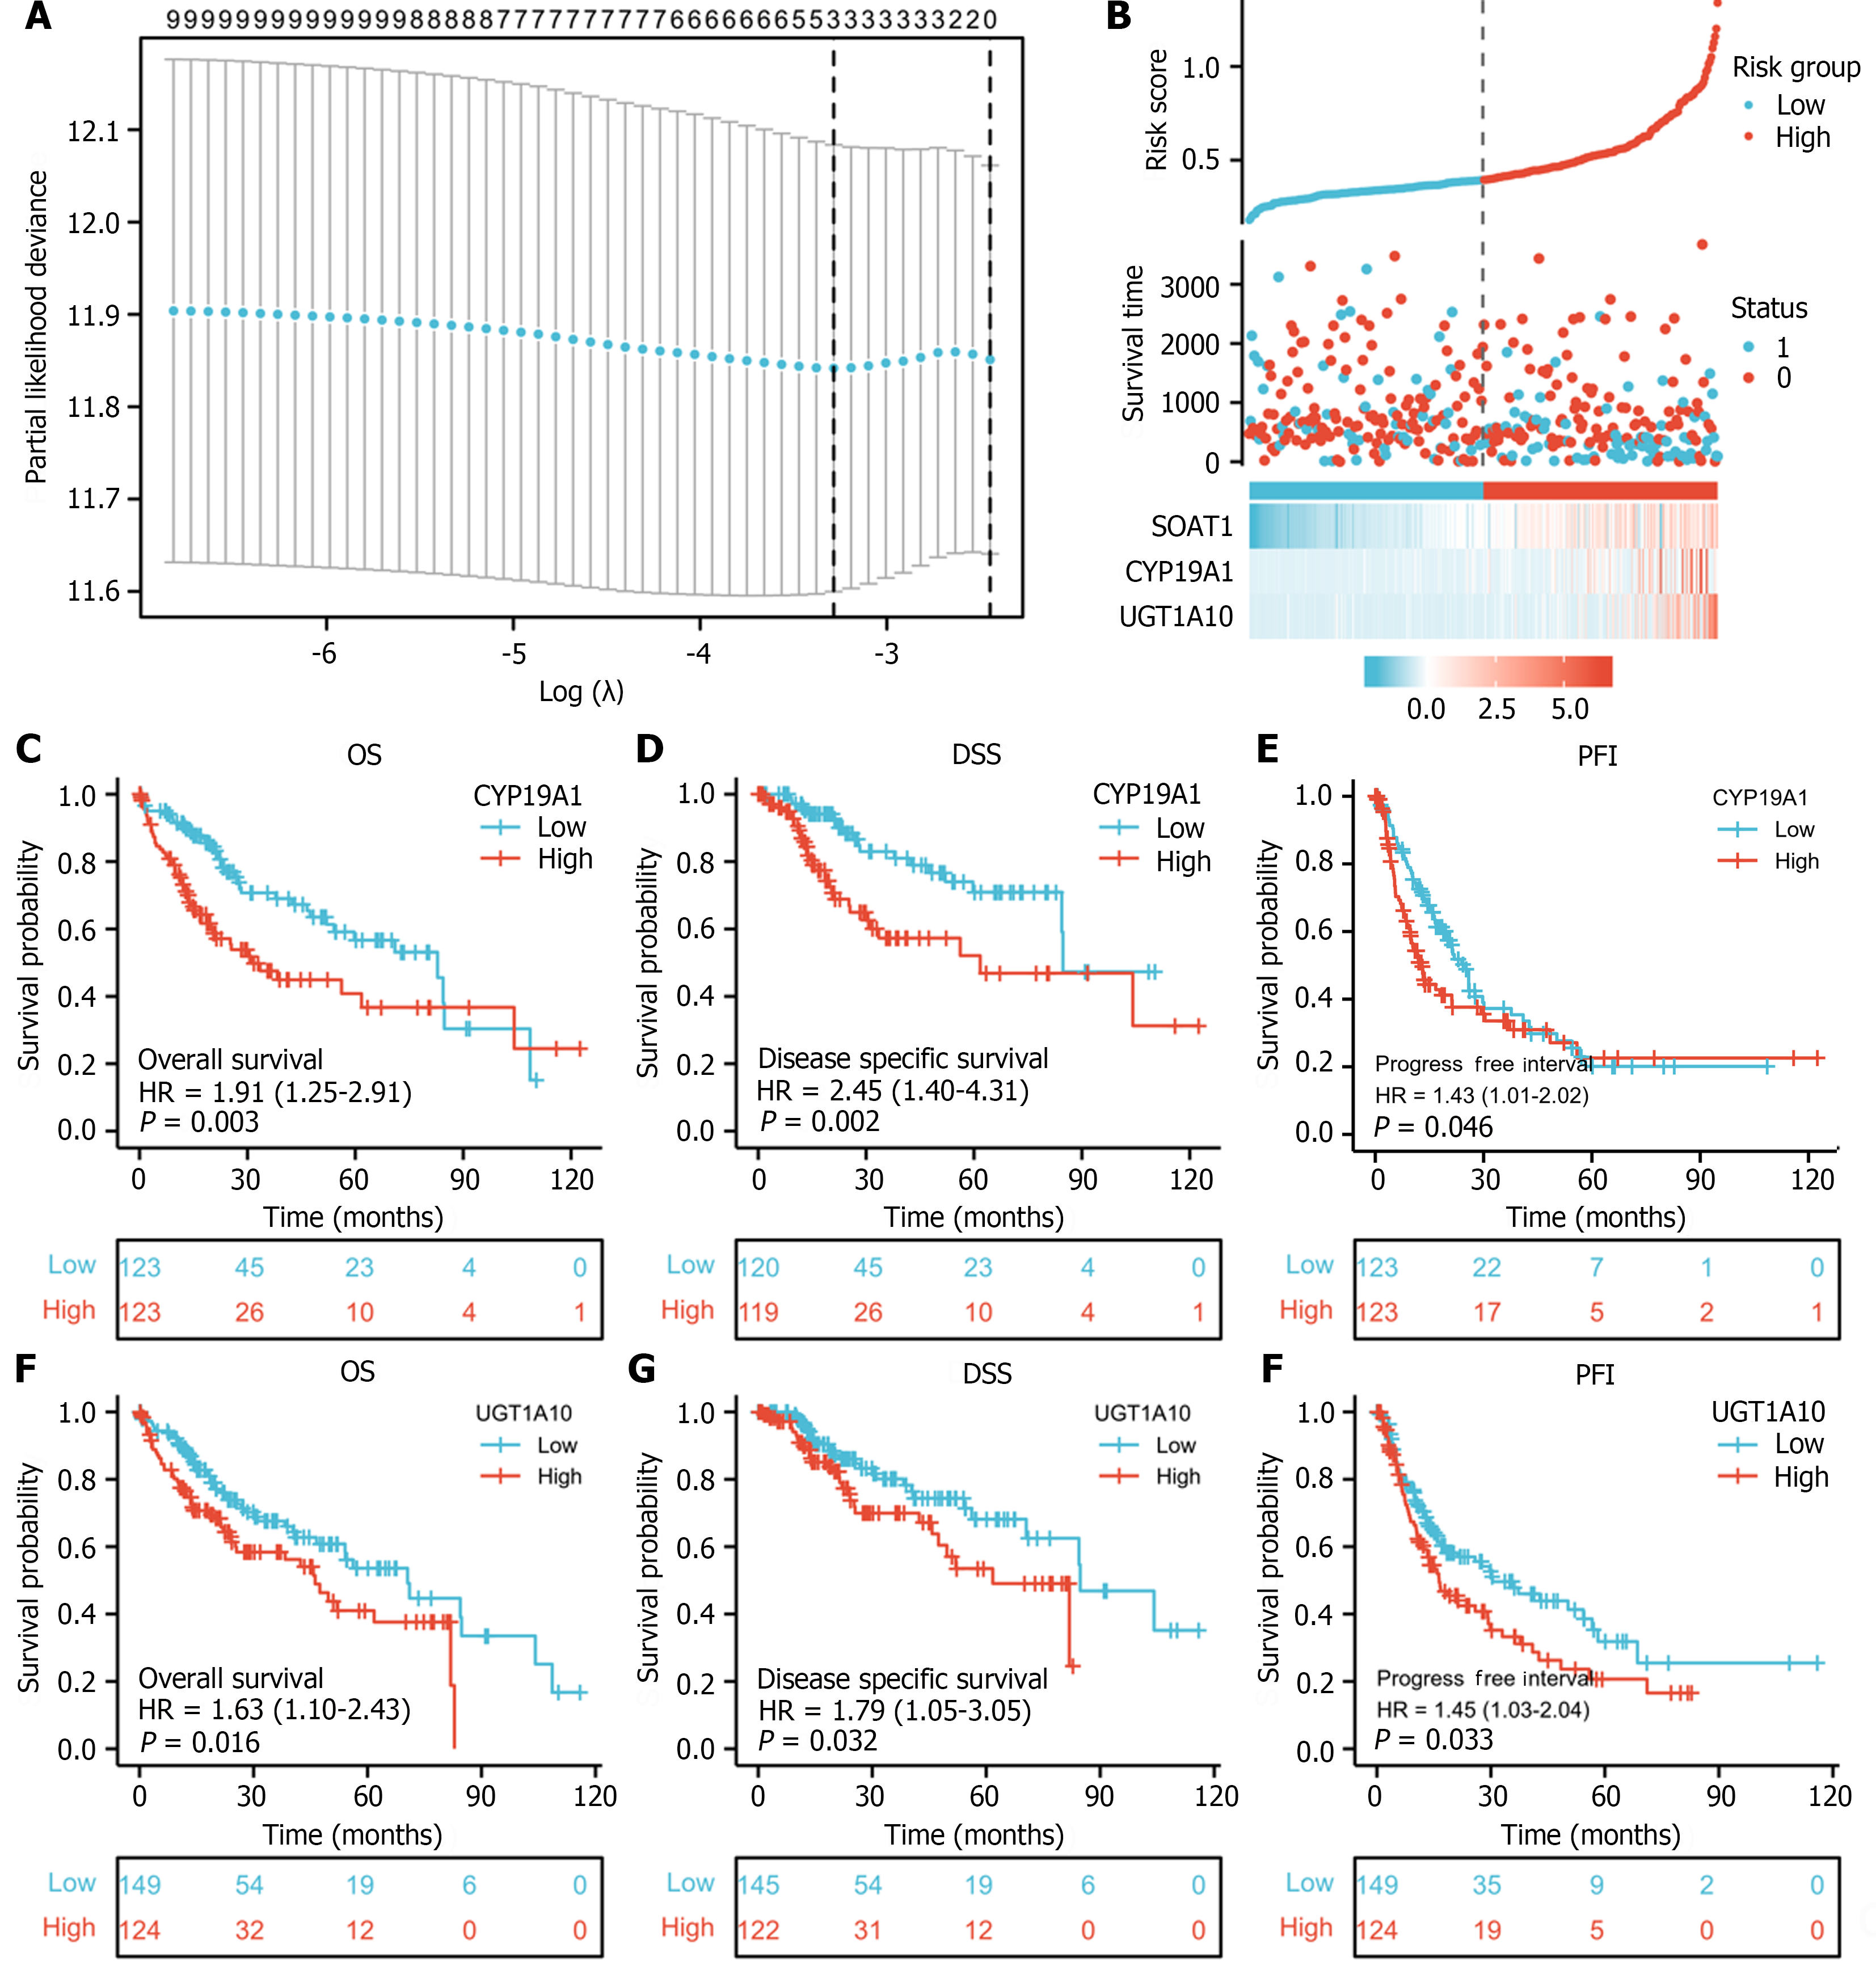
Figure 7 Effects of sterol O-acyltransferase 1 and hub genes on liver hepatocellular carcinoma.
A: Lasso regression of survival time and sterol O-acyltransferase 1 (SOAT1) and hub gene expression levels in liver hepatocellular carcinoma (LIHC); B: Risk score analysis of survival time and SOAT1 and hub gene expression levels in LIHC. 1, survival; 0, dead; C: Overall survival (OS) of LIHC patients between high and low CYP19A1 expression groups; D: Disease-specific survival (DSS) of LIHC patients between high and low CYP19A1 expression groups; E: Progression free interval of LIHC patients between high and low CYP19A1 expression groups; F: OS of LIHC patients between high and low UGT1A10 expression groups; G: DSS of LIHC patients between high and low UGT1A10 expression groups: H: Progression free interval of LIHC patients between high and low UGT1A10 expression groups. OS: Overall survival; DSS: Disease specific survival; PFI: Progression free interval.
- Citation: Gan CJ, Zheng Y, Yang B, Cao LM. Comprehensive prognostic and immune analysis of sterol O-acyltransferase 1 in patients with hepatocellular carcinoma. World J Hepatol 2024; 16(3): 439-451
- URL: https://www.wjgnet.com/1948-5182/full/v16/i3/439.htm
- DOI: https://dx.doi.org/10.4254/wjh.v16.i3.439


