Copyright
©The Author(s) 2024.
World J Hepatol. Feb 27, 2024; 16(2): 286-293
Published online Feb 27, 2024. doi: 10.4254/wjh.v16.i2.286
Published online Feb 27, 2024. doi: 10.4254/wjh.v16.i2.286
Figure 1 Initial and second liver biopsy.
A and B: The initial liver biopsy showing inflammatory cell infiltration mainly composed of lymphocytes and plasma cells in the portal and lobular areas, and severe interface hepatitis with rosette formation. Hematoxylin and eosin staining (HE: A, × 100; B, × 200); C and D: A second liver biopsy shows improvement of the interface hepatitis, yet a massive infiltration of lymphocytes and plasma cells is noted. B and D are magnified images of the yellow square in A and C, the black arrow shows the proliferation of interlobular bile ducts in the portal triad area (HE: C, × 100; D, × 200).
Figure 2 Aspartate aminotransferase, alanine aminotransferase, and IgG levels over time.
The figure shows that aspartate aminotransferase (AST), alanine aminotransferase (ALT), and IgG are elevated after direct acting antiviral agents therapy. After the start of prednisolone, AST, ALT, and IgG decrease significantly and approach the normal limits. ALT: Alanine aminotransferase; AST: Aspartate aminotransferase; LDV: Ledipasvir; PSL: Prednisolone; SOF: Sofosbuvir; SVR: Sustained virological response; UDCA: Ursodeoxycholic acid.
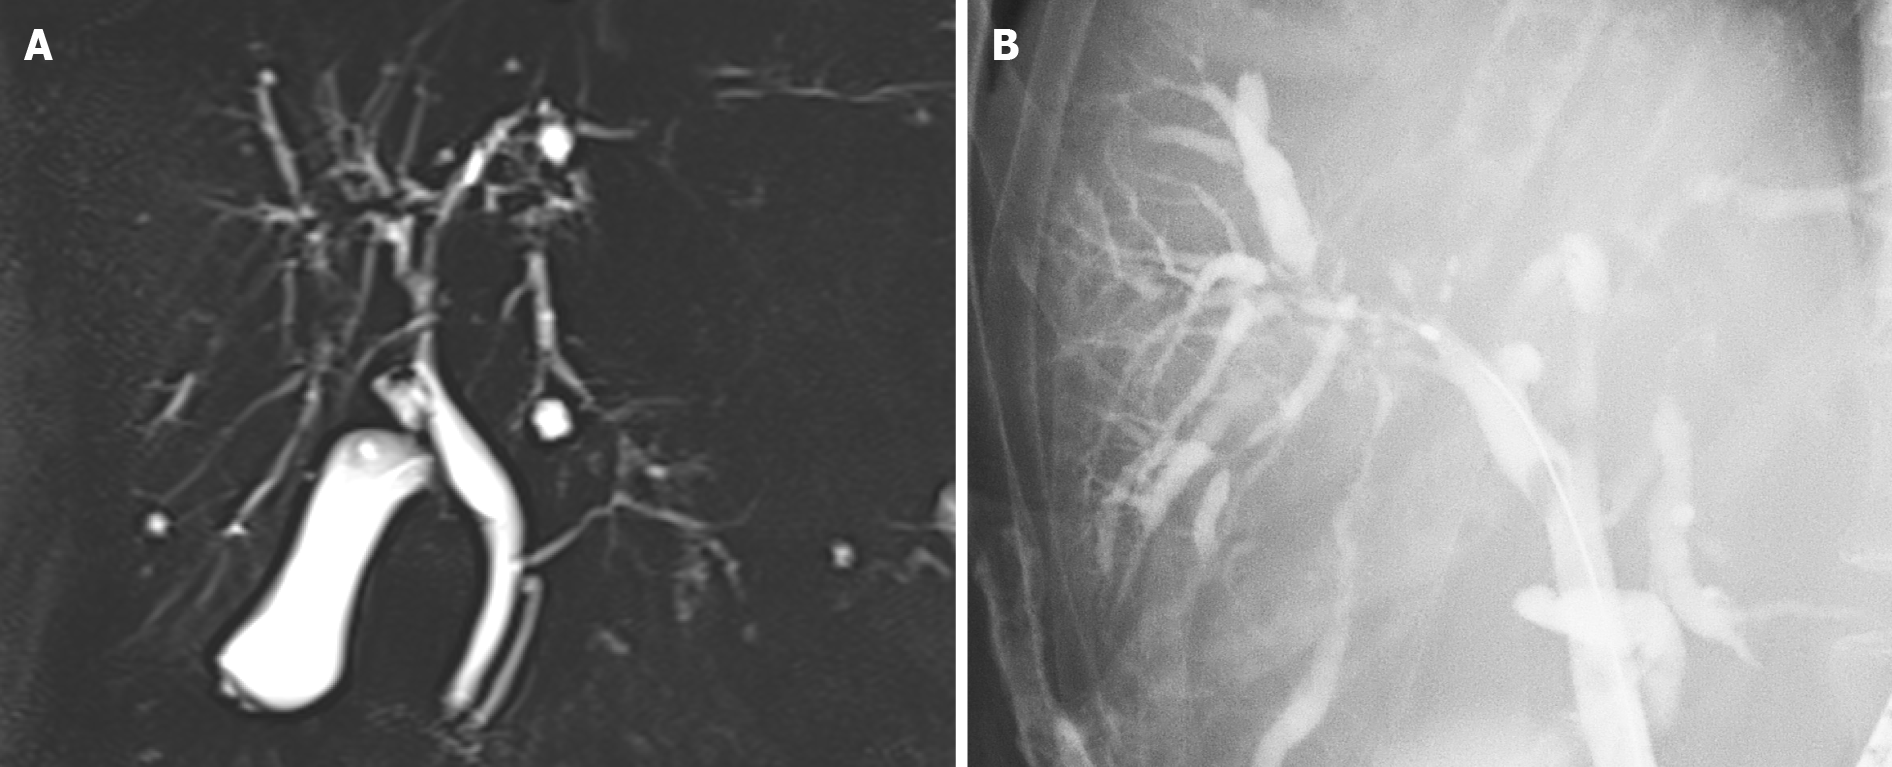
Figure 3 Magnetic resonance cholangiopancreatography and endoscopic retrograde cholangiopancreatography.
A: Magnetic resonance cholangiopancreatography; B: Endoscopic retrograde cholangiopancreatography shows diffuse stenosis extending from the intrahepatic bile duct to the common hepatic duct, with dilation of the peripheral bile duct.
- Citation: Morihisa Y, Chung H, Towatari S, Yamashita D, Inokuma T. Autoimmune hepatitis and primary sclerosing cholangitis after direct-acting antiviral treatment for hepatitis C virus: A case report. World J Hepatol 2024; 16(2): 286-293
- URL: https://www.wjgnet.com/1948-5182/full/v16/i2/286.htm
- DOI: https://dx.doi.org/10.4254/wjh.v16.i2.286


