Copyright
©The Author(s) 2024.
World J Hepatol. Feb 27, 2024; 16(2): 251-263
Published online Feb 27, 2024. doi: 10.4254/wjh.v16.i2.251
Published online Feb 27, 2024. doi: 10.4254/wjh.v16.i2.251
Figure 1 Flow chart of enrollment and exclusion.
According to the inclusion criteria, a total of 316 patients were enrolled in the study. Based on the exclusion criteria, only 244 patients were enrolled and further divided into three groups (T1, T2, T3) in this study. The levels of G3BP1 on admission and at discharge were detected, and the relevant indicators and survival time of patients after admission and discharge were recorded. A validation set of 514 patients was collected to verify the predicted effect of G3BP1. ALF: Acute liver failure; ACLF: Acute-on-chronic liver failure. T1 group: The group patients with the changed value of the difference of G3BP1 between the level of discharge and admission (difG3BP1) was less than 0; T2 group: The group patients with the changed value of difG3BP1 was more than 0 and less than 1; T3 group: The group patients with the changed value of difG3BP1 was more than 1.
Figure 2 The overall distribution of the difference of G3BP1 between the value of discharge and admission.
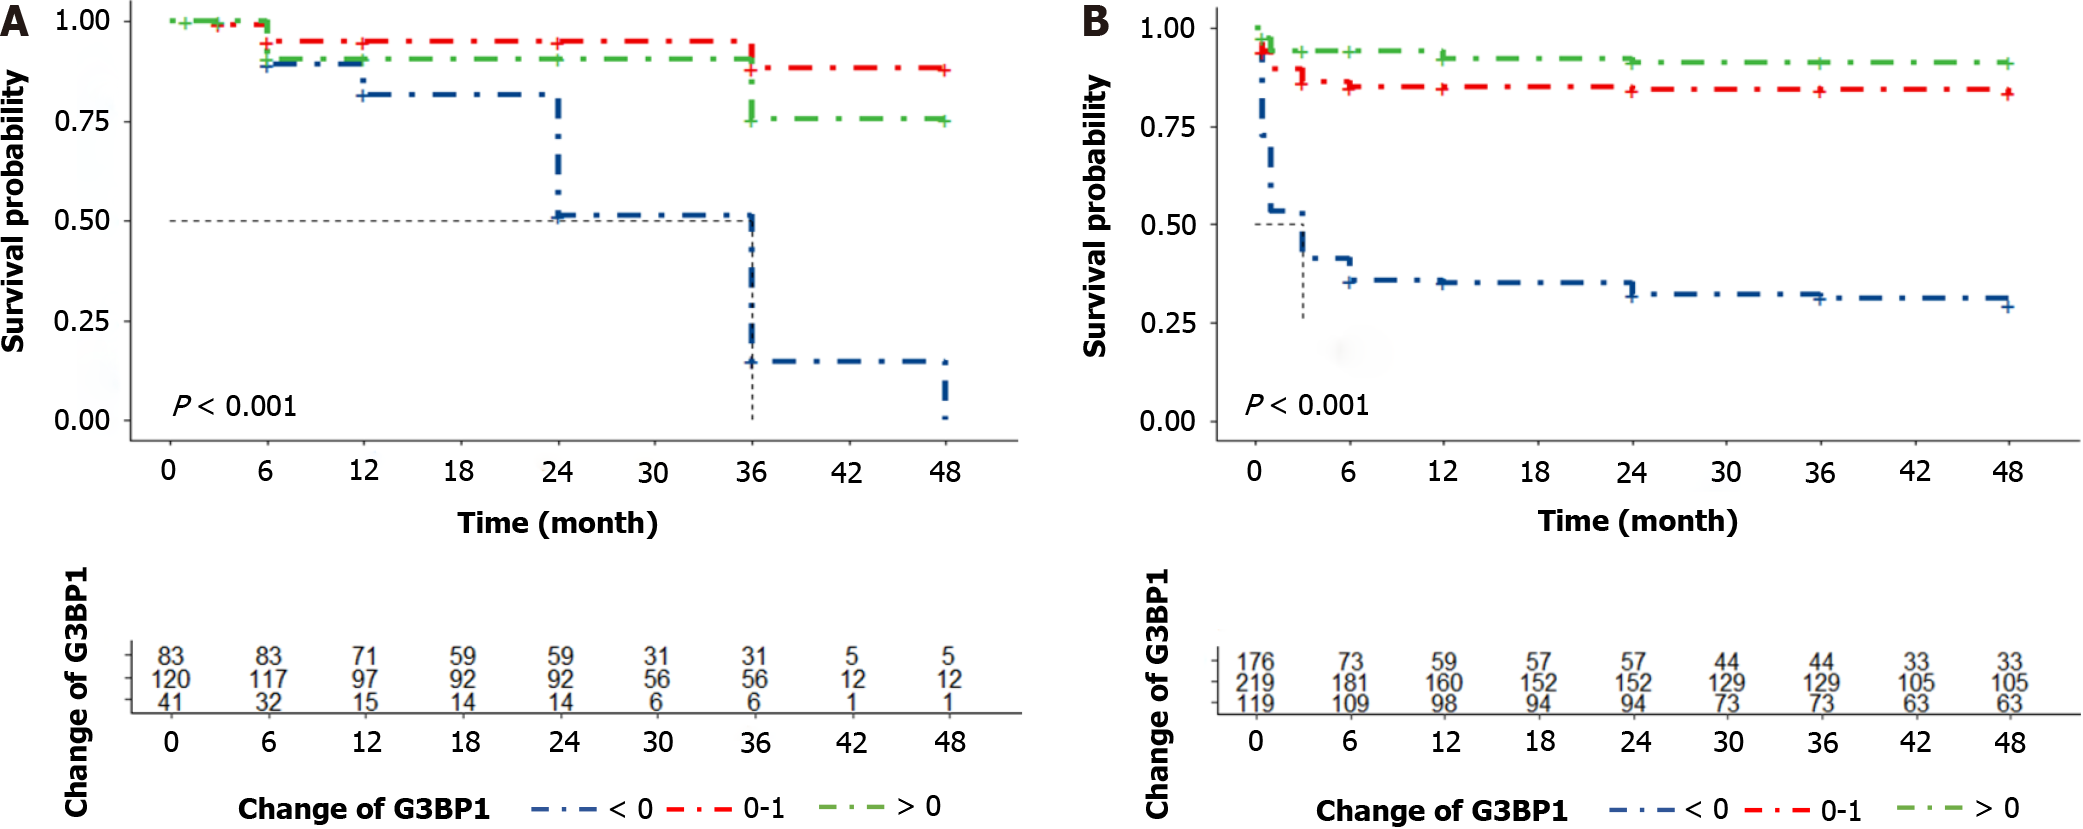
Figure 3 Difference of G3BP1 between the value of discharge and admission level at biopsy and prediction of artificial liver support system treated acute-on-chronic liver failure and acute liver failure patients in training and validation cohorts.
A and B: The value of difference of G3BP1 between the level of discharge and admission levels had a graded relationship with risk for artificial liver support system treated acute-on-chronic liver failure and acute liver failure patients’ progression in the (A) training and (B) validation cohorts.
Figure 4 Diagram of the relationship between model error and the number of decision trees, and prediction model of random forest.
A: Quantity relation diagram for error rate and number of trees; B: Random forest.
- Citation: Li WY, Wang LW, Dong J, Wang Y. Evaluation of G3BP1 in the prognosis of acute and acute-on-chronic liver failure after the treatment of artificial liver support system. World J Hepatol 2024; 16(2): 251-263
- URL: https://www.wjgnet.com/1948-5182/full/v16/i2/251.htm
- DOI: https://dx.doi.org/10.4254/wjh.v16.i2.251


