Copyright
©The Author(s) 2024.
World J Hepatol. Nov 27, 2024; 16(11): 1265-1281
Published online Nov 27, 2024. doi: 10.4254/wjh.v16.i11.1265
Published online Nov 27, 2024. doi: 10.4254/wjh.v16.i11.1265
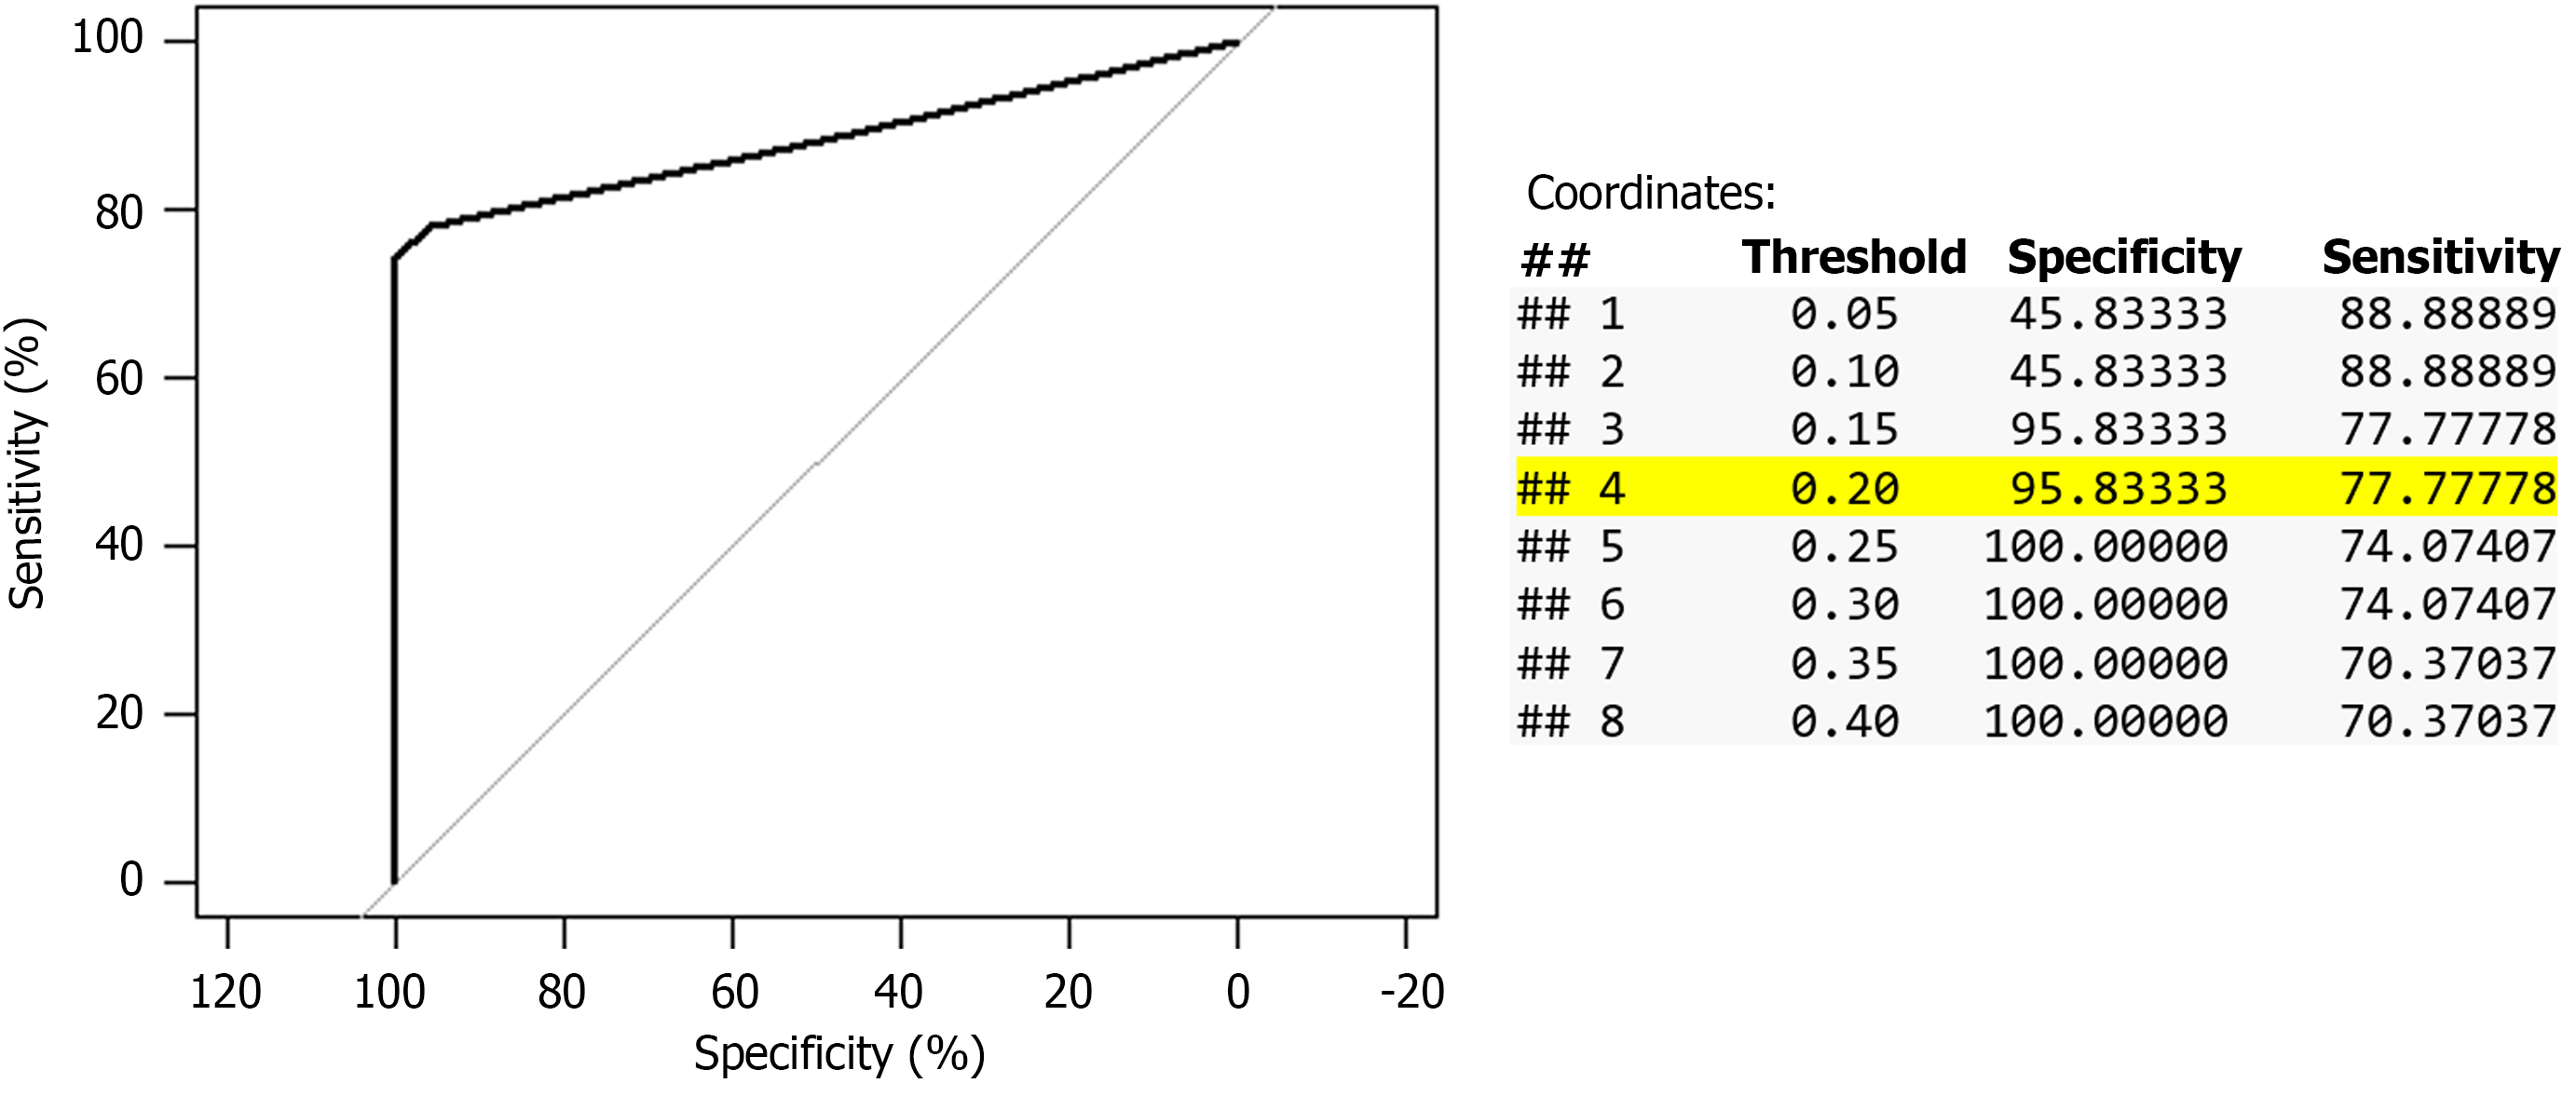
Figure 1 Receiver operating characteristic analysis of automated cell count method in cohort 2.
Area under the curve: 88.12%,95%CI: 78.44%-97.79%.
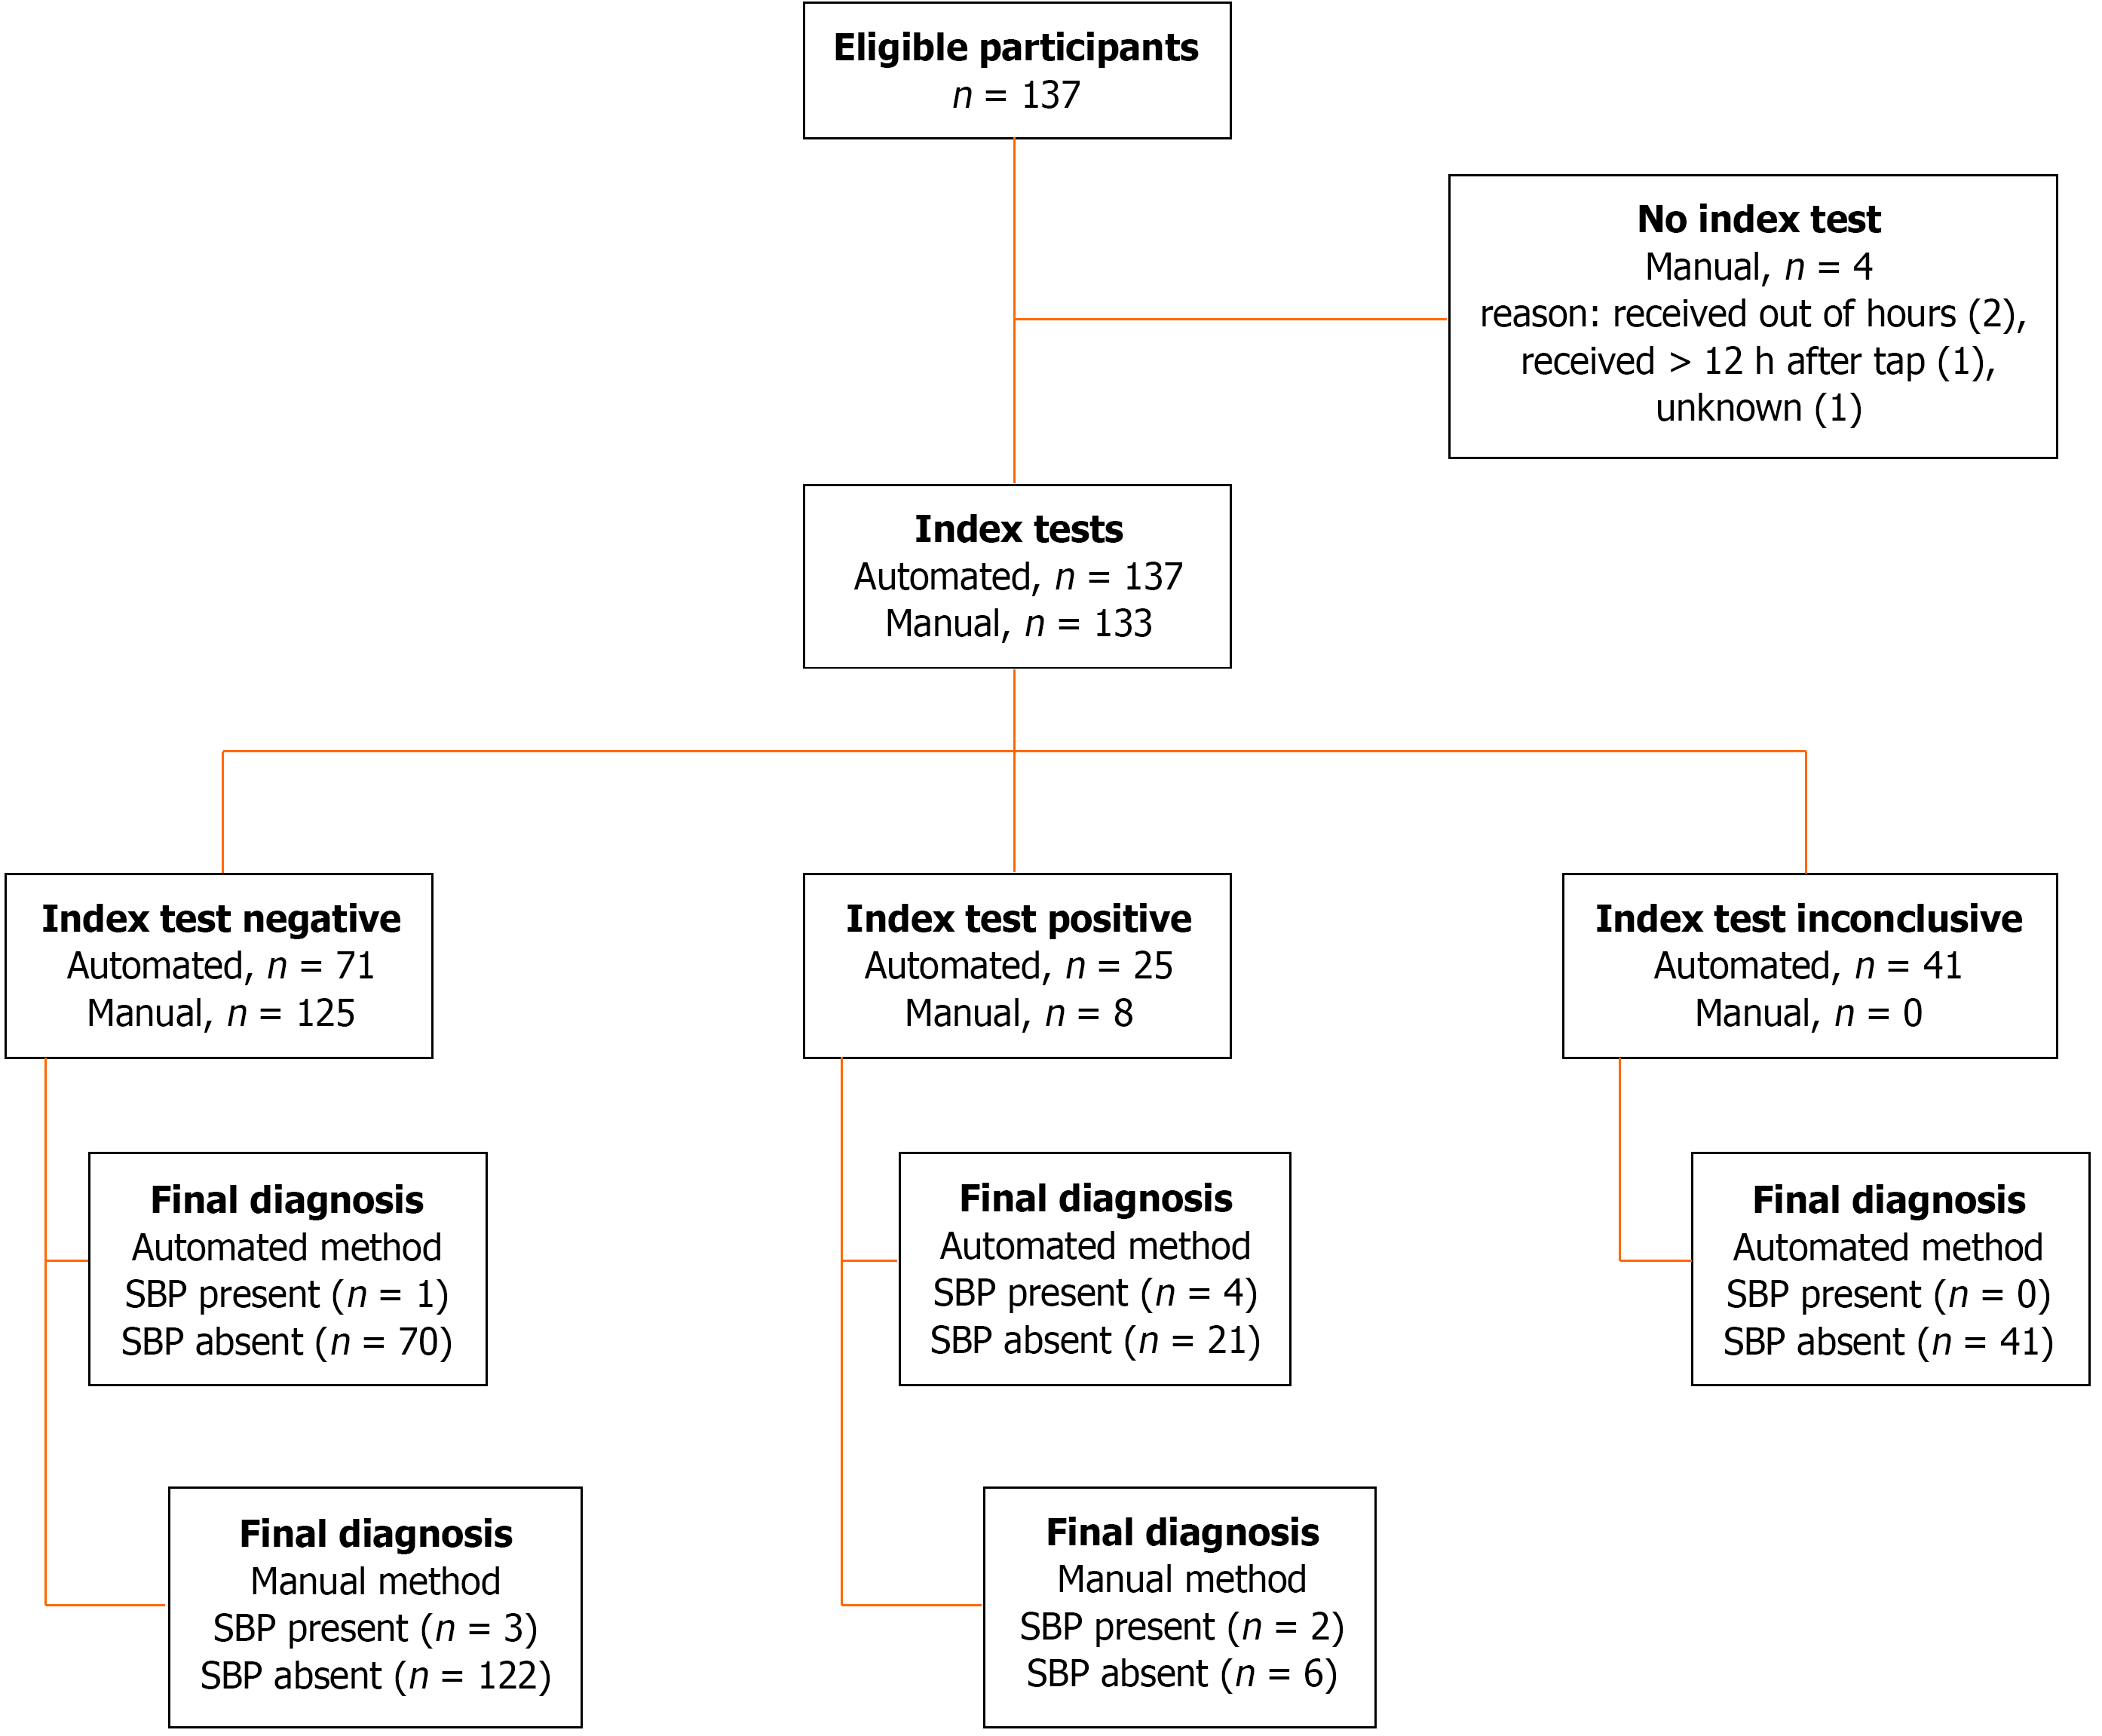
Figure 2 STARD diagram reporting flow of cases through the study in cohort 1.
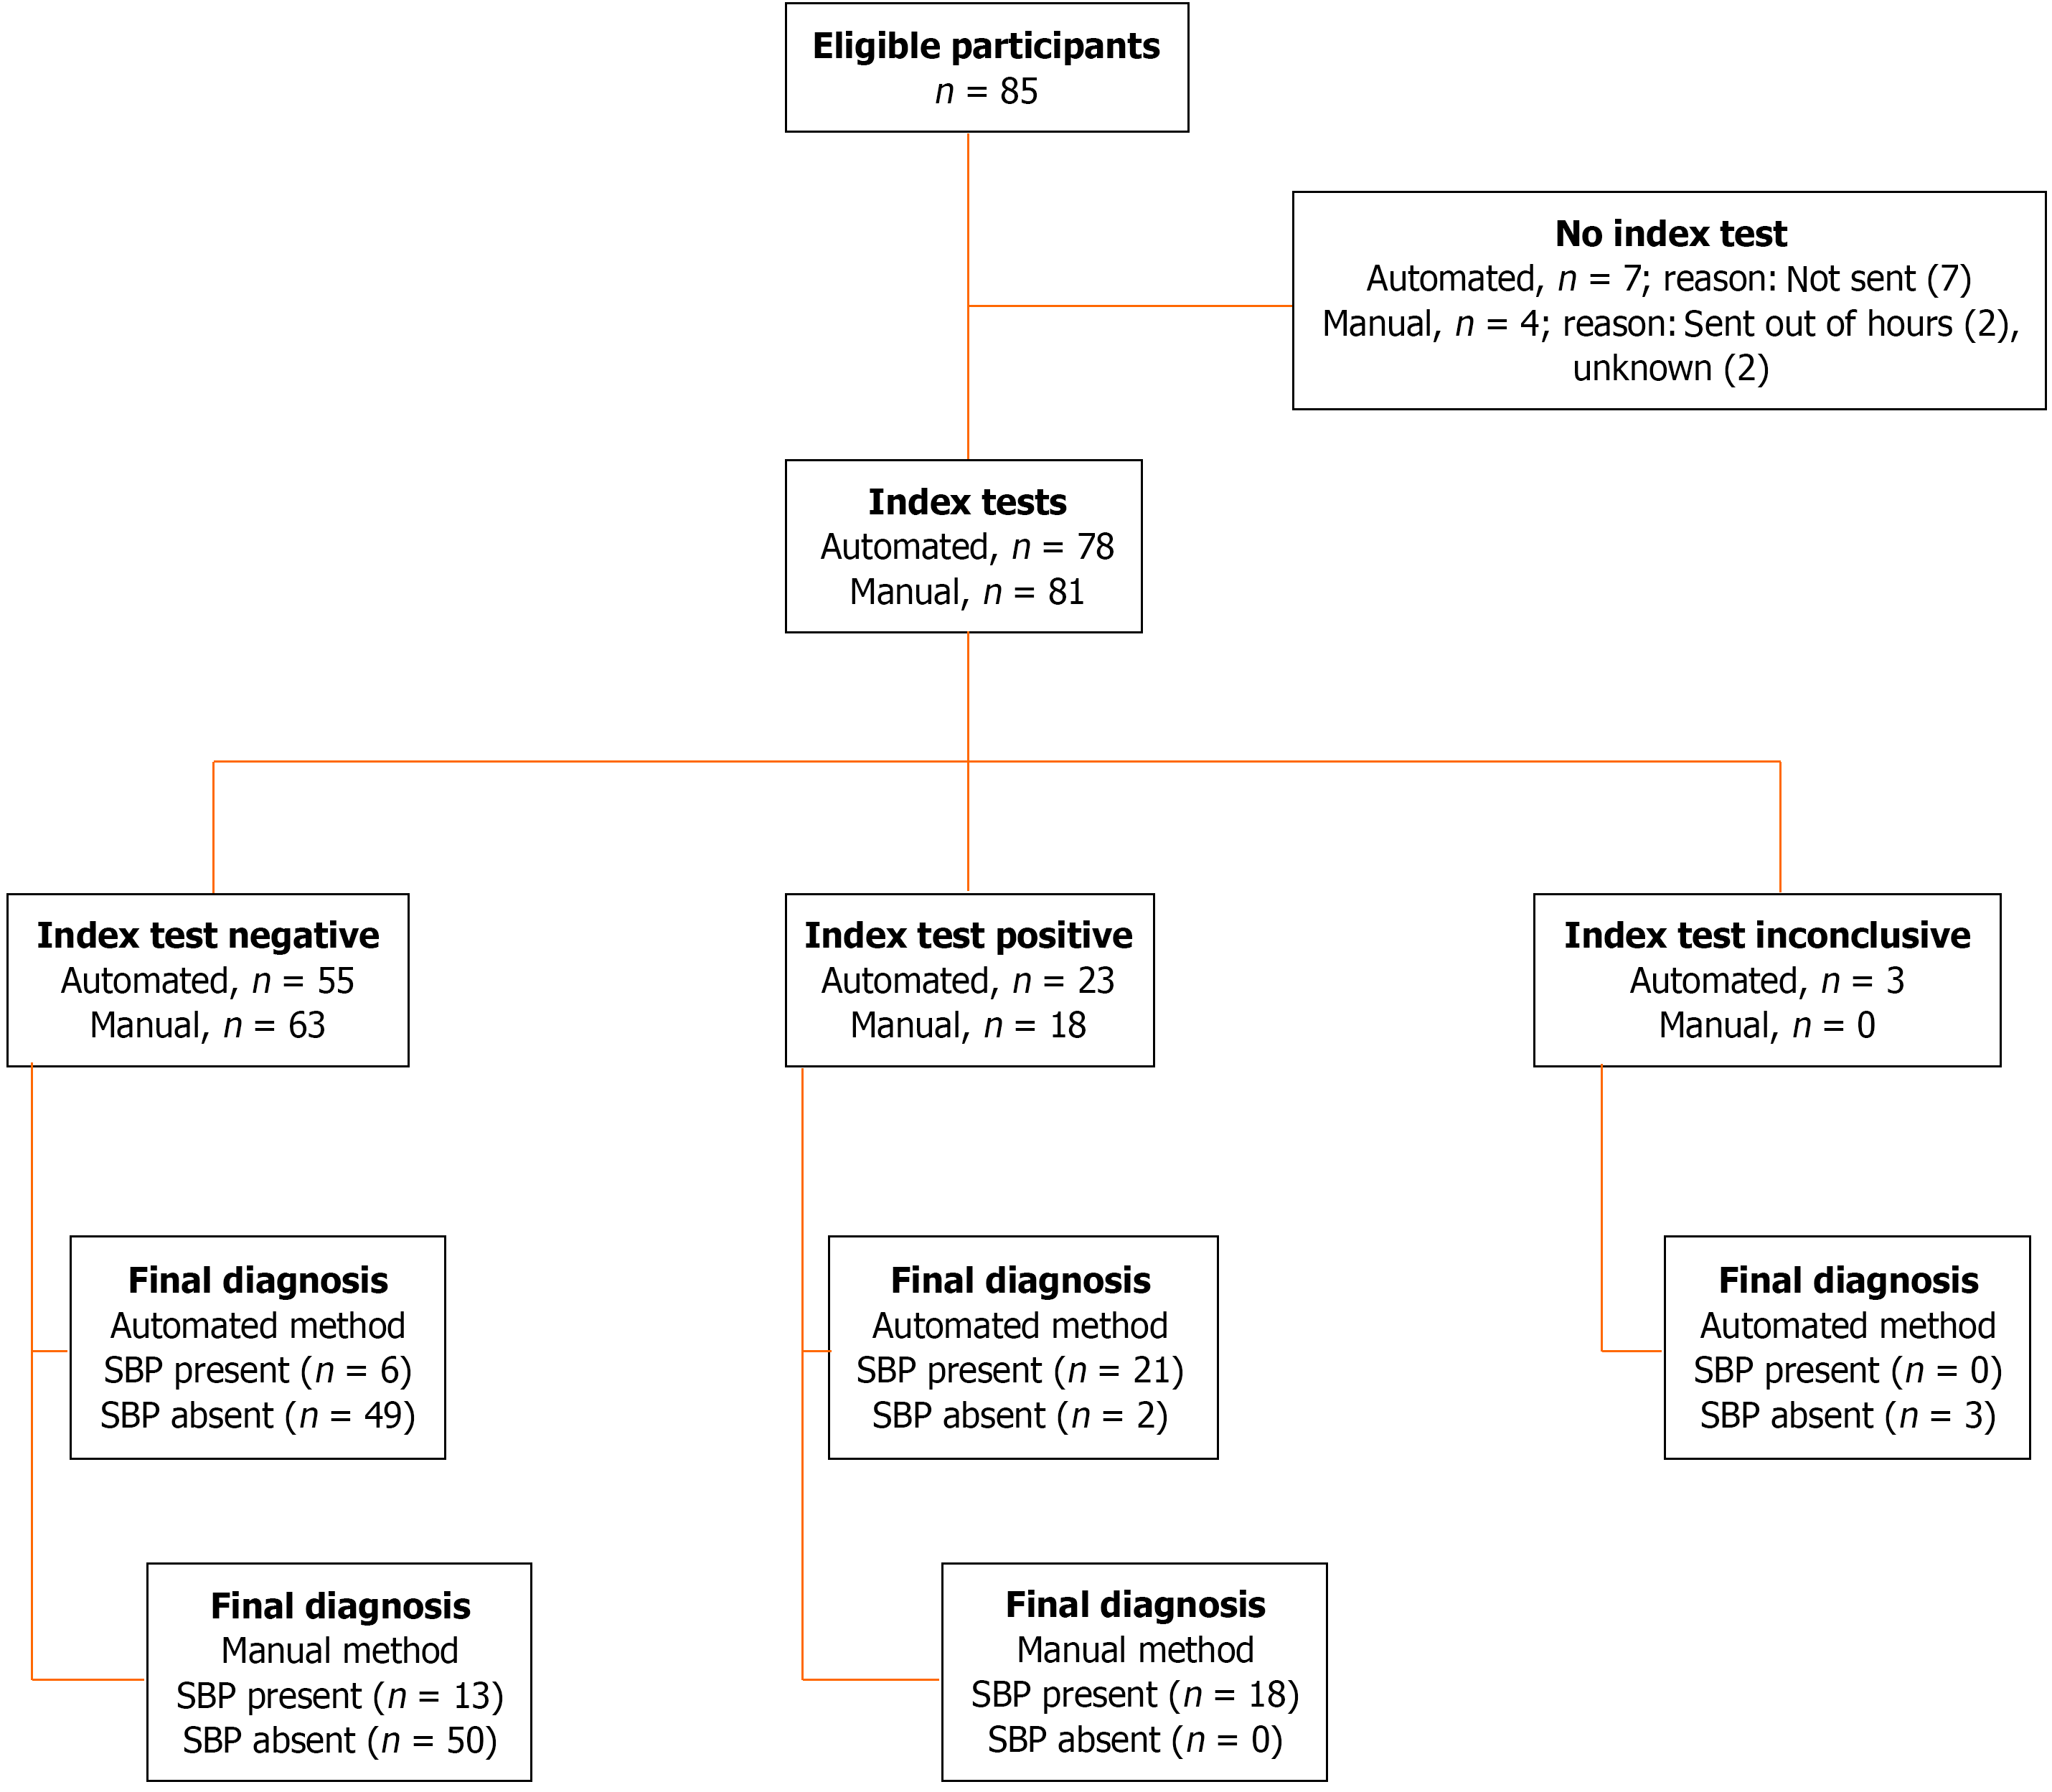
SBP: Spontaneous bacterial peritonitis.
Figure 3 STARD diagram reporting flow of cases through the study in cohort 2.
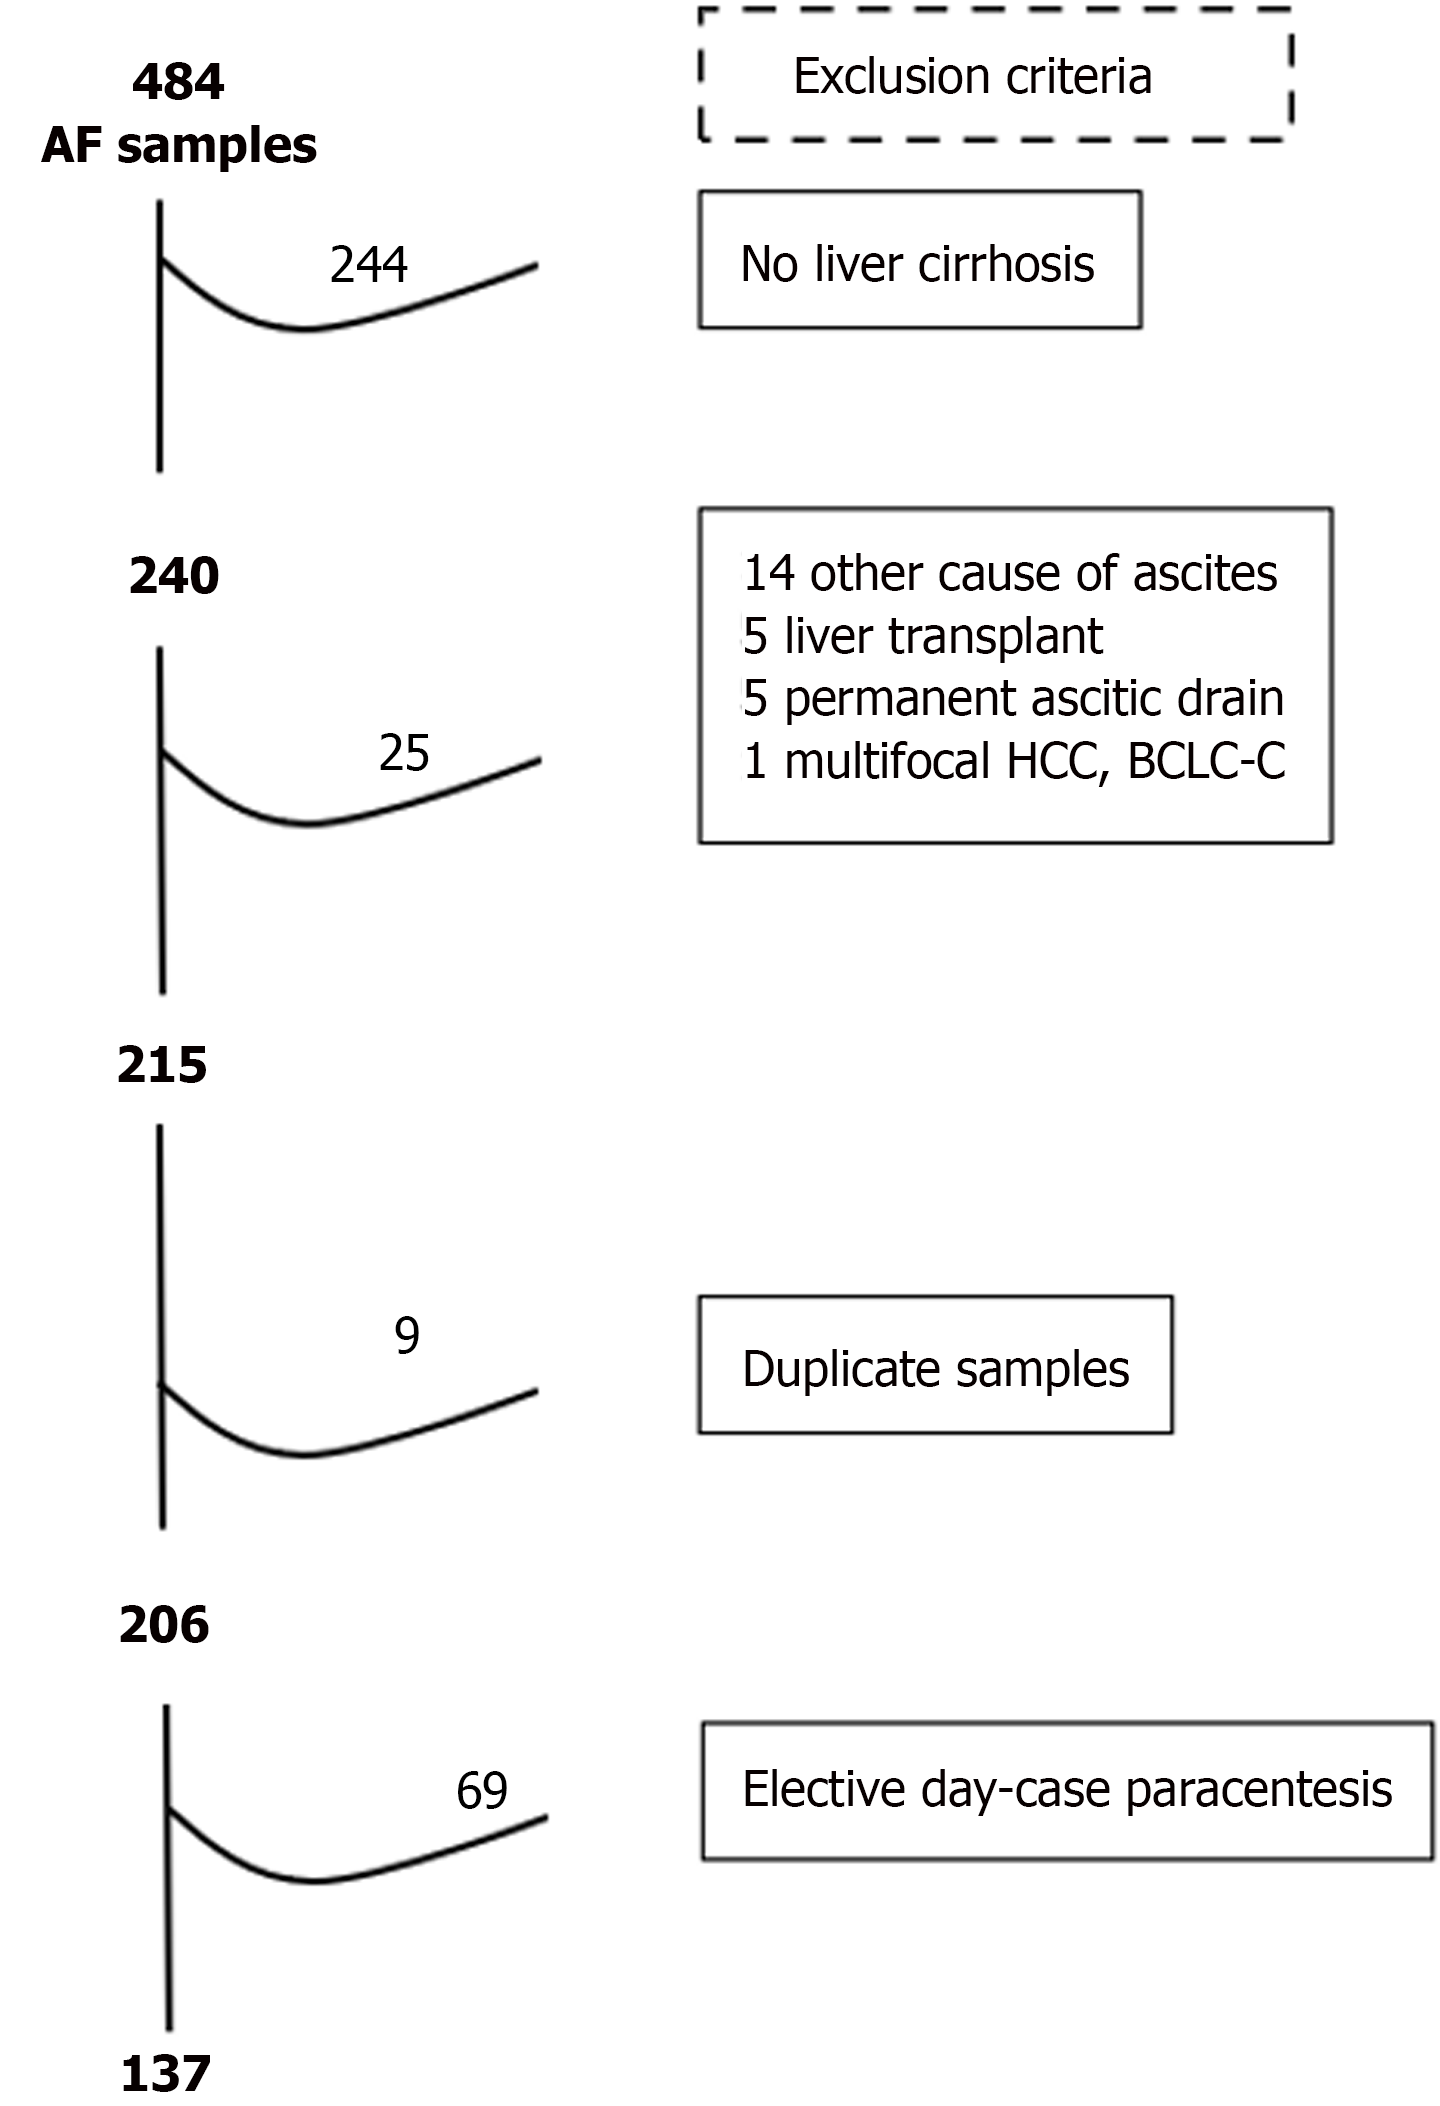
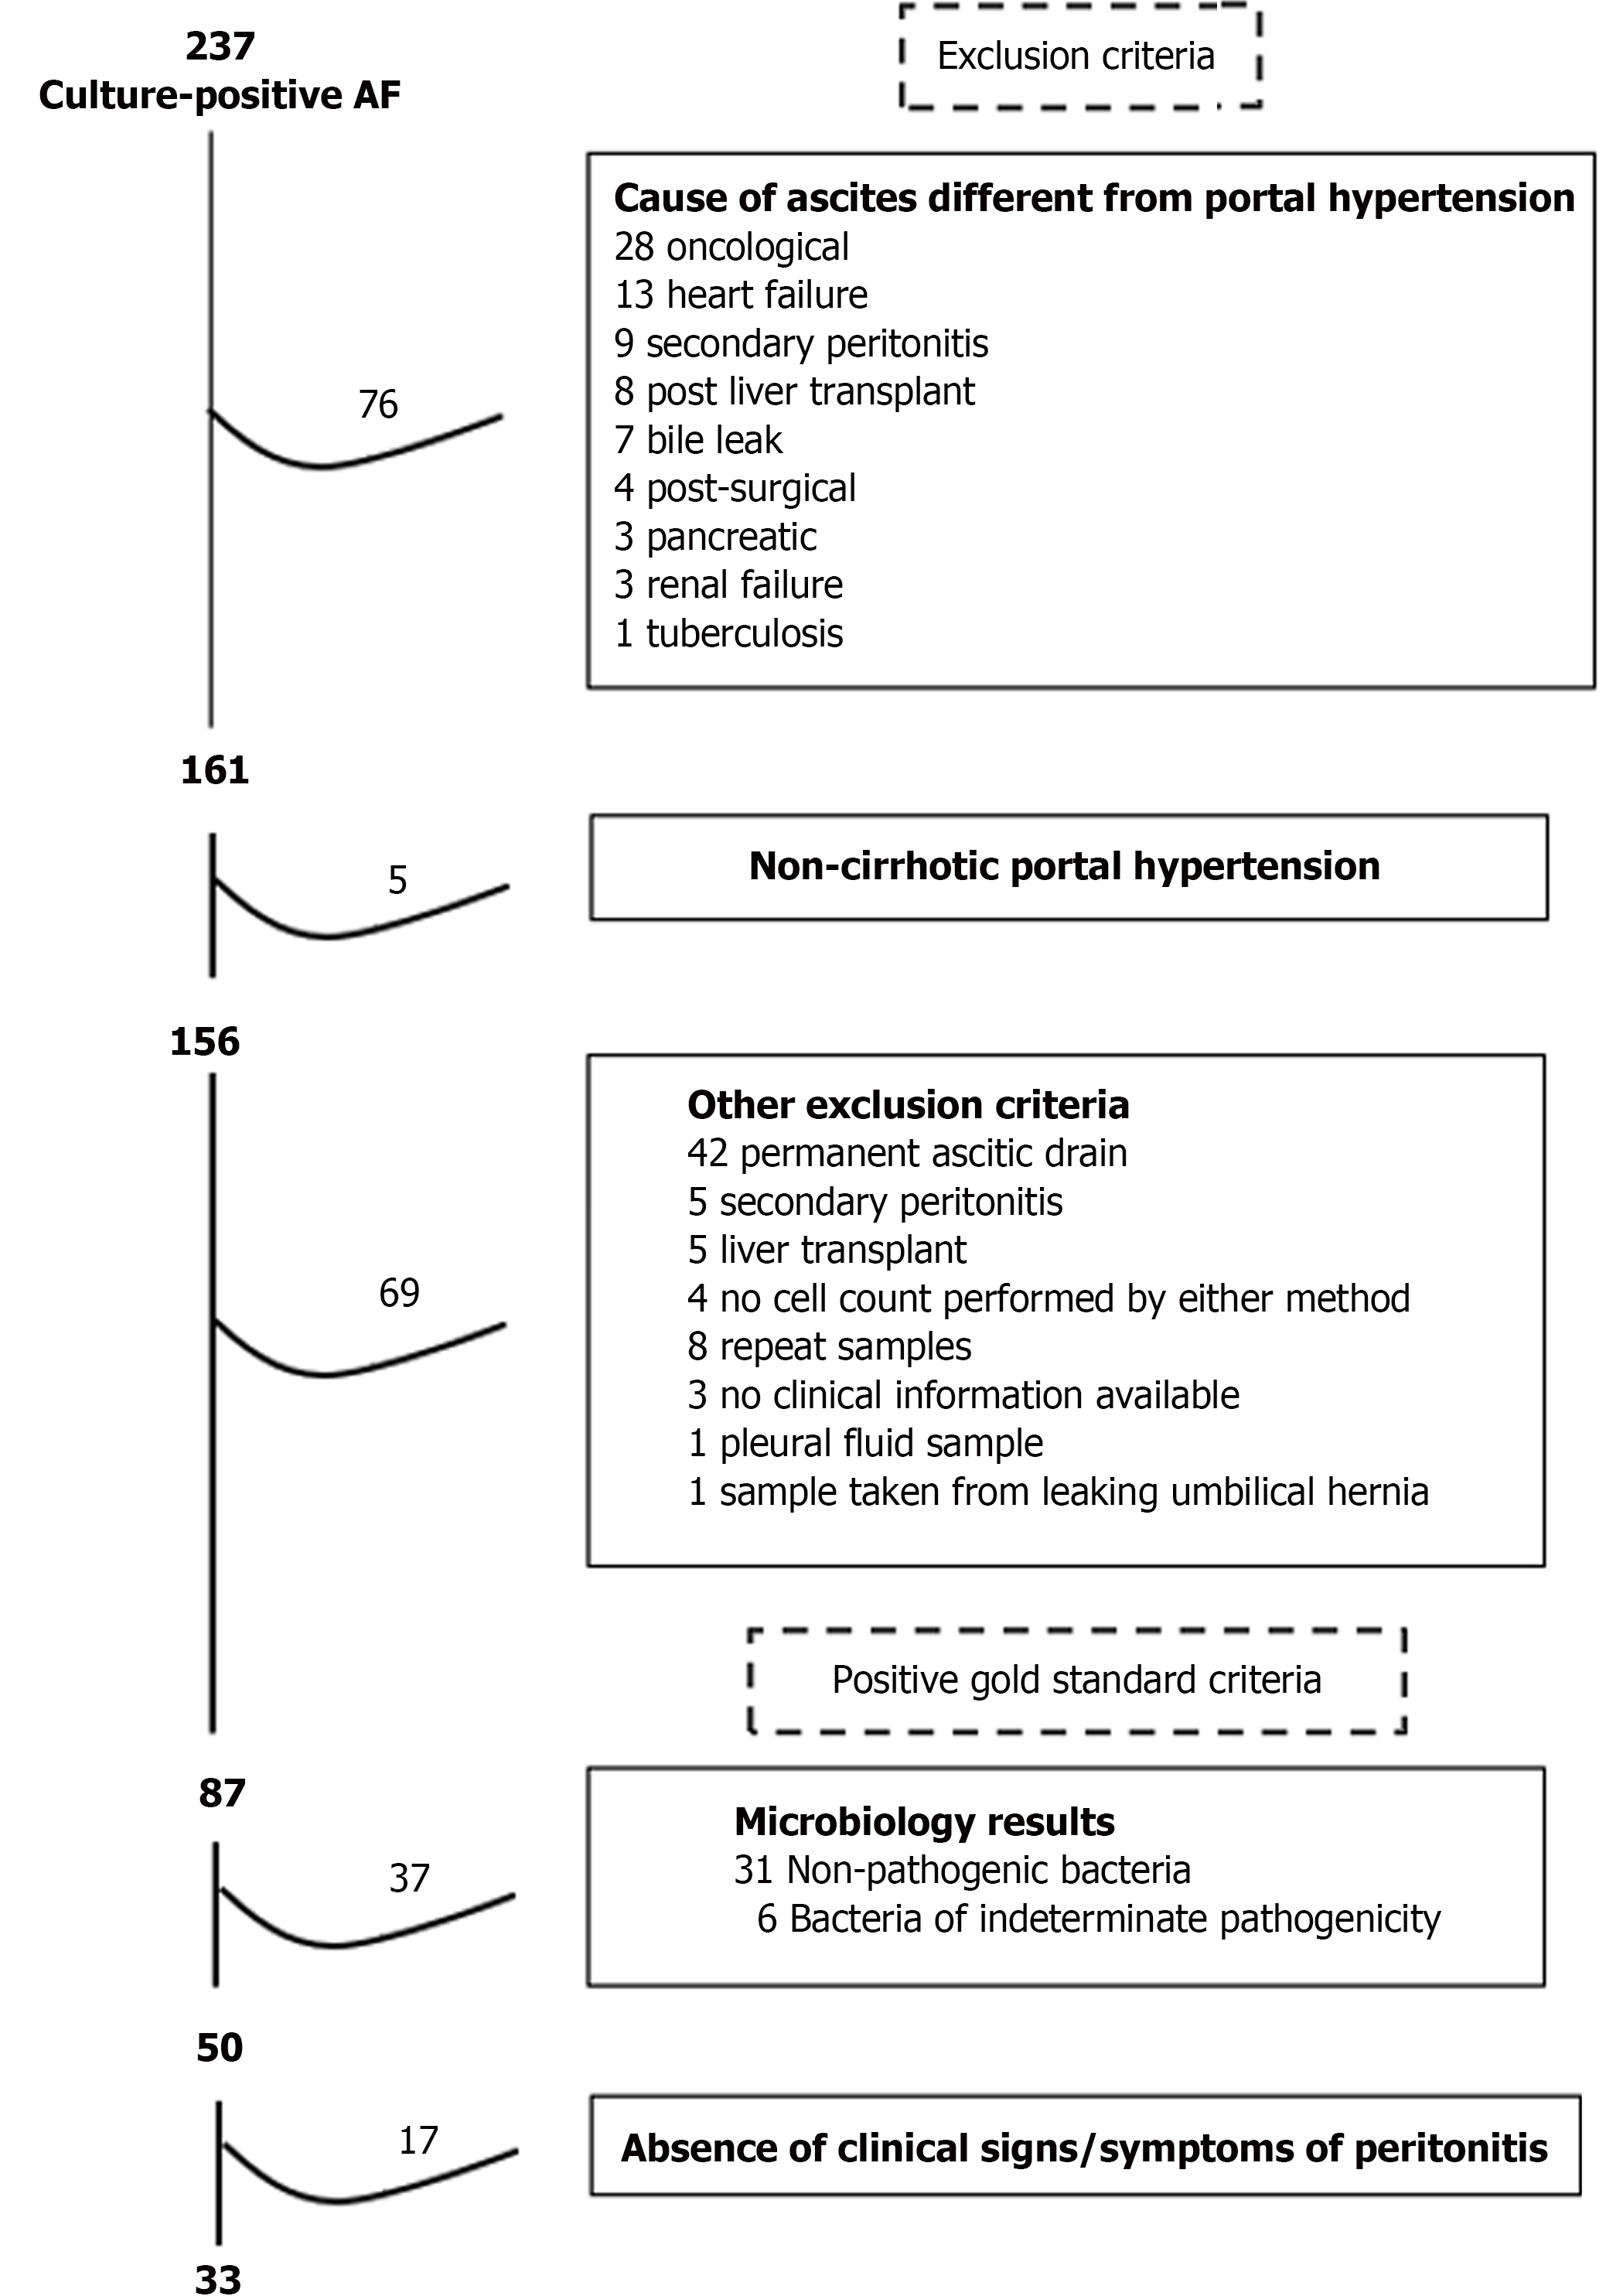
Figure 4 Selection of cohort 1 (cross-sectional) cases.
Figure 5 Selection of gold standard positive-spontaneous bacterial peritonitis cases in cohort 2 (case-control).
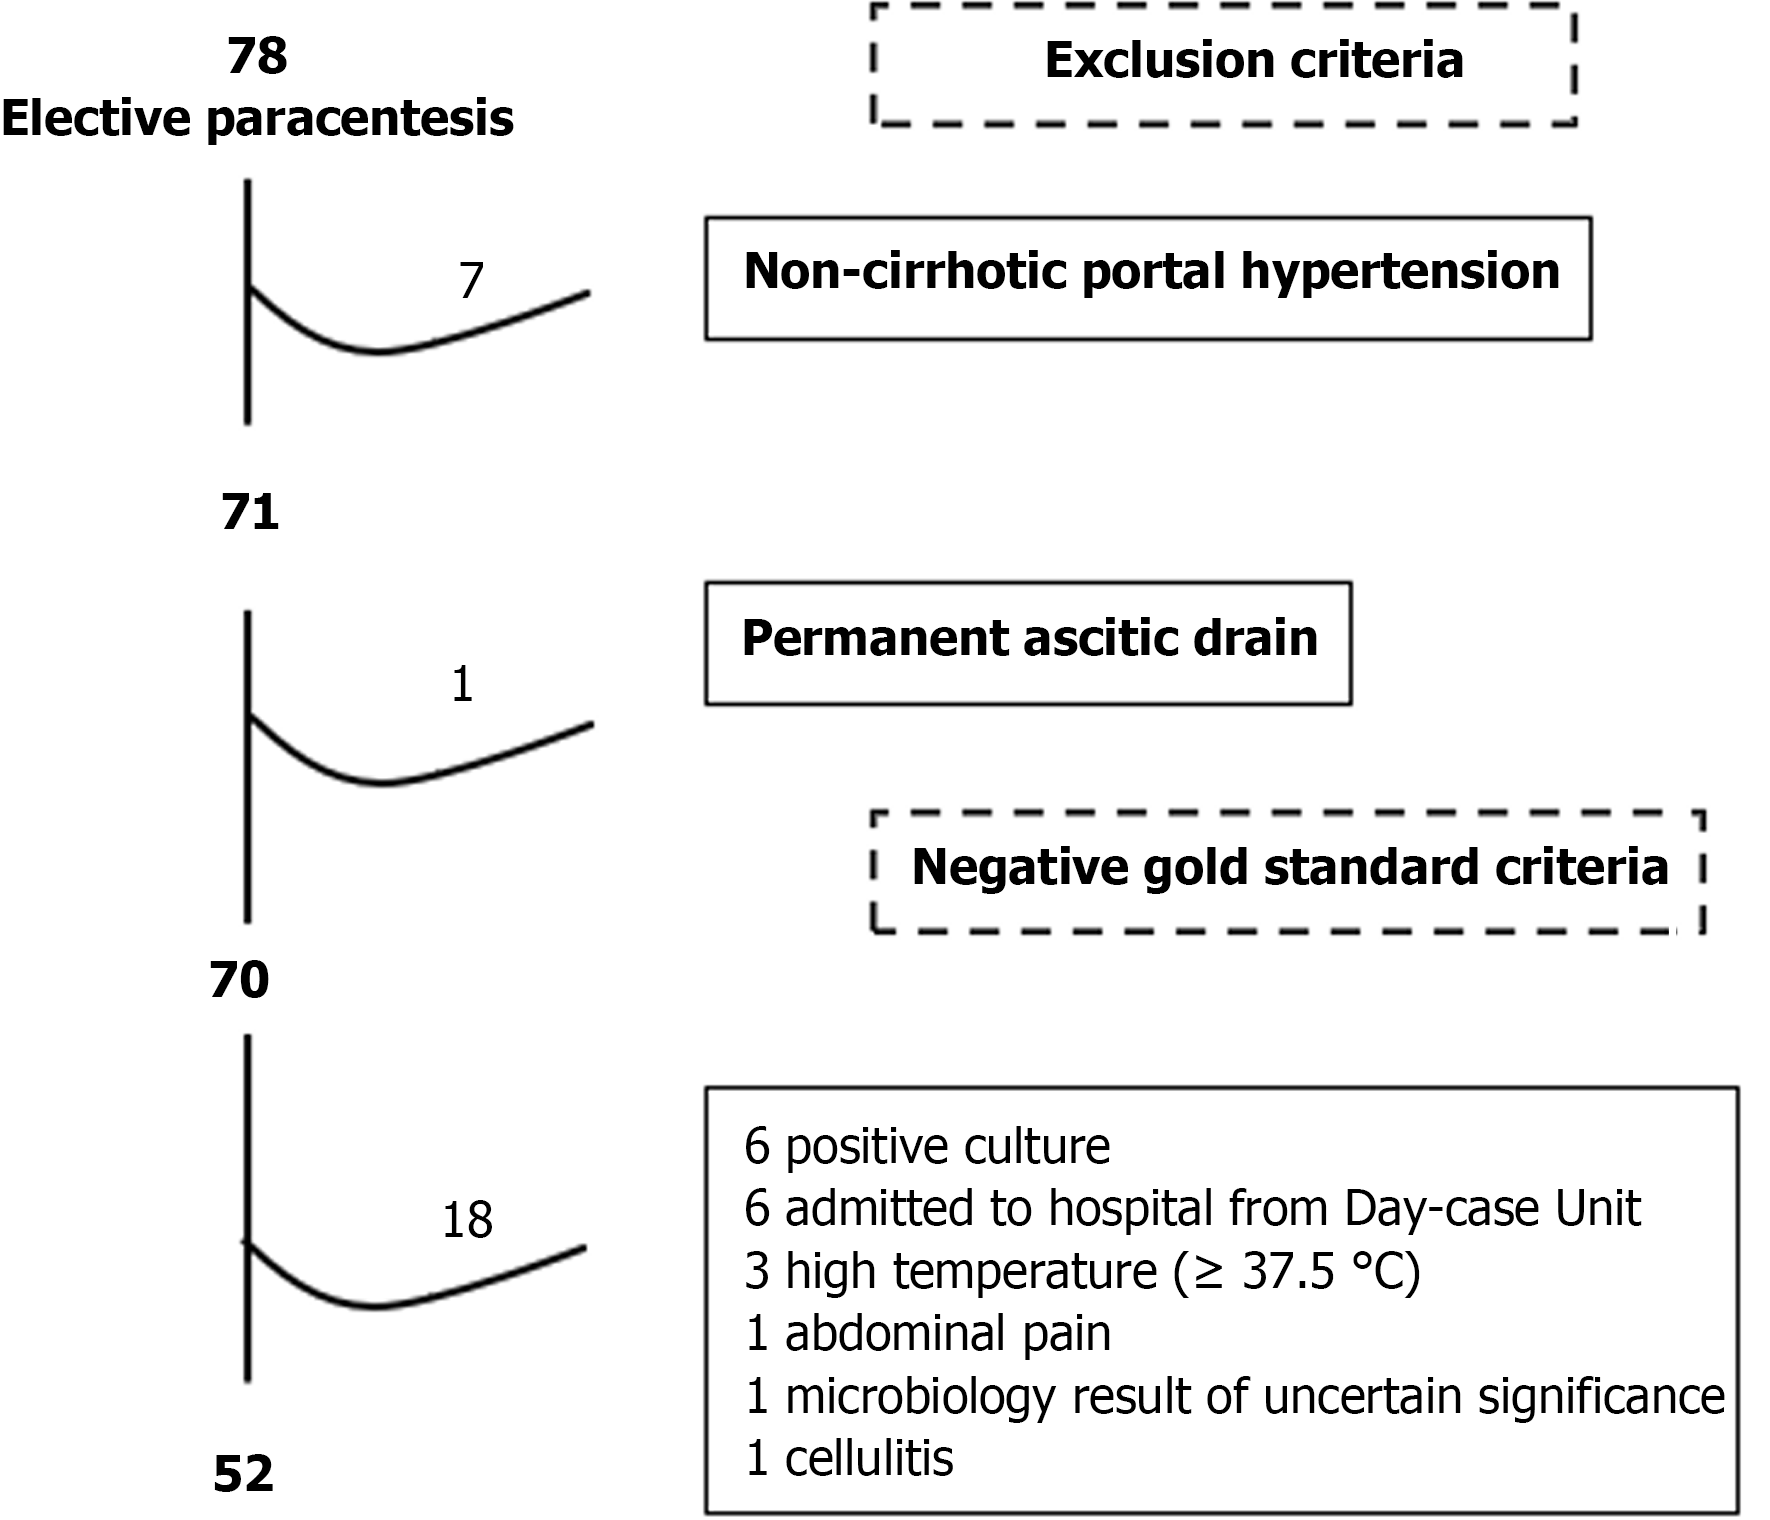
Figure 6 Selection of gold standard negative-spontaneous bacterial peritonitis cases in cohort 2 (case control).
- Citation: Acevedo-Haro JG, Mohamed W, Moodley P, Bendall O, Bennett K, Keelty N, Chan S, Waddy S, Hosking J, Thomas W, Tilley R. Sensitivity of diagnosis of spontaneous bacterial peritonitis is higher with the automated cell count method. World J Hepatol 2024; 16(11): 1265-1281
- URL: https://www.wjgnet.com/1948-5182/full/v16/i11/1265.htm
- DOI: https://dx.doi.org/10.4254/wjh.v16.i11.1265


