Copyright
©The Author(s) 2024.
World J Hepatol. Jan 27, 2024; 16(1): 75-90
Published online Jan 27, 2024. doi: 10.4254/wjh.v16.i1.75
Published online Jan 27, 2024. doi: 10.4254/wjh.v16.i1.75
Figure 1 Experimental design.
The control group (n = 8) received a standard diet, water without diethylnitrosamine (DEN) and gavage with vehicle (Veh) solution; hepatocellular carcinoma-group (n = 7) received a high-fat and choline-deficient (HFCD) diet, water with DEN and gavage with Veh solution; rifaximin (RIF)-group (n = 7) received a HFCD diet, water with DEN and gavage with RIF. After all the animals were euthanized. DEN: Diethylnitrosamine; HCC: Hepatocellular carcinoma; HFCD: High-fat and choline-deficient; RIF: Rifaximin; Veh: Vehicle.
Figure 2 Hepatic gene expression of autophagy markers.
A: Autophagy-related factor LC3A/B; B: P62/sequestosome-1; C: Beclin-1; D: Enhancer of zeste homolog-2; E: Coactivator associated arginine methyltransferase-1. Data expressed as median (25th-75th percentile), Kruskal-Wallis test. Different letters indicate a significant difference between groups (P < 0.05). aP < 0.05, bP < 0.05. Different letters indicate a significant difference between groups. Becn1: Beclin-1; Carm1: Coactivator associated arginine methyltransferase-1; Ezh2: Enhancer of zeste homolog-2; HCC: Hepatocellular carcinoma; Map1 Lc3b: Autophagy-related factor LC3A/B; p62/Sqstm1: Sequestosome-1; RIF: Rifaximin.
Figure 3 Protein concentration of autophagy markers.
A: Protein expression bands obtained through the Western blot technique; B: p62/SQSTM1 expression (densitometry analysis); C: MAP1LC3B expression (densitometry analysis). Data expressed as median (25th-75th percentile), Kruskal-Wallis test. Different letters indicate a significant difference between groups (P < 0.05). aP < 0.05, bP < 0.05. Different letters indicate a significant difference between groups. HCC: Hepatocellular carcinoma; MAP1LC3B: Autophagy-related factor LC3A/B, p62/SQSTM1: Sequestosome-1; RIF: Rifaximin.
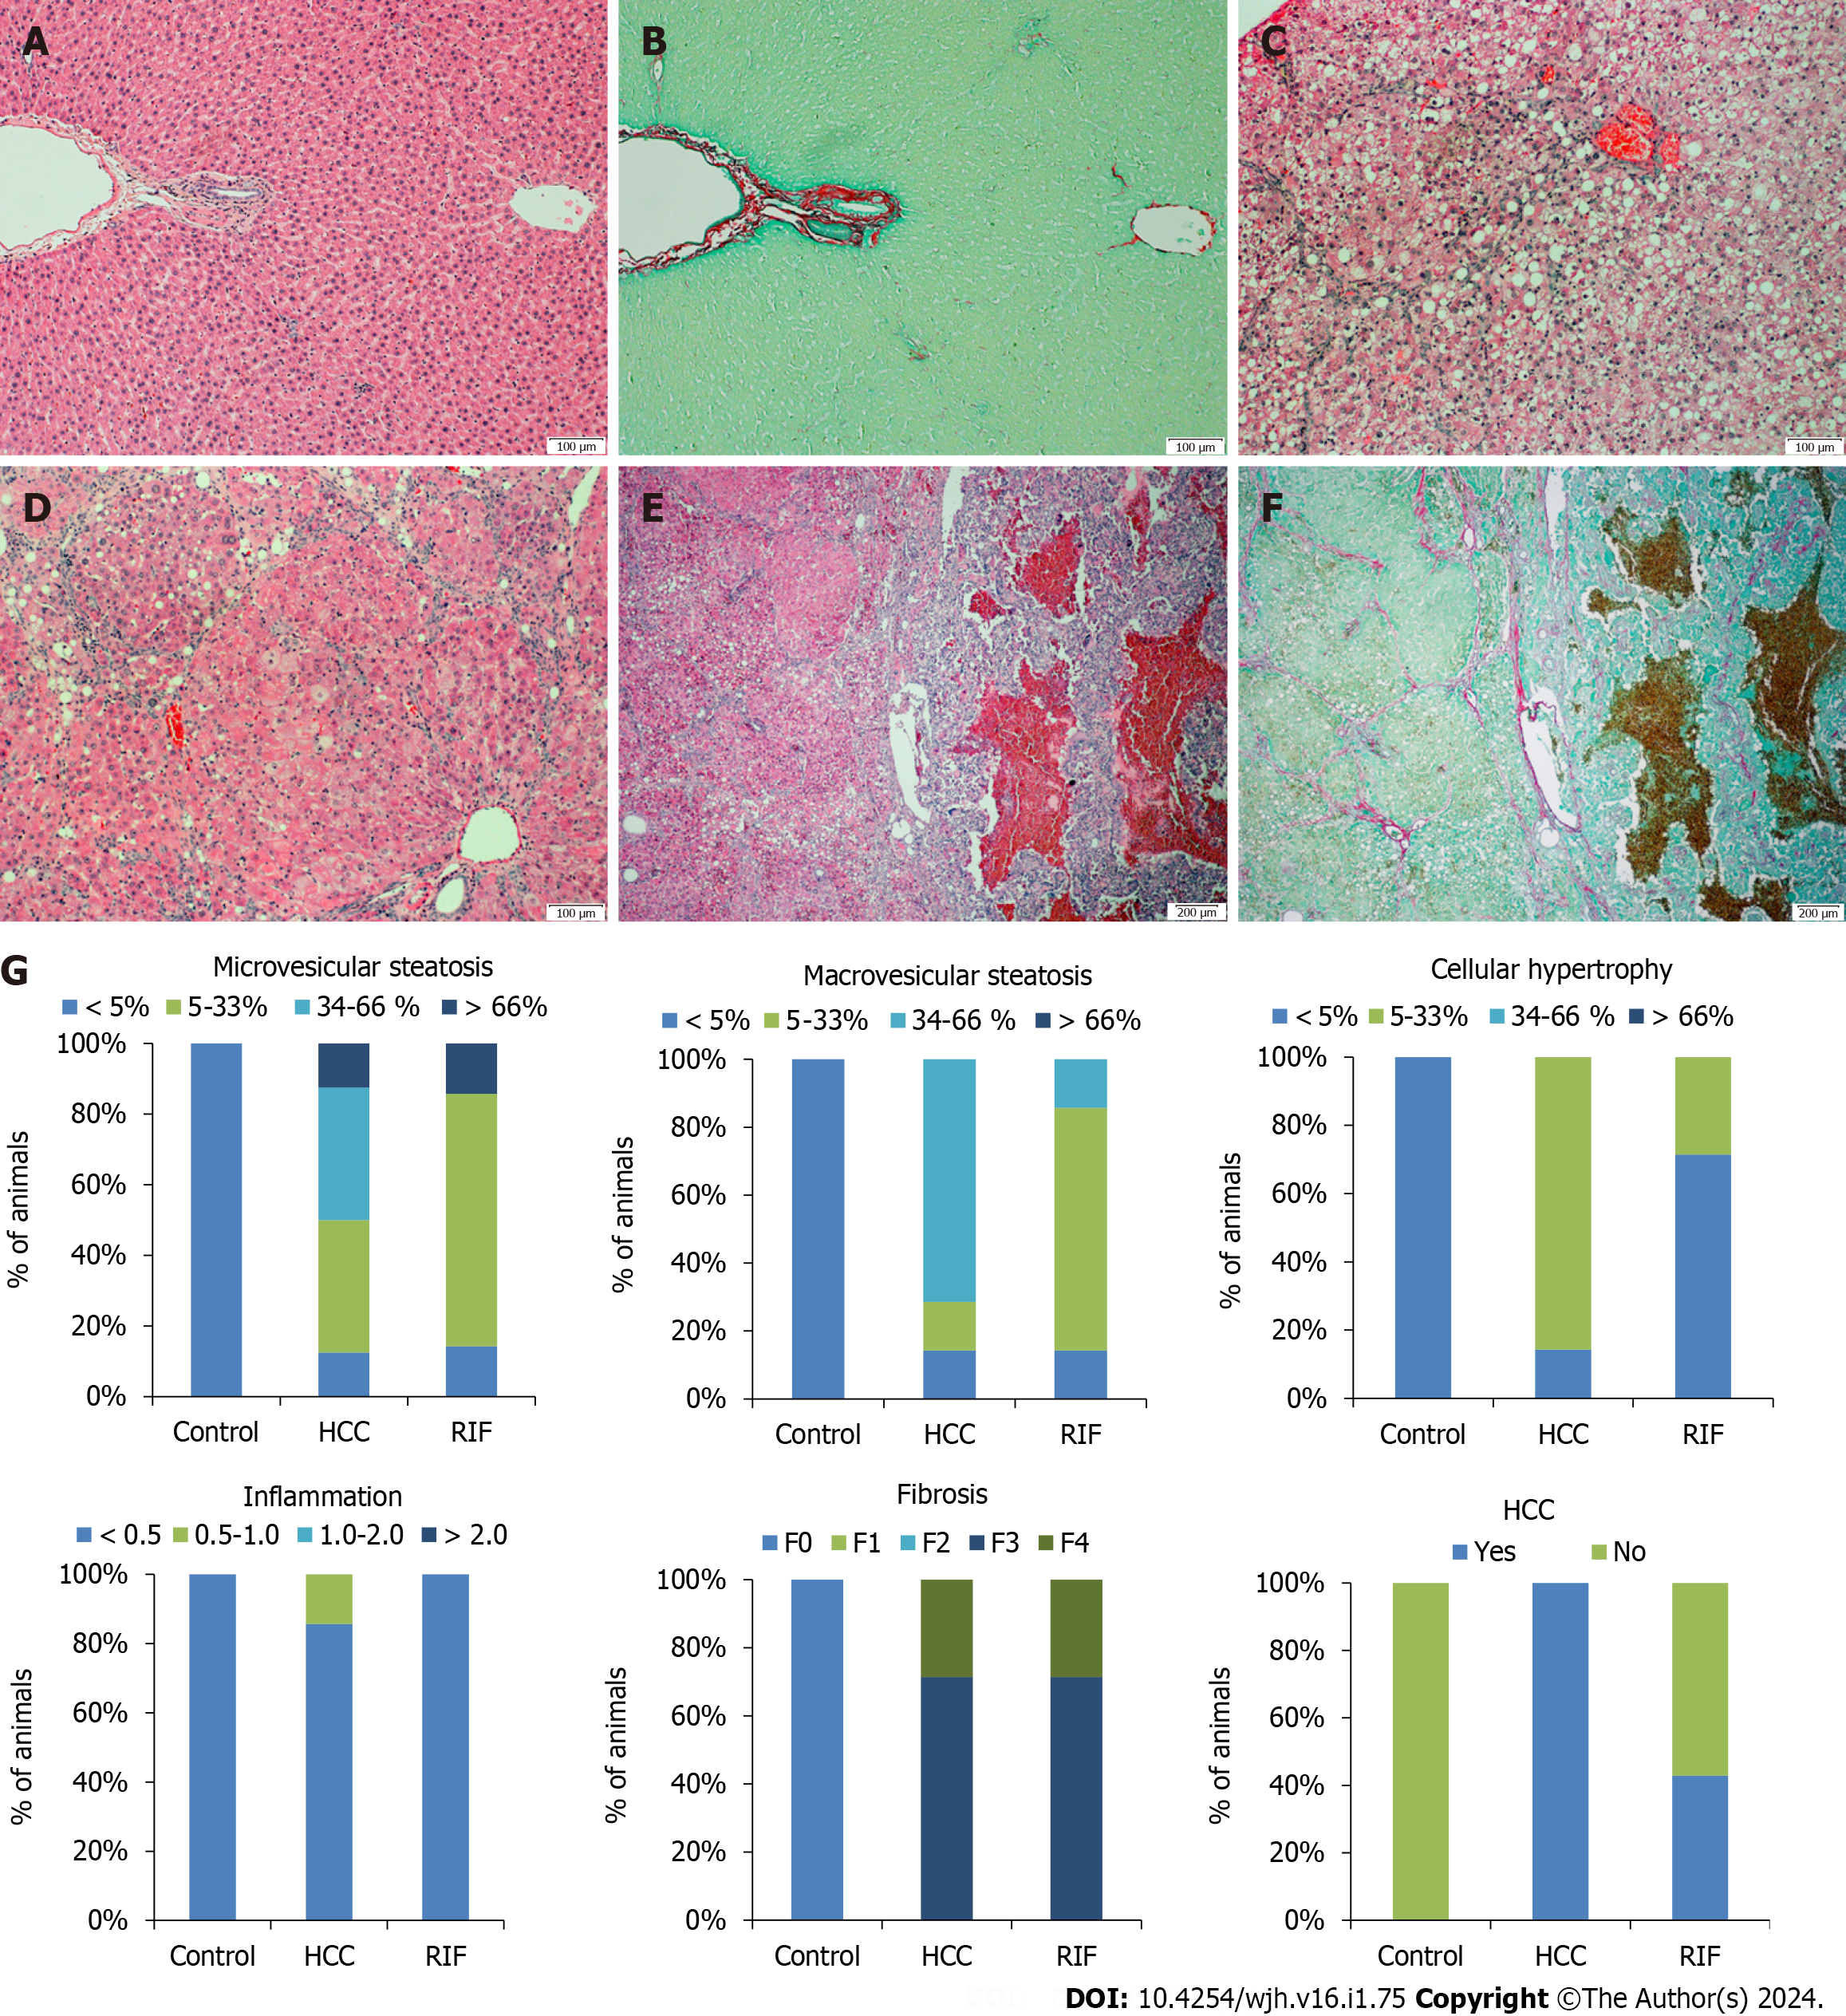
Figure 4 Histological evaluation of hepatic tissue in different experimental groups and percentage description for the presence of microvesicular steatosis, macrovesicular steatosis, hypertrophy, inflammation, fibrosis and hepatocellular carcinoma.
A and B: The images correspond to hematoxylin & eosin (H&E) and picrosirius red staining’s in the control group, showing a normal hepatic parenchyma with no significant changes; C and D: In the hepatocellular carcinoma (HCC)-group, animals exhibited macrovesicular steatosis and hypertrophy; E and F: Tumoral lesions with multiple fibrosis septa were observed in the HCC-group and rifaximin-group, as evidenced by H&E and picrosirius stained slides, respectively; G: Percentage description for the presence of microvesicular steatosis, macrovesicular steatosis, hypertrophy, inflammation, fibrosis, and HCC. Images A-D are magnified at 100 ×, and images E-F are magnified at 40 ×. HCC: Hepatocellular carcinoma; H&E: Hematoxylin & eosin; RIF: Rifaximin.
- Citation: Michalczuk MT, Longo L, Keingeski MB, Basso BS, Guerreiro GTS, Ferrari JT, Vargas JE, Oliveira CP, Uribe-Cruz C, Cerski CTS, Filippi-Chiela E, Álvares-da-Silva MR. Rifaximin on epigenetics and autophagy in animal model of hepatocellular carcinoma secondary to metabolic-dysfunction associated steatotic liver disease. World J Hepatol 2024; 16(1): 75-90
- URL: https://www.wjgnet.com/1948-5182/full/v16/i1/75.htm
- DOI: https://dx.doi.org/10.4254/wjh.v16.i1.75


