Copyright
©The Author(s) 2024.
World J Hepatol. Jan 27, 2024; 16(1): 65-74
Published online Jan 27, 2024. doi: 10.4254/wjh.v16.i1.65
Published online Jan 27, 2024. doi: 10.4254/wjh.v16.i1.65
Figure 1 Altered expression of prohibitin 1 mRNA and protein during liver regeneration.
A: Altered expression of prohibitin 1 (Phb1) mRNA during liver regeneration (LR). Rat livers were homogenized and harvested with TRIzol reagent. Real-time polymerase chain reaction (PCR) amplifications were performed, standardized by the amounts of β-actin. The real-time PCR signals were analyzed with LightCycler 3.5 software; B: Altered expression of Phb1 protein during LR. Equal amounts of protein from each sample were separated on 12% SDS-PAGE and immunoblotted with antibodies against Phb1 and control protein, β-actin. On the left are the western blotting results, and on the right is a gray analysis of the results showing the fold changes of Phb1 expression in PH groups in comparison with SH groups, standardized by the amounts of β-actin. All grouping of gels/blots were cropped from different parts of the same gel. PH: 70% PHx test groups; PHx: Partial hepatectomy; SH: Sham-operation control groups;. Results are from three independent experiments and data are represented as means ± SD. aP < 0.05, versus control group, significant difference.
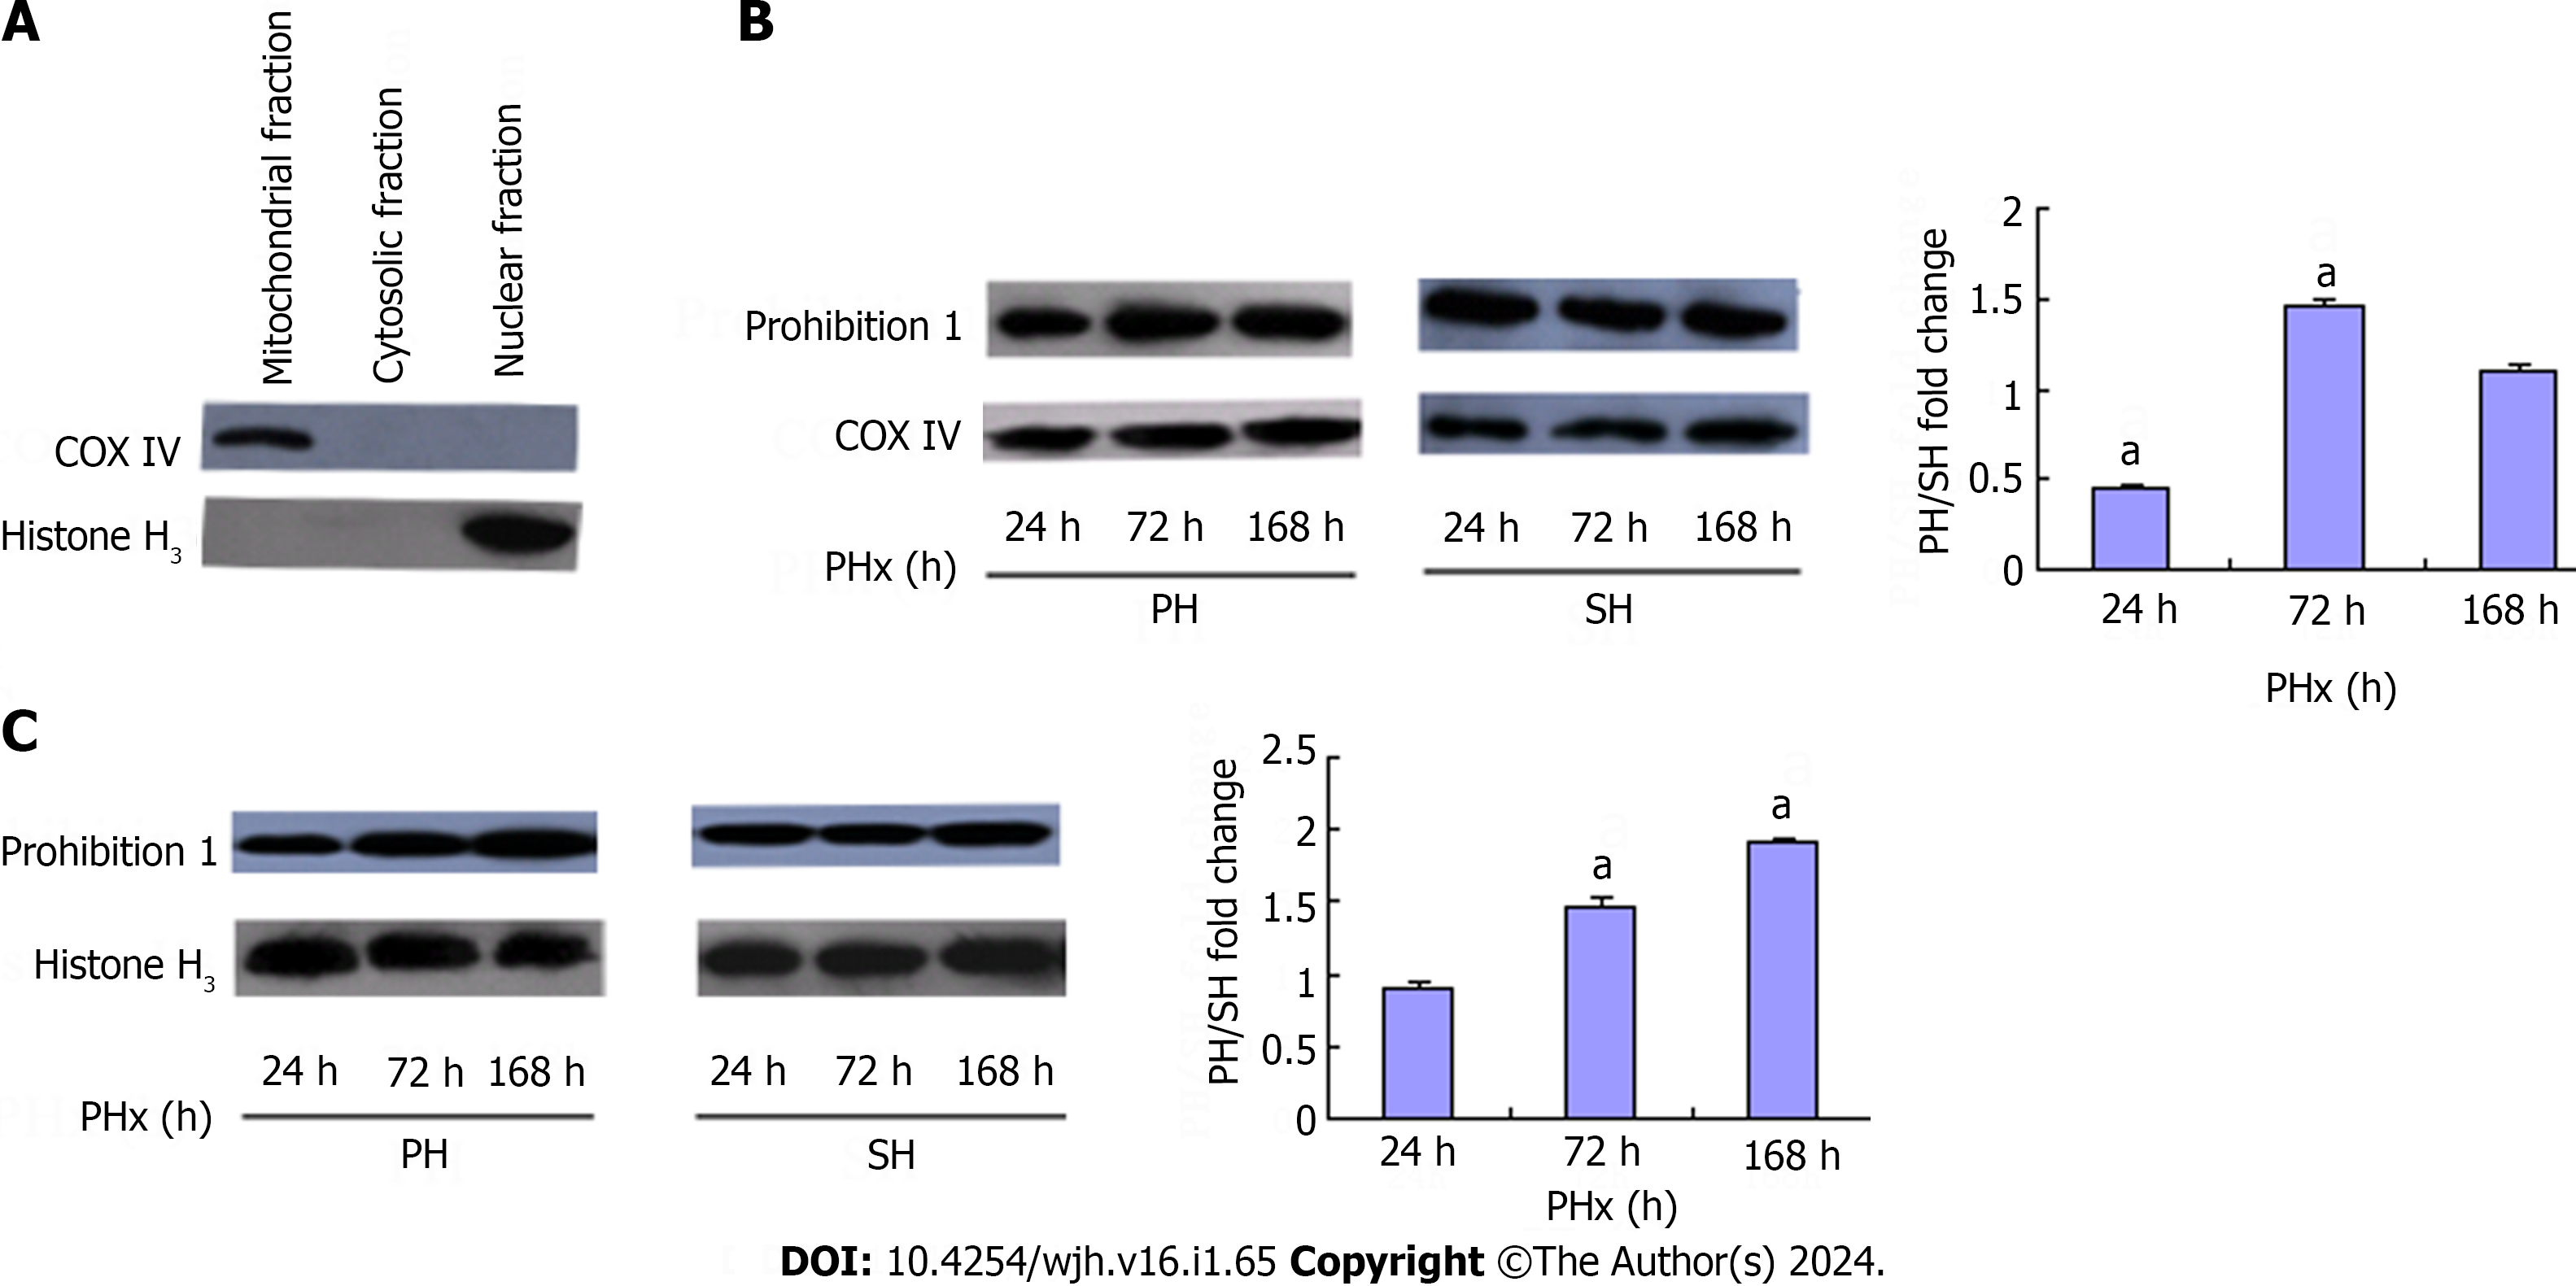
Figure 2 Subcellular distribution and protein abundance alterations of prohibitin 1 during liver regeneration.
Equal amounts of protein extracts obtained from each subcellular fraction were separated on 12% SDS-PAGE and immunoblotted with antibodies against prohibitin 1 (Phb1), cyclooxygenase IV (COX IV) and histone H3. A: Control western blotting for subcellular fractionation (COX IV for mitochondria and Histone H3 for nuclei). The grouping of gels/blots were cropped from different parts of different gels; B: Changes in Phb1 protein abundance in mitochondria. On the left are the western blotting results, and on the right is a gray analysis of the results showing the fold changes of Phb1 expression in mitochondria in PH groups in comparison with SH groups, standardized by the amounts of COX IV. The grouping of gels/blots in PH groups were cropped from different parts of the same gel. The grouping of gels/blots in SH groups were cropped from different parts of the same gel; C: Changes of Phb1 protein abundance in nucleus. On the left are the Western blotting results, and on the right is a gray analysis of the results showing the fold changes of Phb1 expression in nucleus in PH groups in comparison with SH groups, standardized by the amounts of Histone H3. The grouping of gels/blots for Phb1 were cropped from different parts of the same gel. The grouping of gels/blots for histone H3 were cropped from different parts of the same gel. PH: 70% PHx test groups; PHx: Partial hepatectomy; SH: Sham-operation control groups. Results are from three independent experiments and data are represented as means ± SD. aP < 0.05, versus control group, significant difference.
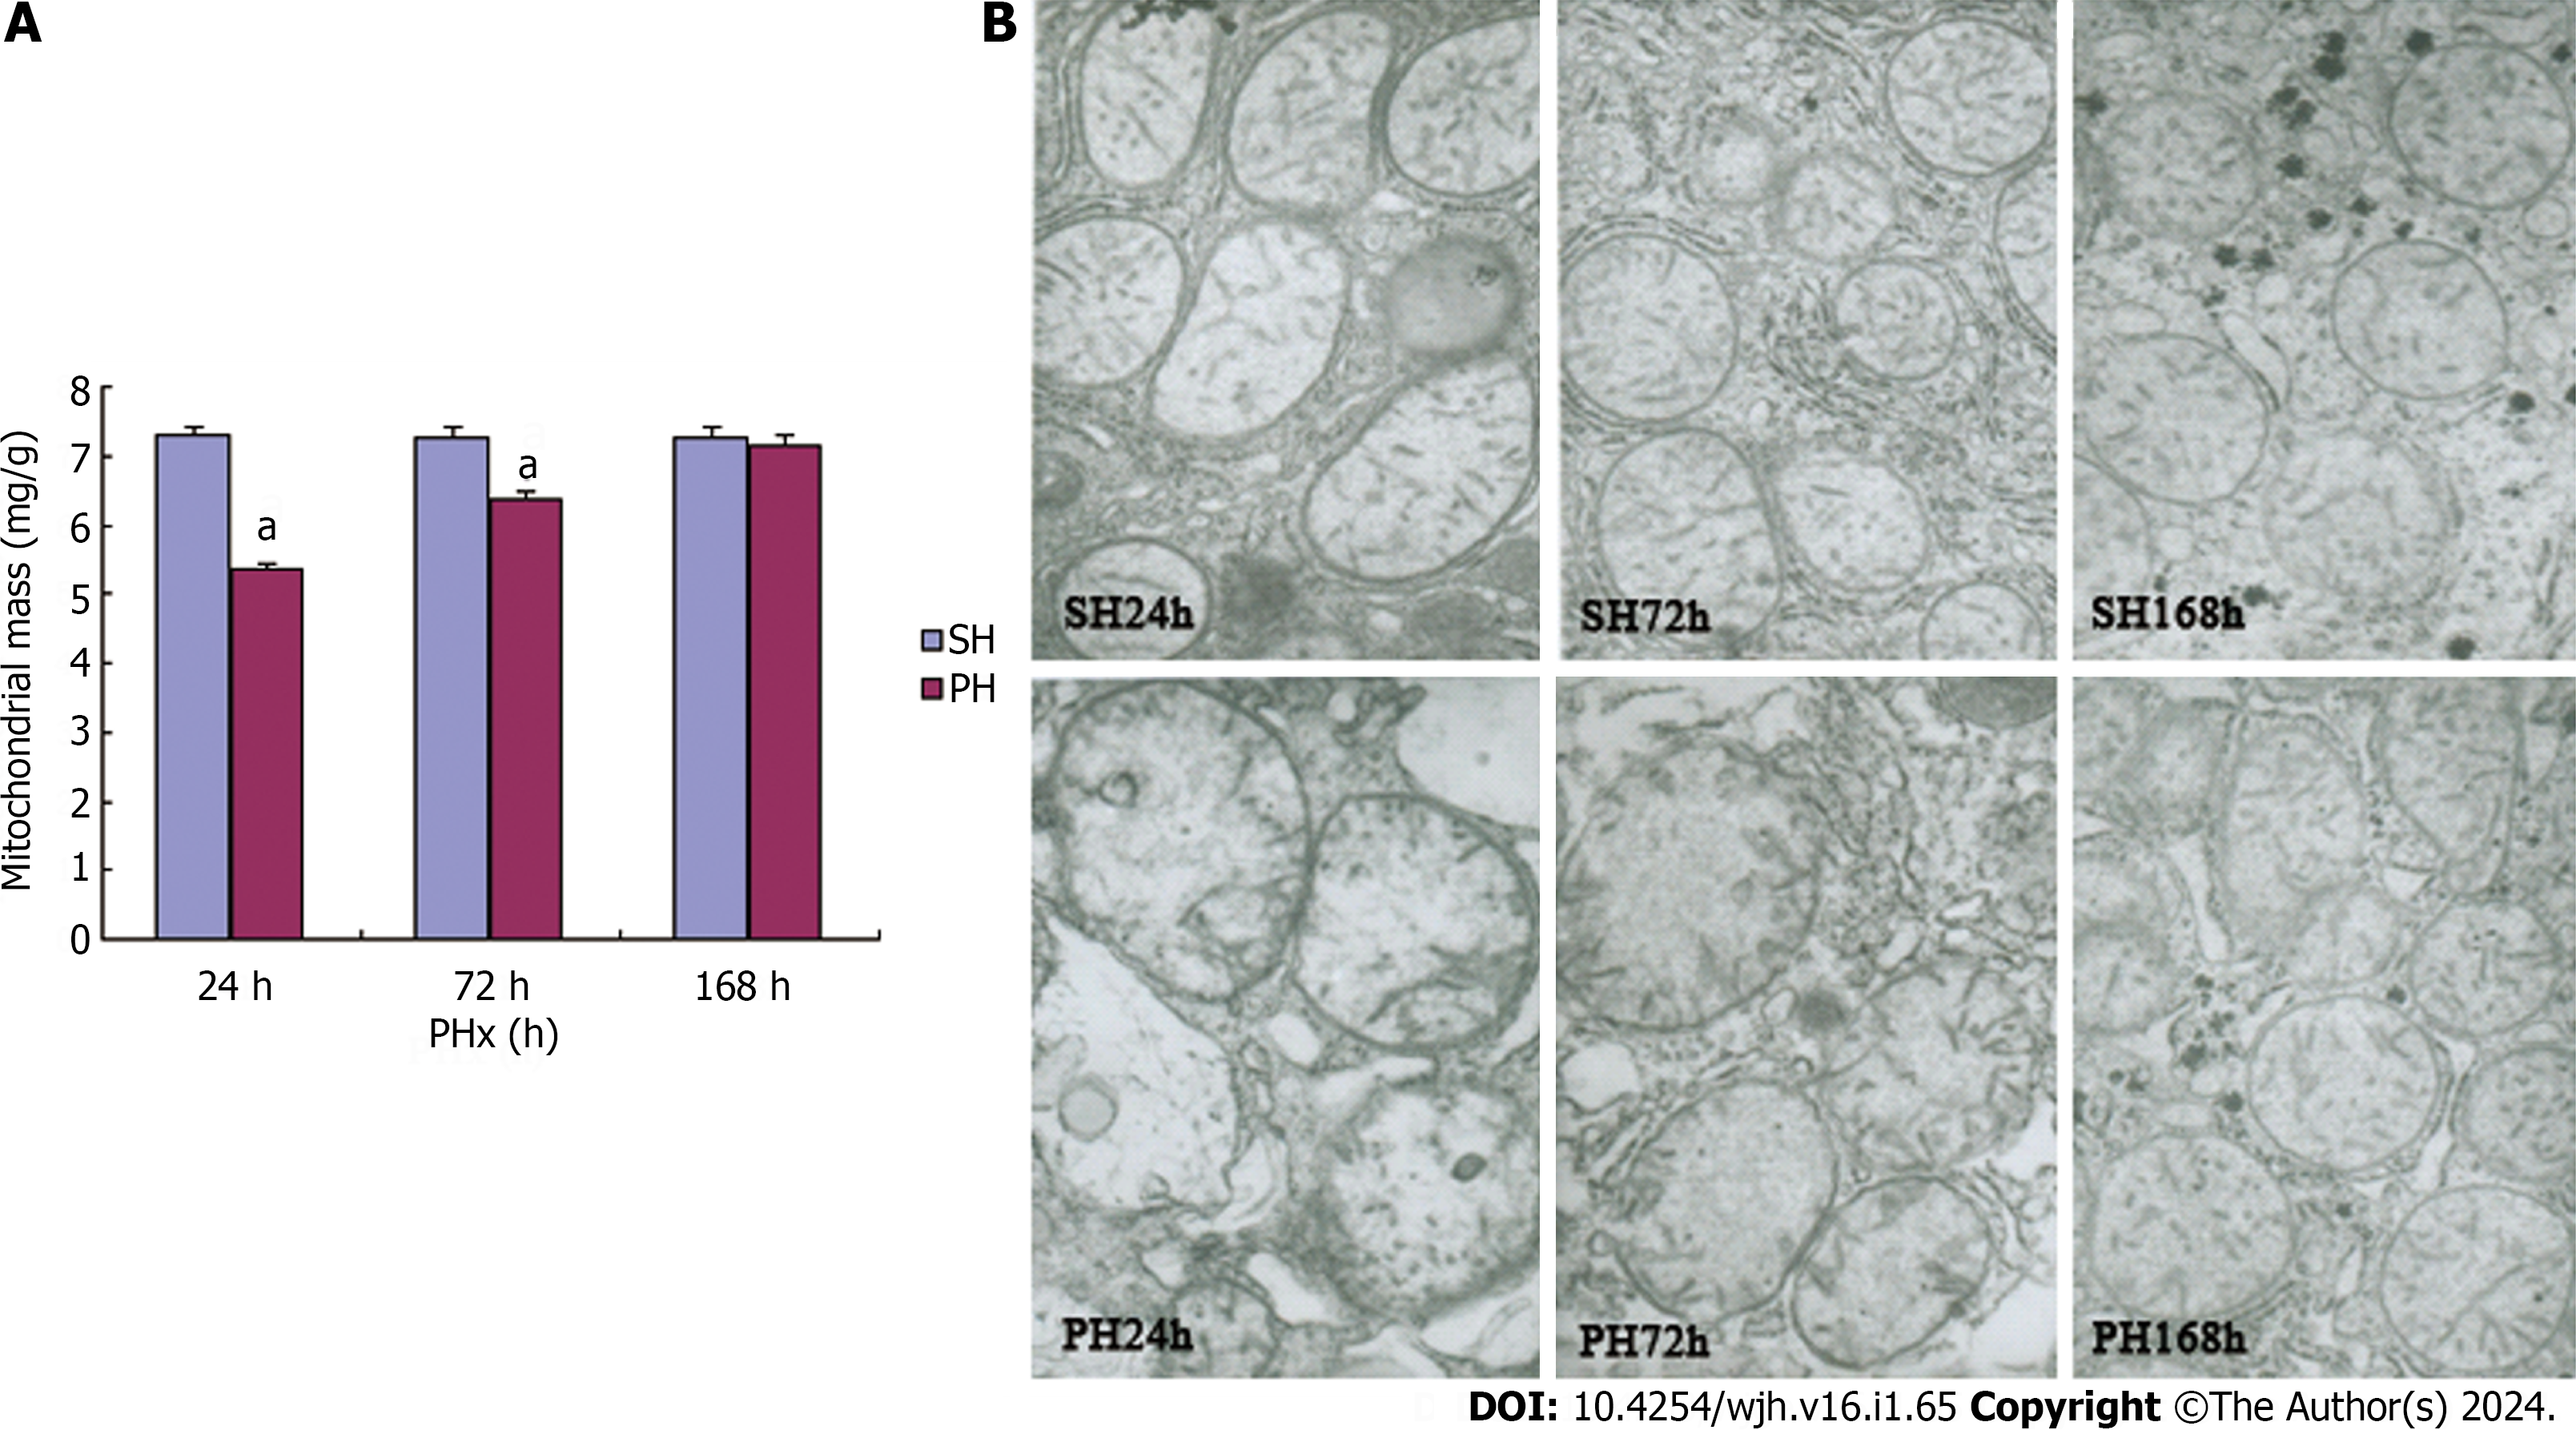
Figure 3 Mitochondrial mass and ultrastructural alterations during liver regeneration.
A: Changes of mitochondrial mass during liver regeneration (LR). Mitochondrial mass was measured by examining the protein contents of mitochondrial fractions extracted from the same weight (1 g) liver tissues of each experimental group; B: Electron micrographs of mitochondria in liver tissues during LR. Three maps in the upper panel are detail of hepatocytes in control groups, showing normal mitochondria. The other three maps in the bottom panel are detail of hepatocytes after 70% PHx, showing altered mitochondria during LR. PH: 70% PHx test groups; PHx: Partial hepatectomy; SH: Sham-operation control groups; PH: 70% PHx test groups. Ten randomly selected electron micrographs of the same magnification (15 000×) were examined from one hepatic lobule of five rats for each experimental group.
Figure 4 RNA-interference-mediated knockdown of Phb1 induced an increase in the number of apoptotic cells and increased S-phase entry.
A: An increase in the number of apoptotic cells in RNA-interference-mediated knockdown of Phb1 (PHBi) cells. At 72 h post-transfection, stained with Annexin V and propidium iodide (PI), PHBi cells showed a significant increase in the percentage of Annexin V/PI positive cells compared with controls (cells transfected with nonsensing duplex); B: Increased S-phase entry in PHBi cells. At 48 h post-transfection, FACS analysis was performed with PHBi and mock (cells transfected with nonsensing duplex, used as control). Results are from three independent experiments and data are represented as means ± SD. aP < 0.05, veruss mock, significant difference. UL: Upper left; UR: Upper right; LL: Lower left; LR: Lower right; G1: G1 phase; S: S phase; G2: G2 phase.
- Citation: Sun QJ, Liu T. Subcellular distribution of prohibitin 1 in rat liver during liver regeneration and its cellular implication. World J Hepatol 2024; 16(1): 65-74
- URL: https://www.wjgnet.com/1948-5182/full/v16/i1/65.htm
- DOI: https://dx.doi.org/10.4254/wjh.v16.i1.65


