Copyright
©The Author(s) 2023.
World J Hepatol. May 27, 2023; 15(5): 707-714
Published online May 27, 2023. doi: 10.4254/wjh.v15.i5.707
Published online May 27, 2023. doi: 10.4254/wjh.v15.i5.707
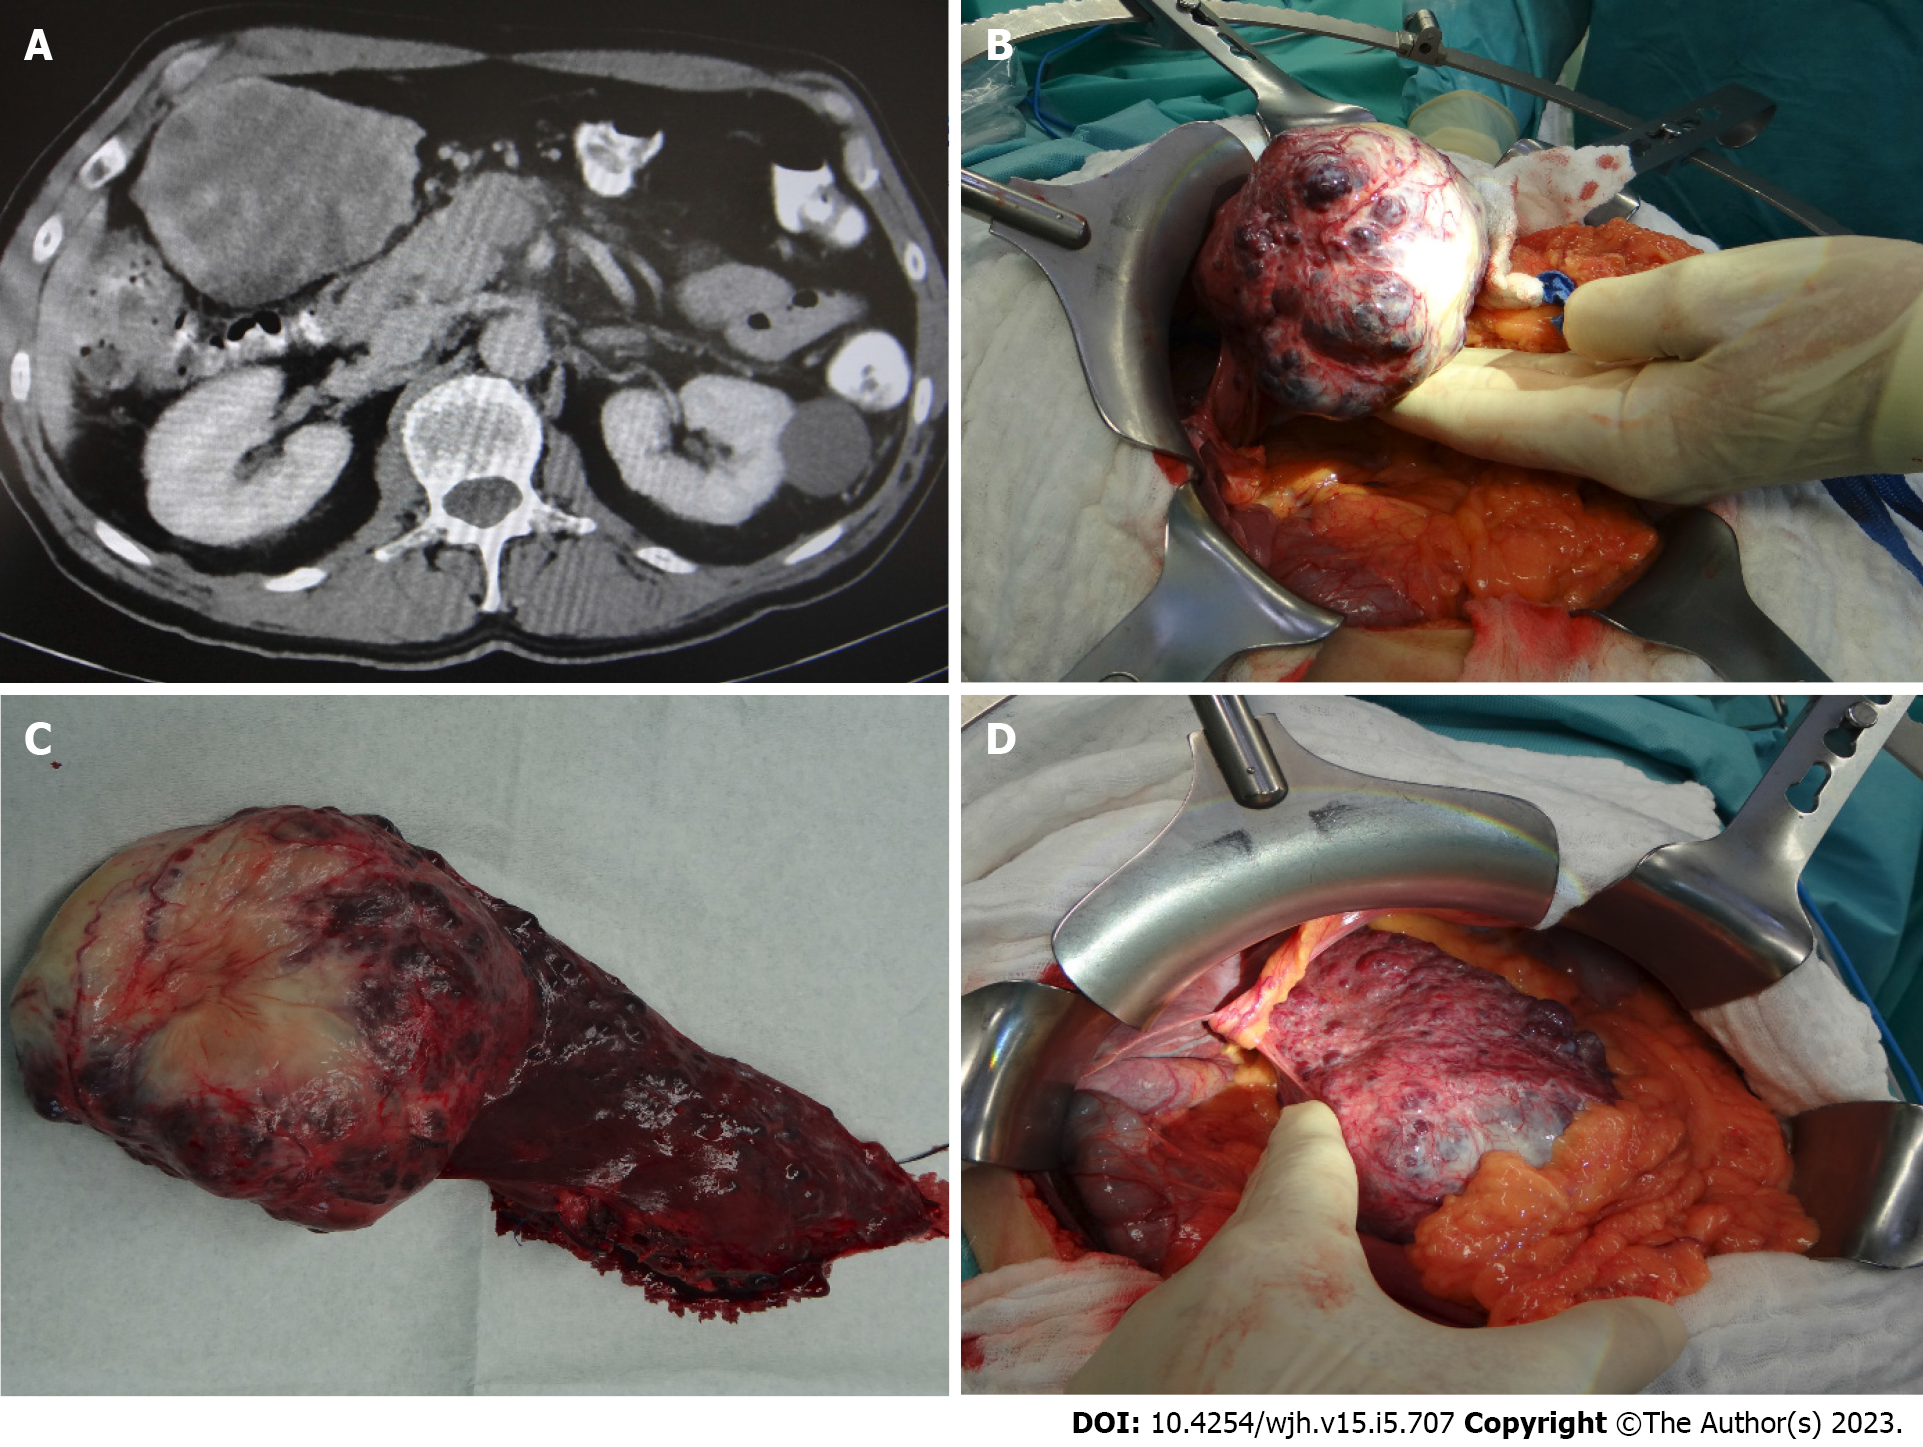
Figure 1 Computed tomography imaging and intraoperative pictures.
A: Computed tomography imaging demonstrating a giant multicystic vascular liver tumor; B and D: Intraoperative presentation; C: Macroscopic tumor. Main vascular tumor on the left side, adjacent liver parenchyma with multiple small tumor nodules on the right side.
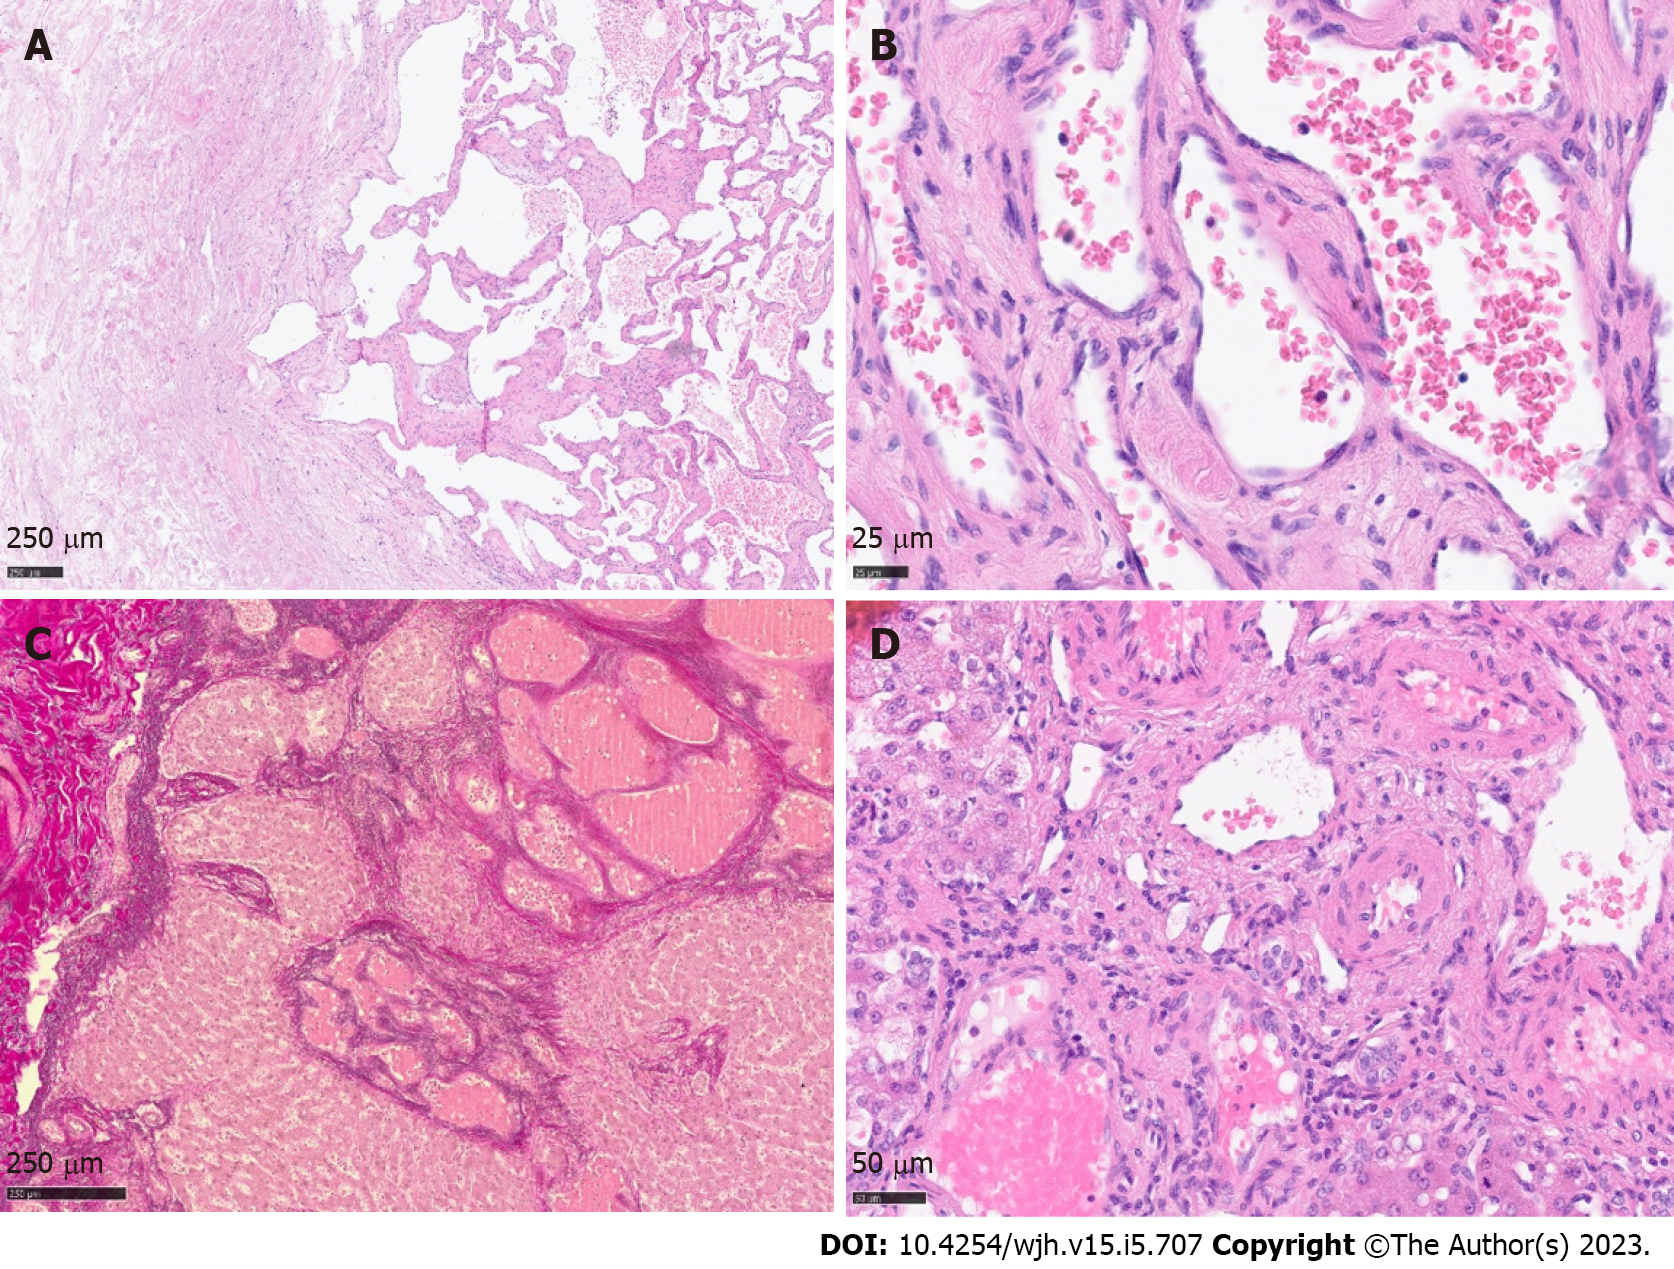
Figure 2 Histology of giant cavernous hemangioma with satellite nodules.
A: Tumor overview with dilatated vascular channels on the right side and fibrous regressive tissue on the left side; B and C: Main tumor, high resolution. Vascular channels lined by inconspicuous endothelium; D: EvG staining highlighting tumor nodules in the periphery.
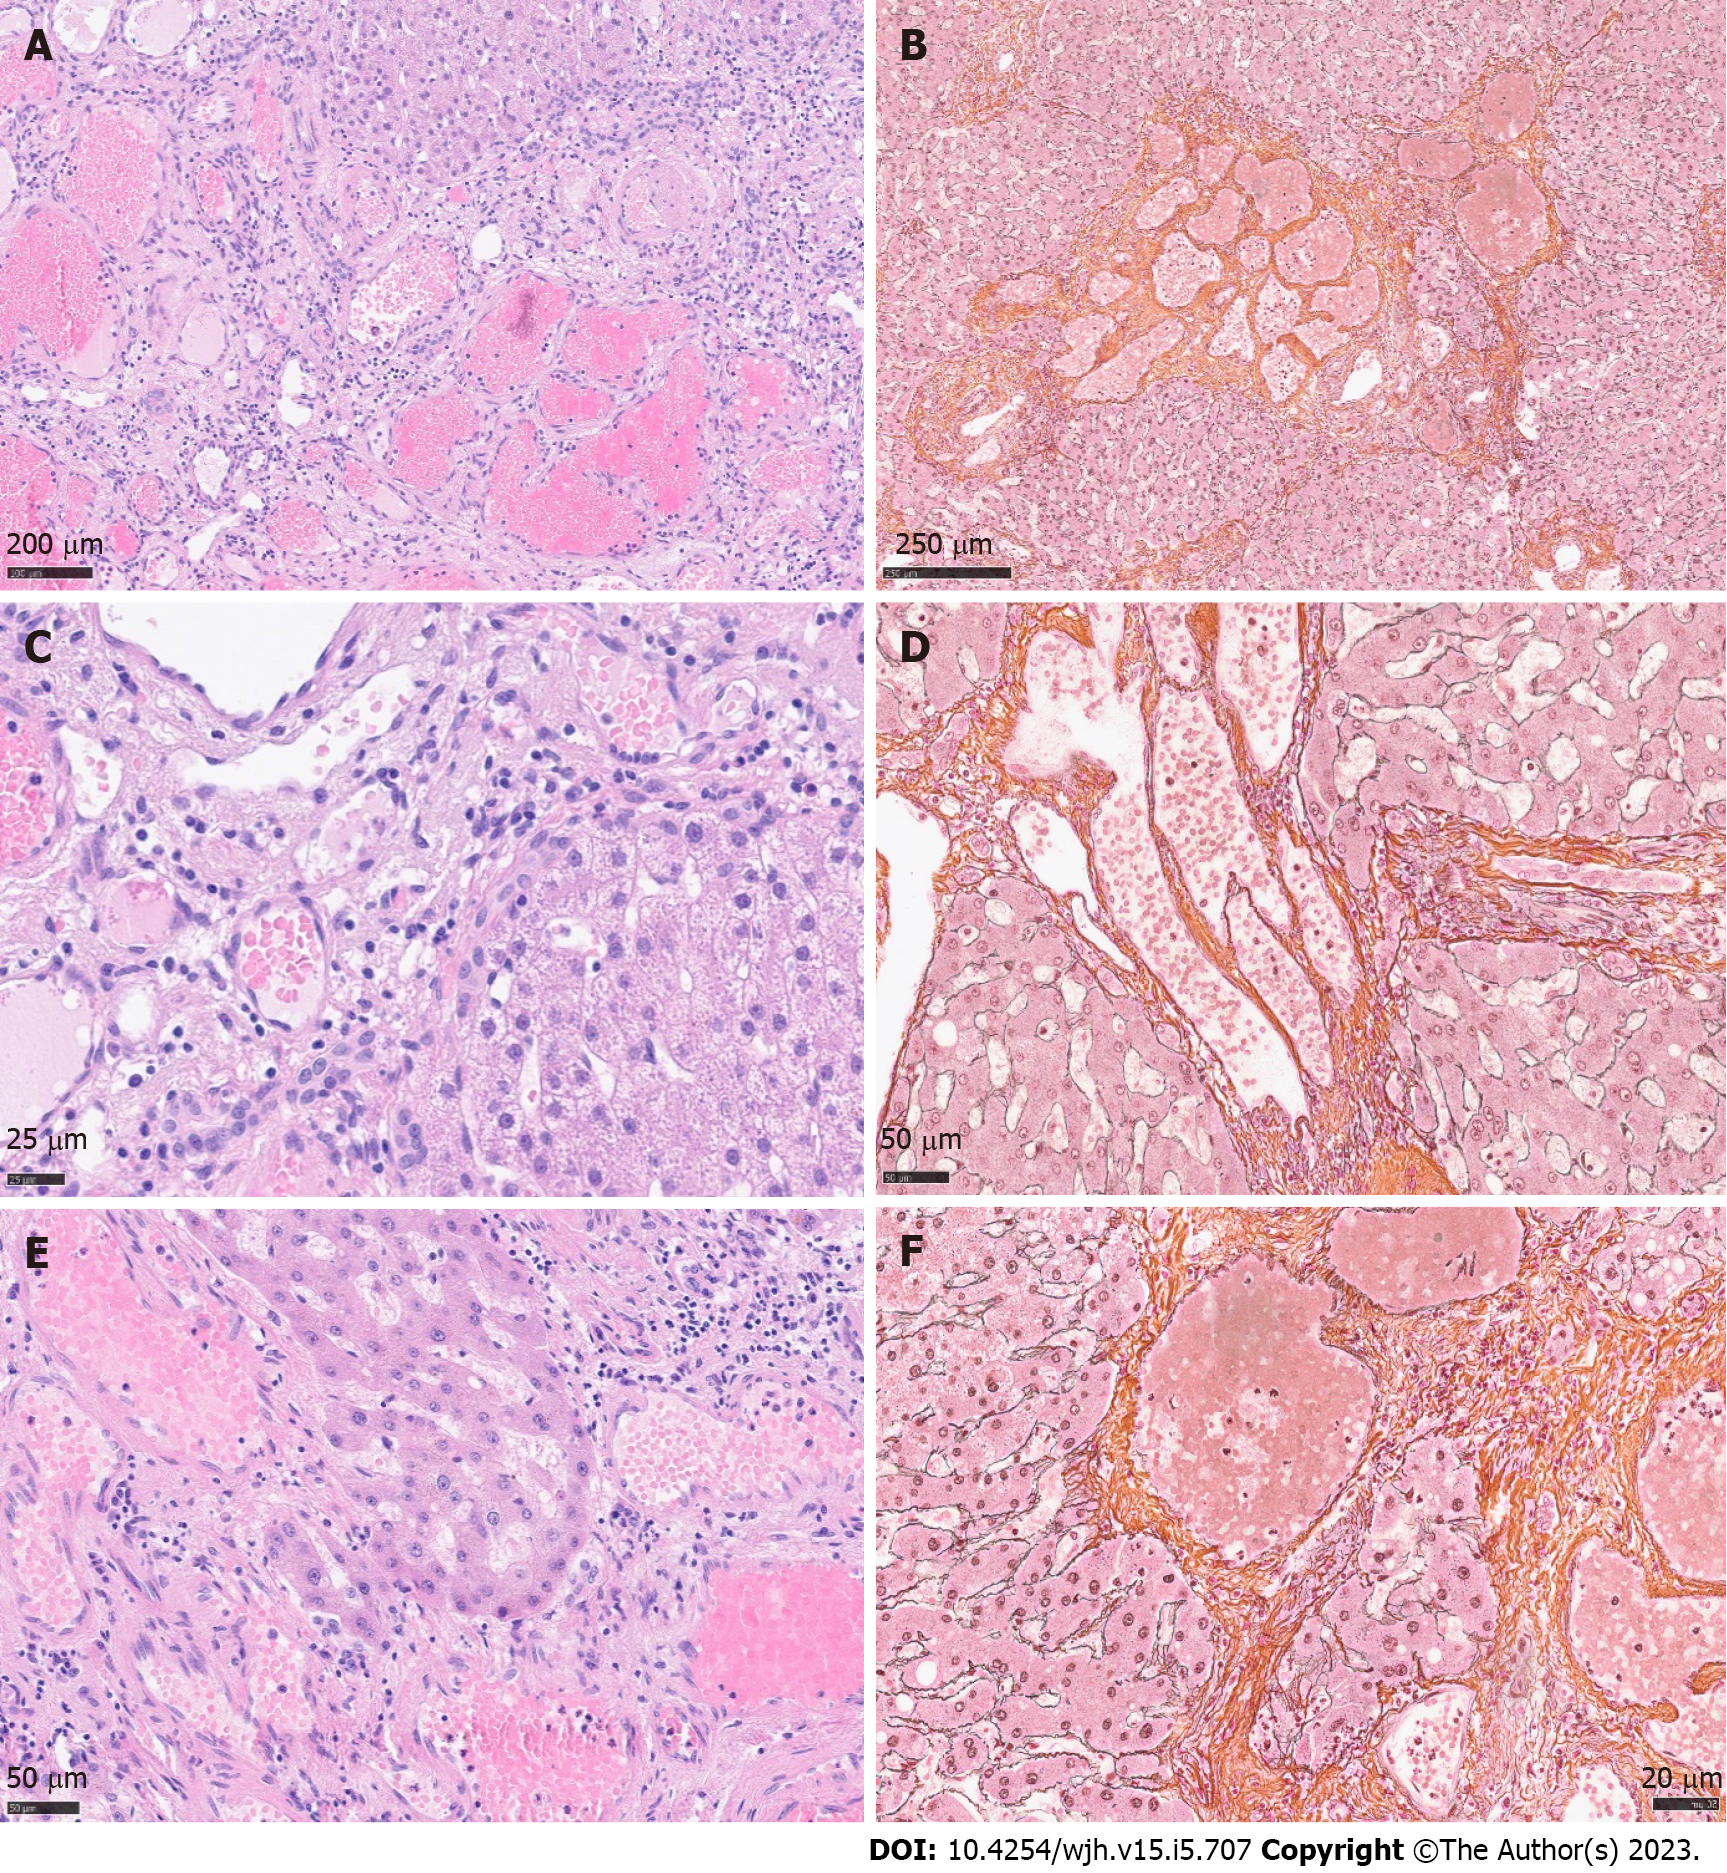
Figure 3 Histology of giant cavernous hemangioma with satellite nodules.
A and B: Satellite nodules of giant hepatic cavernous hemangioma with ill-defined borders, overview in H&E staining and Gomori reticulin fiber staining; C-F: Dilatated vascular channels, partially with hemangioma-like morphology, showing bland endothelial lining. Direct contact with adjacent liver parenchyma without formation of a fibrous capsule. High resolution. H&E, left side; Gomori, right side.
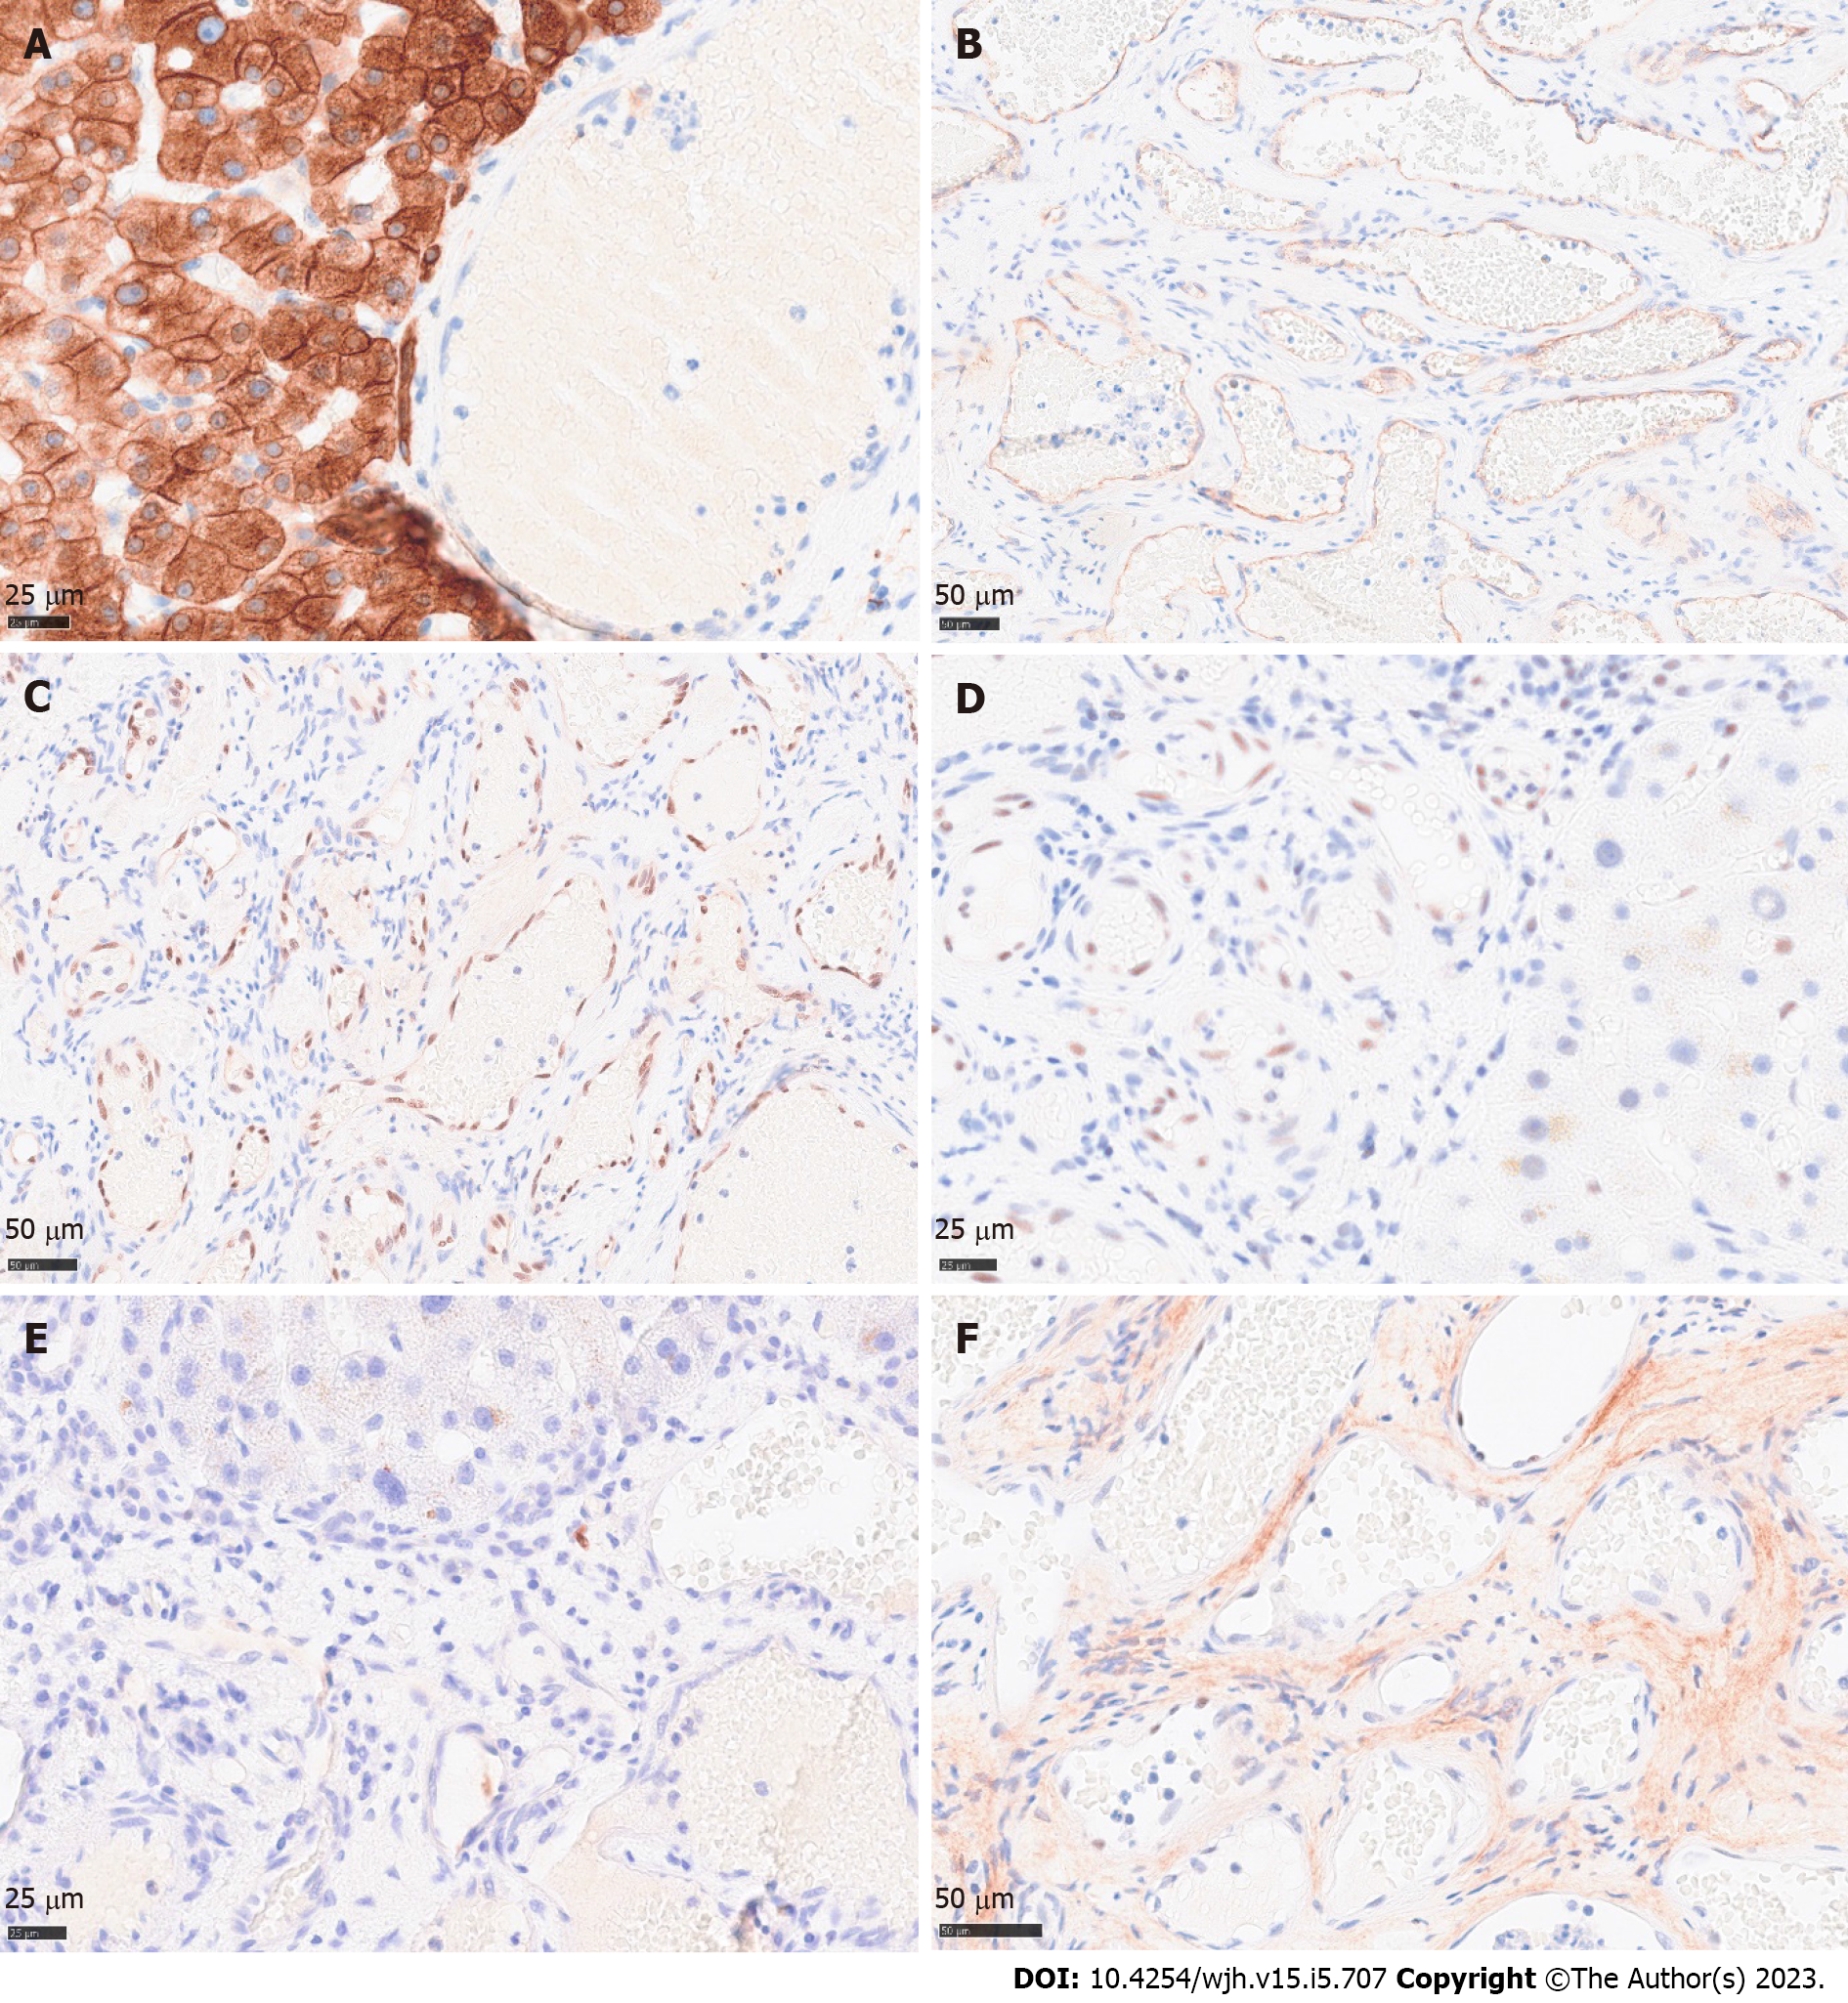
Figure 4 Immunohistochemical profile of cavernous hemangioma.
A: Broad spectrum keratine CKAE1/AE3 demonstrating pushing growth pattern of satellite tumor nodules against preexistent liver parenchyma; B: CD34 highlighting vascular tumor channels; C and D: ERG and Fli1 nuclear staining of endothelial tumor cells; E: Negative proliferative activity of satellite tumor nodules, protruding into the liver parenchyma; F: Negative or weak nuclear accumulation of TP53.
- Citation: Fischer AK, Beckurts KTE, Büttner R, Drebber U. Giant cavernous hemangioma of the liver with satellite nodules: Aspects on tumour/tissue interface: A case report. World J Hepatol 2023; 15(5): 707-714
- URL: https://www.wjgnet.com/1948-5182/full/v15/i5/707.htm
- DOI: https://dx.doi.org/10.4254/wjh.v15.i5.707


