Copyright
©The Author(s) 2023.
World J Hepatol. Feb 27, 2023; 15(2): 225-236
Published online Feb 27, 2023. doi: 10.4254/wjh.v15.i2.225
Published online Feb 27, 2023. doi: 10.4254/wjh.v15.i2.225
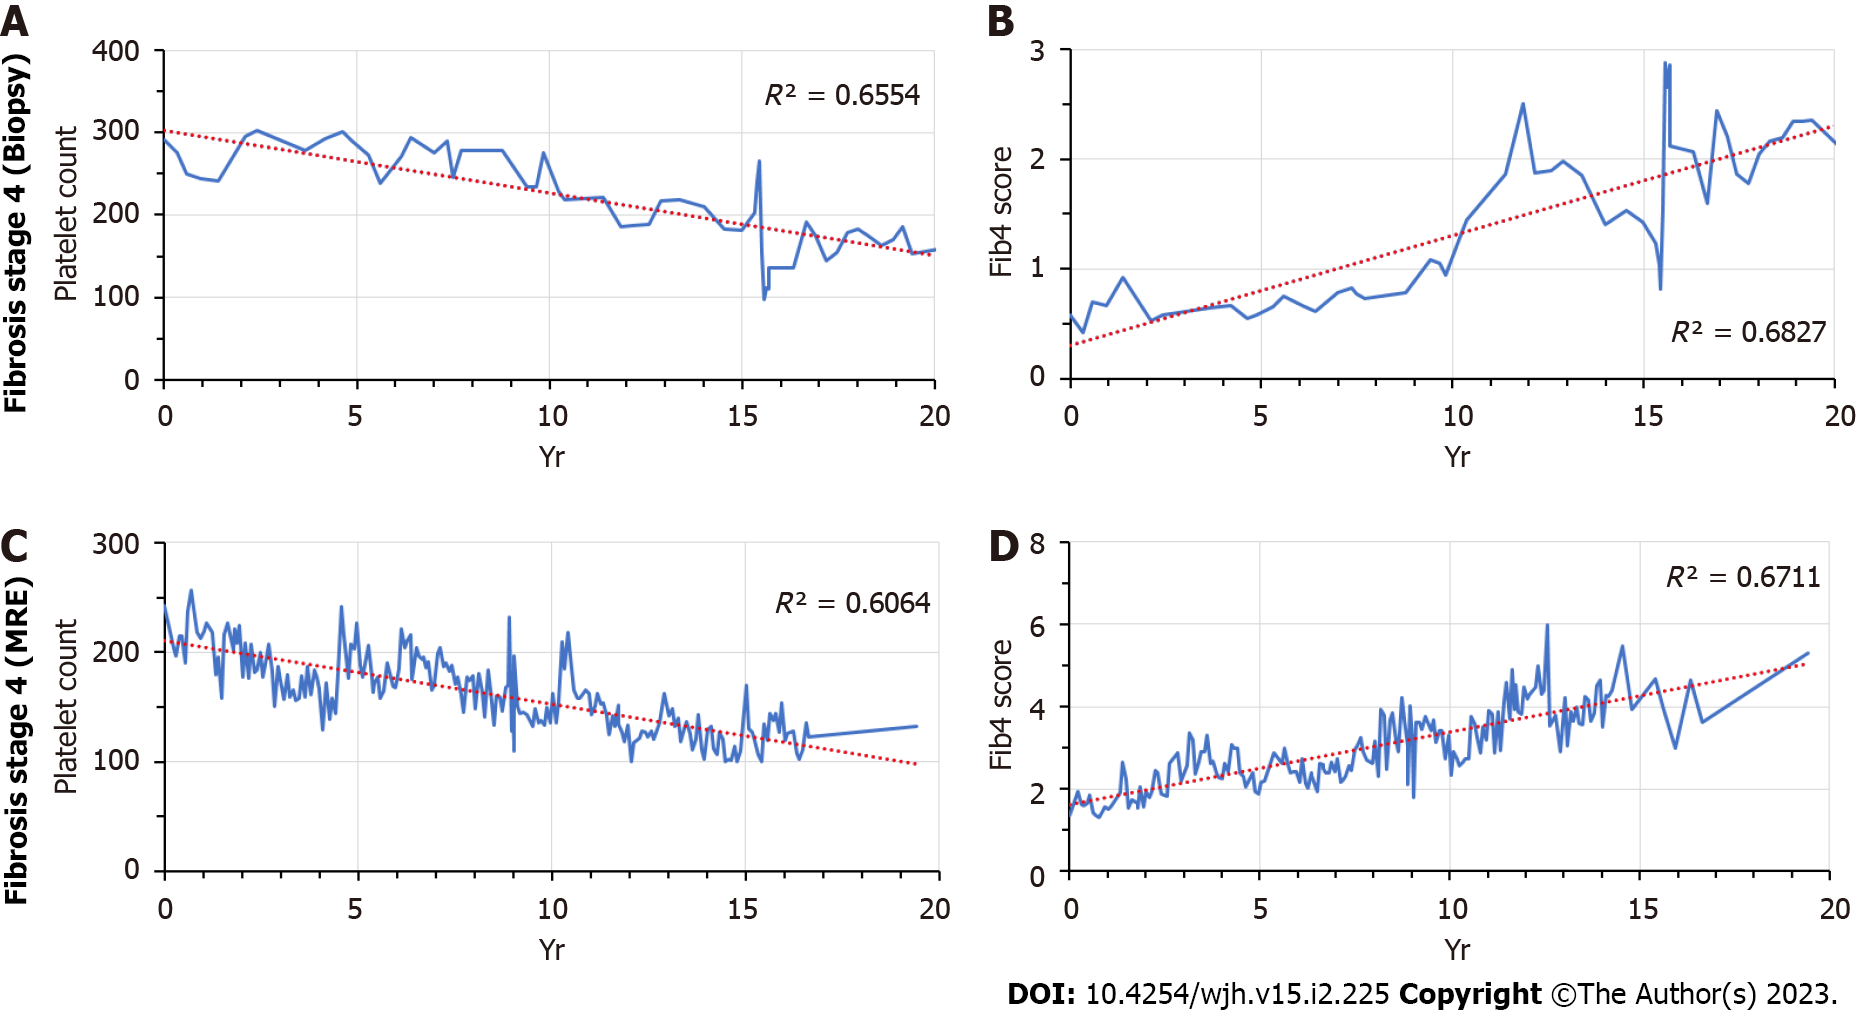
Figure 1 Long-term changes in platelet counts and Fib4 scores prior to the establishment of cirrhosis.
A: Patient 1, platelet counts; B: Patient 1, Fib4 scores; C: Patient 2, platelet counts; D: Patient 2, Fib4 scores. MRE: Magnetic resonance elastography.
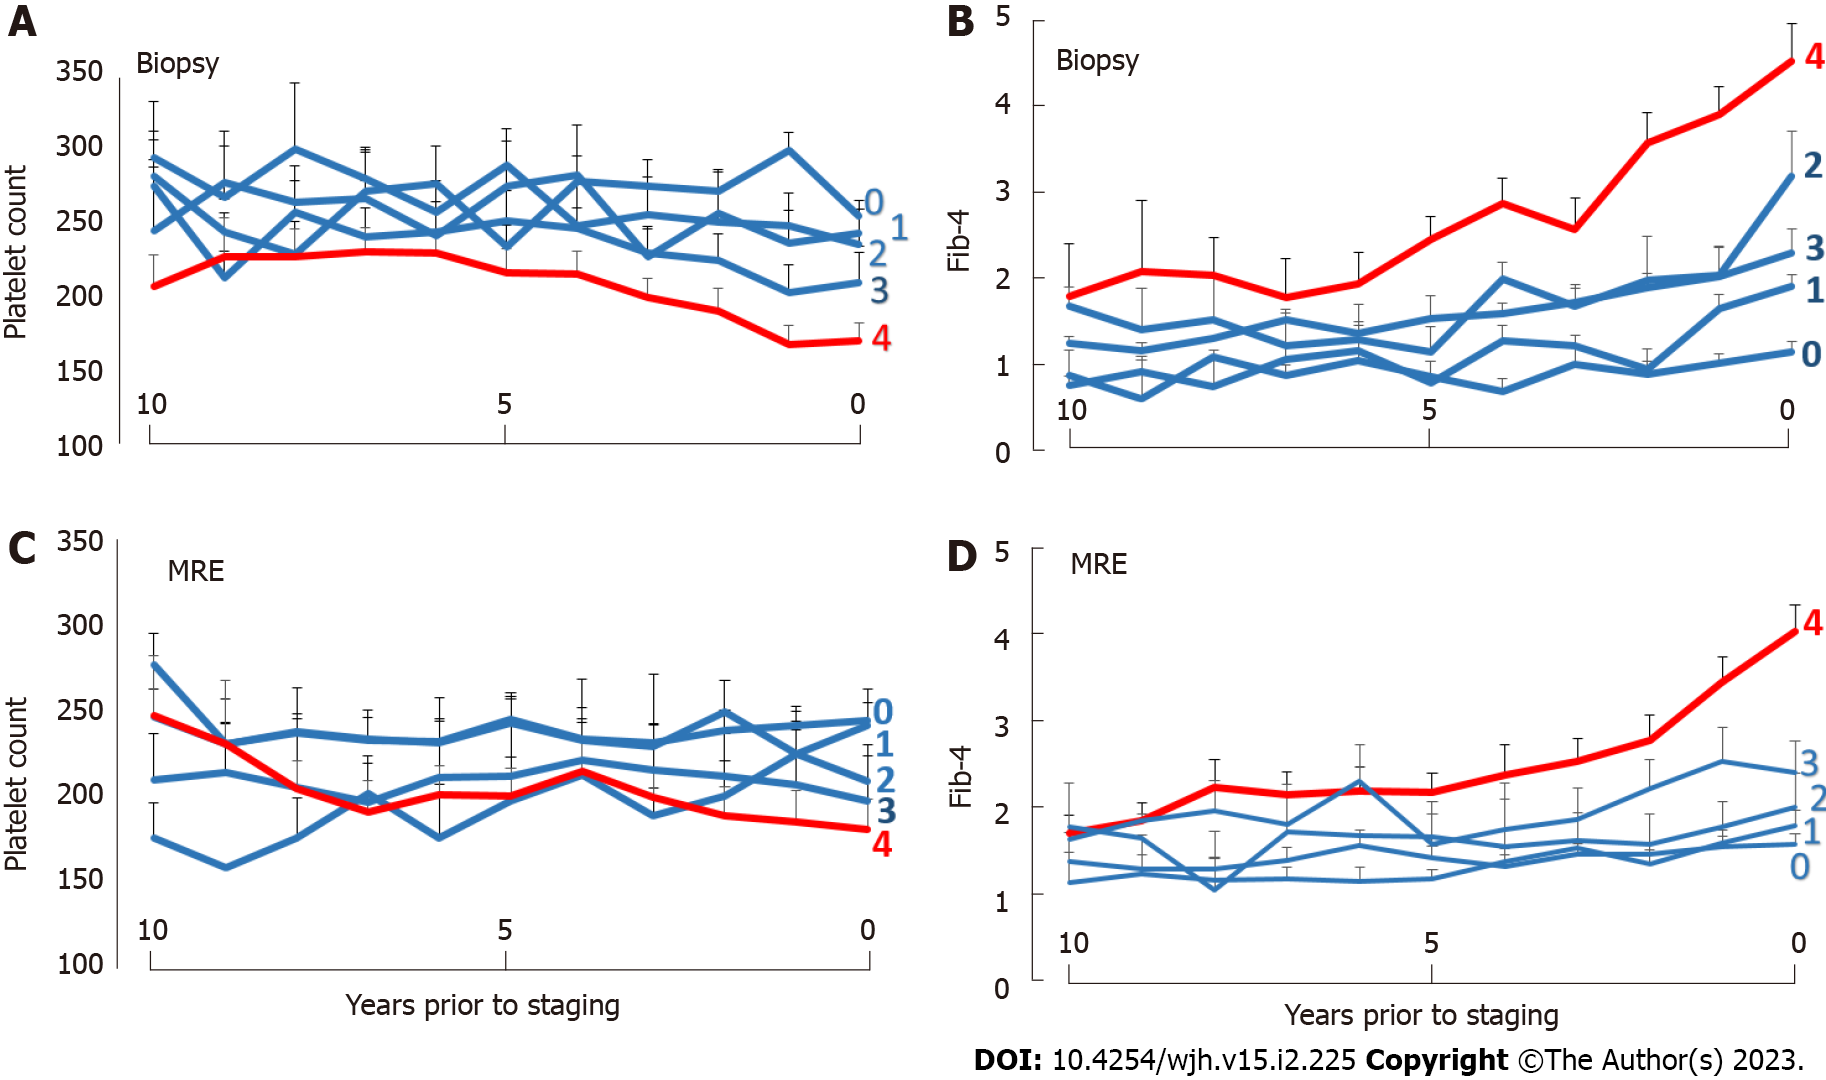
Figure 2 Time-dependent changes in platelet counts and Fib-4 scores: Cohort averages.
A: Biopsy cohort, platelet counts; B: Biopsy cohort, Fib4 scores; C: Magnetic resonance elastography (MRE) cohort, platelet counts; D: MRE cohort, Fib4 scores. Data are shown as mean + standard error. Fibrosis stages 0–4 are marked by the corresponding numerals. For magnetic resonance elastography data, “0” corresponds to a liver stiffness of < 2.9 kPa, “1” to 2.9-3.5 kPa, “2” to 3.5-4.0 kPa, “3” to 40–5.0 kPa, and “4” to > 5.0 kPa. MRE: Magnetic resonance elastography.
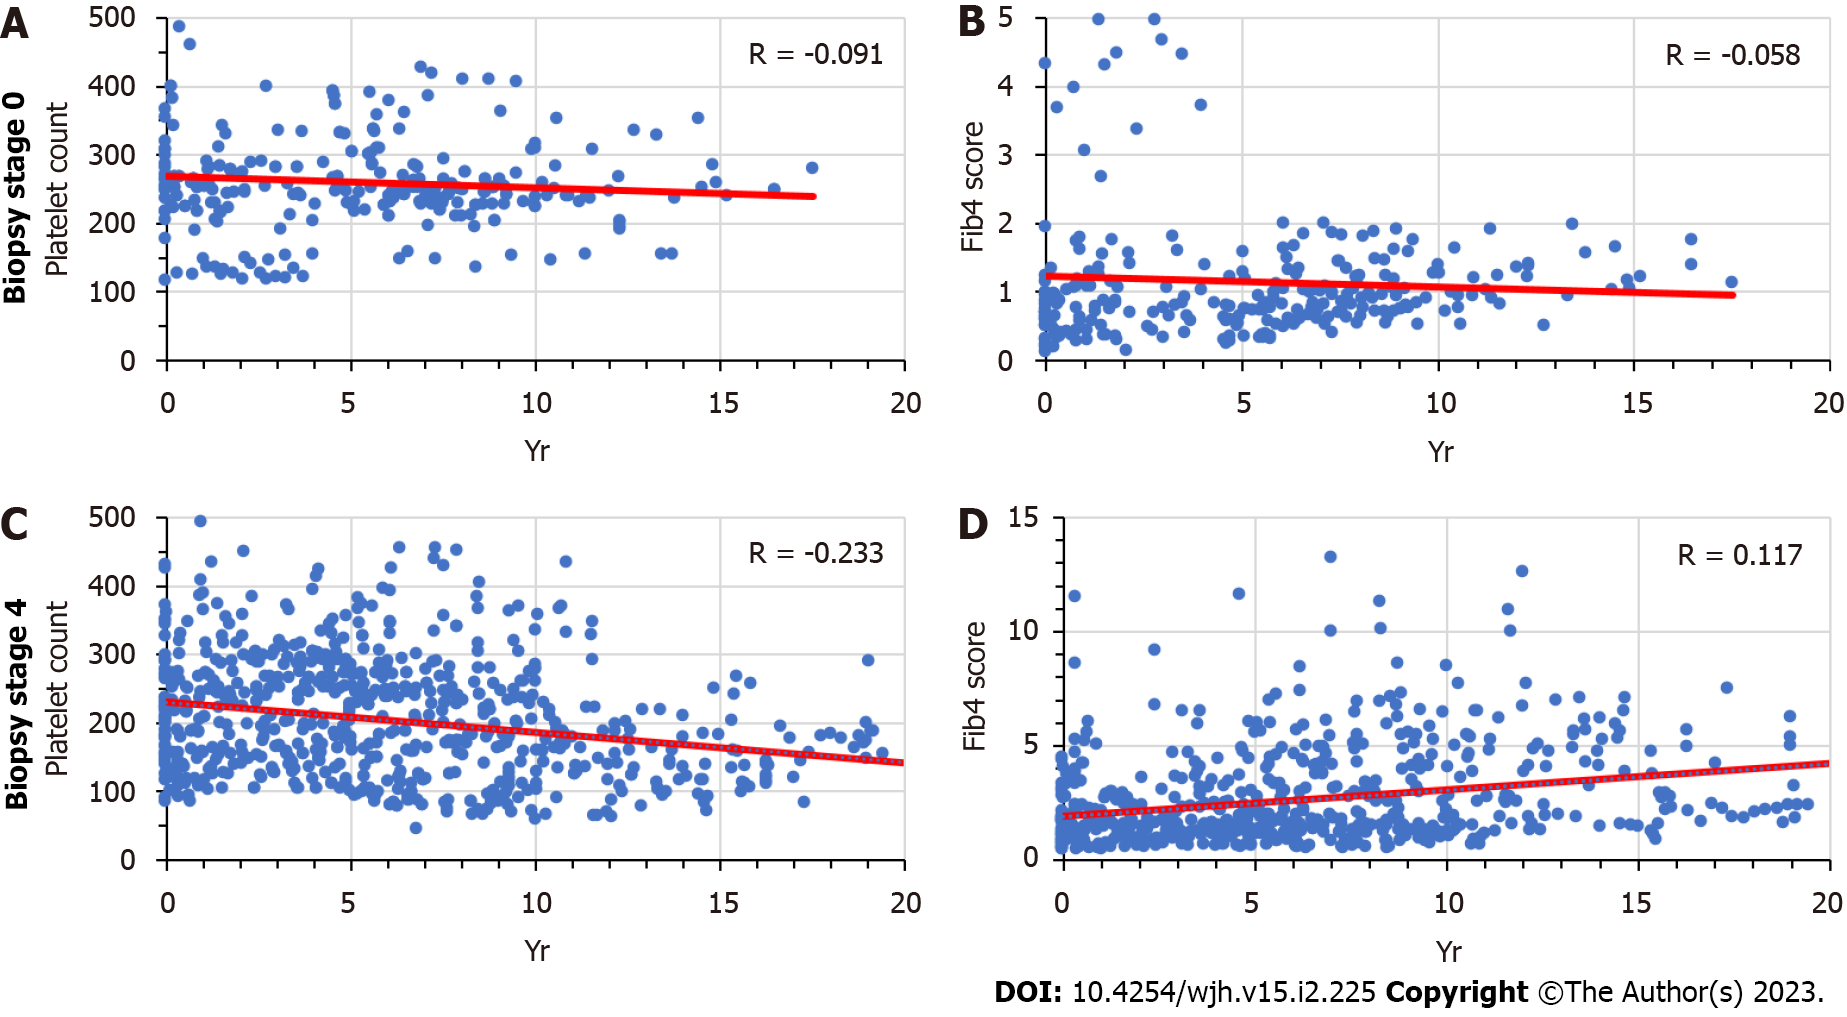
Figure 3 Time-dependent changes in platelet counts and Fib-4 scores: Stage 0 vs stage 4 fibrosis by liver biopsy.
A: Stage 0 fibrosis, platelet counts; B: Stage 0 fibrosis, Fib4 scores; C: Stage 4 fibrosis, platelet counts; D: Stage 4 fibrosis, Fib4 scores.
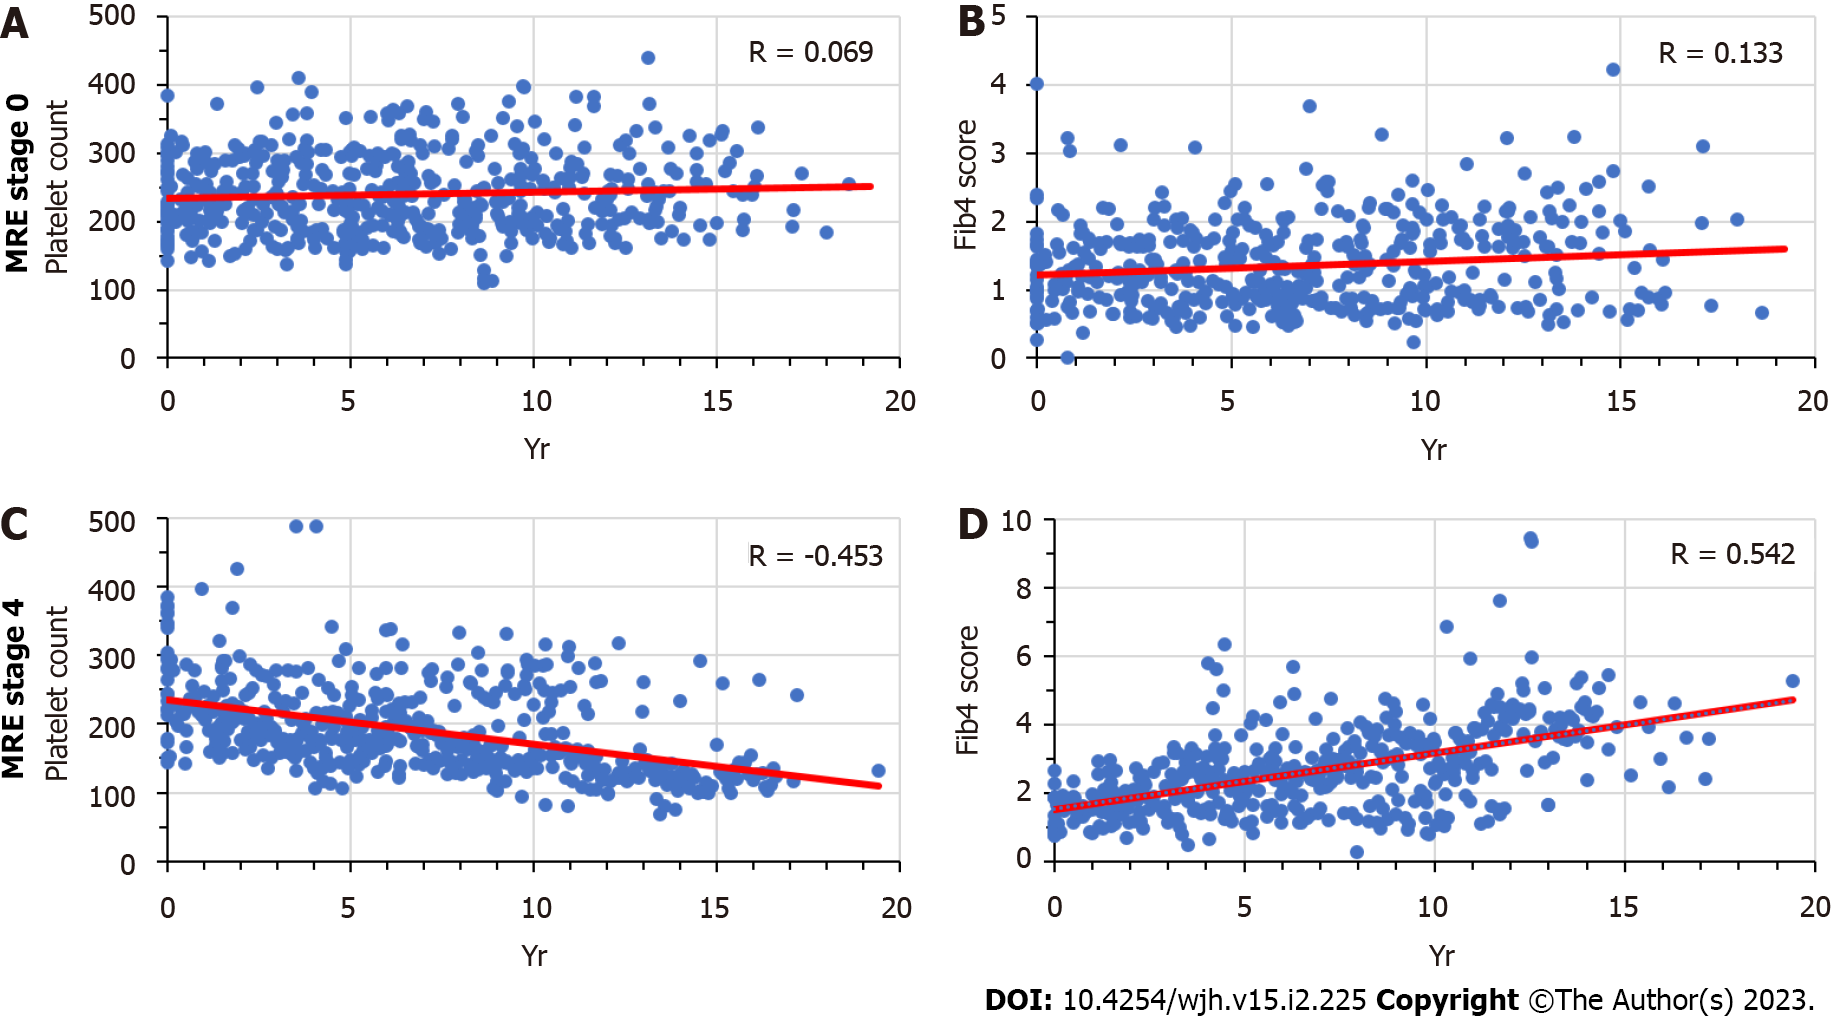
Figure 4 Time-Dependent changes in platelet counts and Fib-4 scores: stage 0 vs stage 4 fibrosis by magnetic resonance elastography.
A: Stage 0 fibrosis, platelet counts; B: Stage 0 fibrosis, Fib4 scores; C: Stage 4 fibrosis, platelet counts; D: Stage 4 fibrosis, Fib4 scores. MRE: Magnetic resonance elastography.
- Citation: Zijlstra MK, Gampa A, Joseph N, Sonnenberg A, Fimmel CJ. Progressive changes in platelet counts and Fib-4 scores precede the diagnosis of advanced fibrosis in NASH patients. World J Hepatol 2023; 15(2): 225-236
- URL: https://www.wjgnet.com/1948-5182/full/v15/i2/225.htm
- DOI: https://dx.doi.org/10.4254/wjh.v15.i2.225


