Copyright
©The Author(s) 2022.
World J Hepatol. Sep 27, 2022; 14(9): 1830-1839
Published online Sep 27, 2022. doi: 10.4254/wjh.v14.i9.1830
Published online Sep 27, 2022. doi: 10.4254/wjh.v14.i9.1830
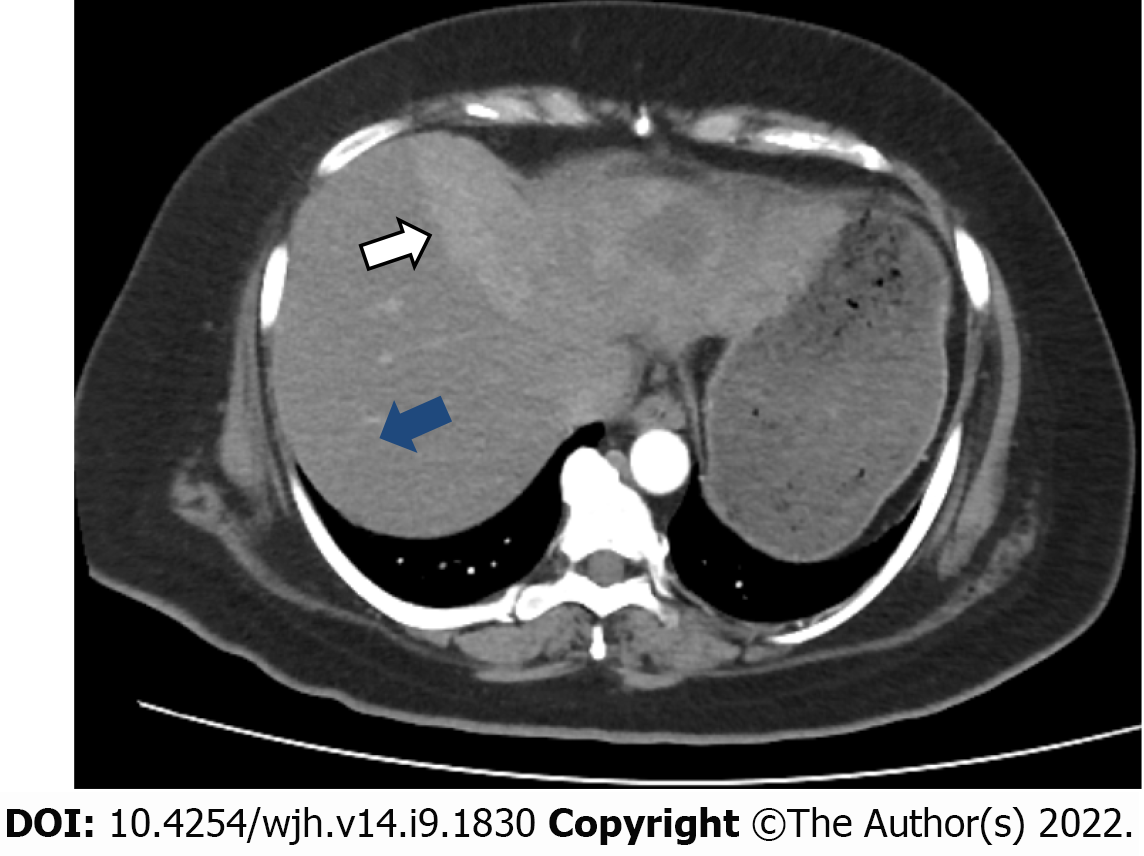
Figure 1 Contrast enhanced tomography scan image demonstrating a large enhancing heterogeneous mass in the left lobe of the liver (white arrow), surrounding normal the liver tissue (blue arrow).
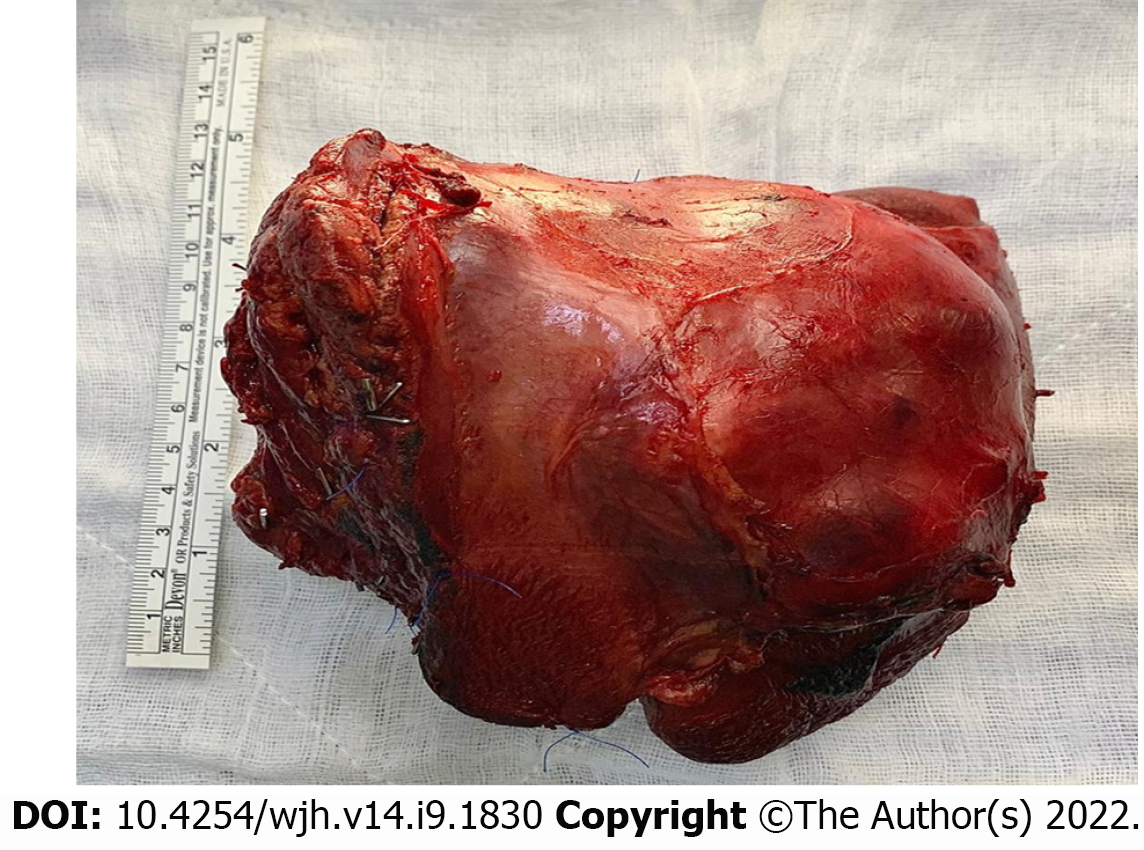
Figure 2 Resected specimen.
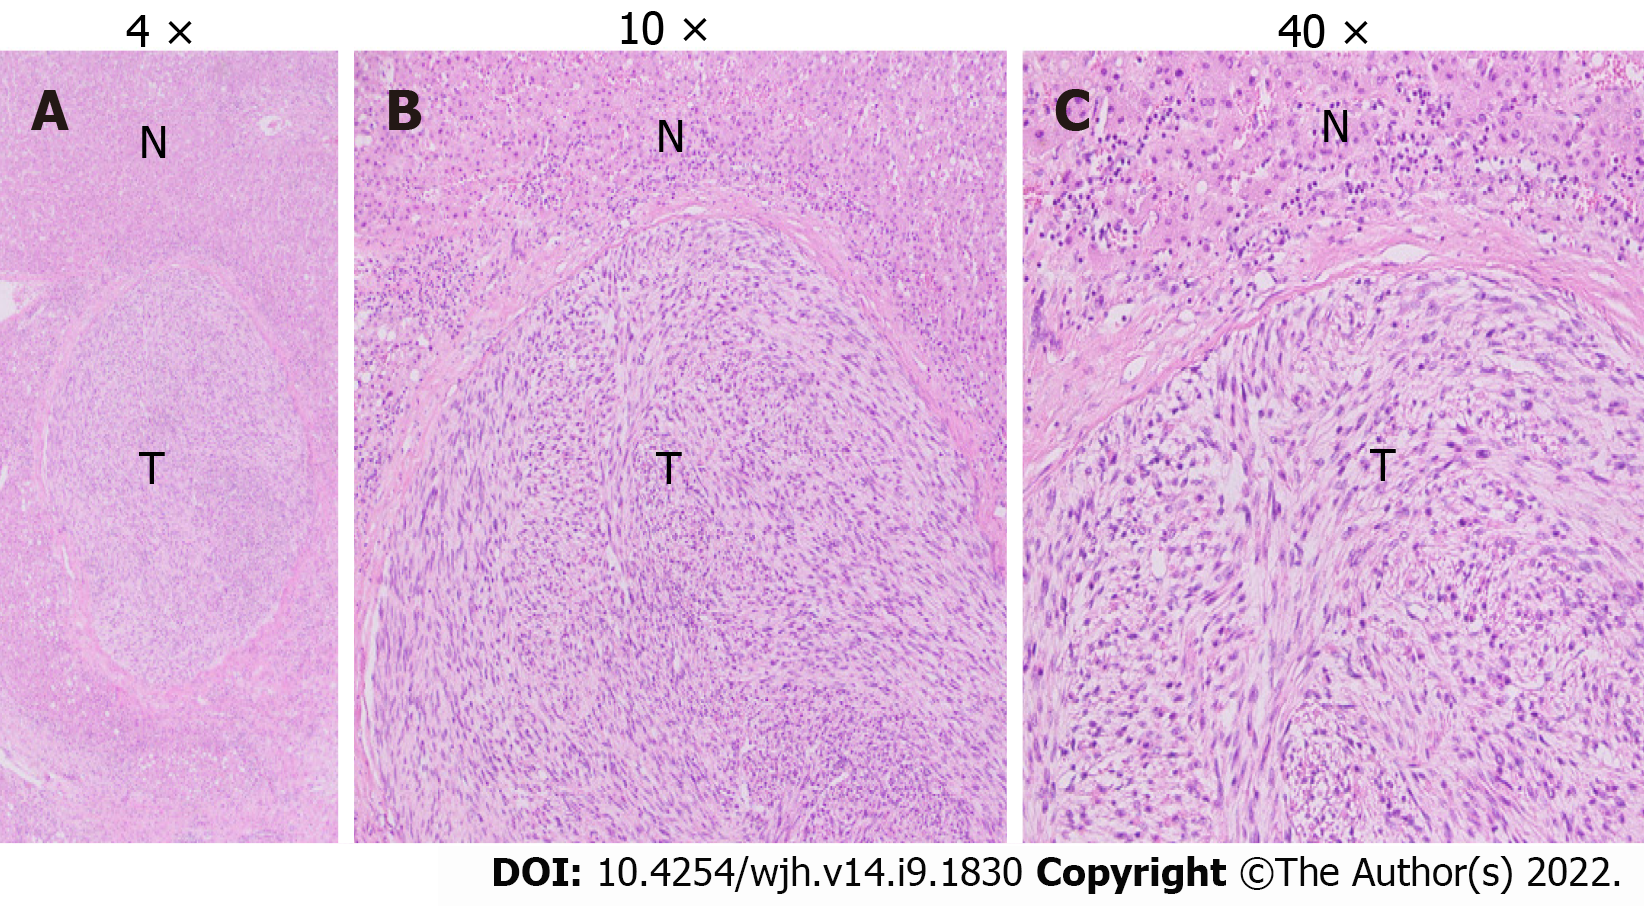
Figure 3 Leiomoyosarcoma, subsequent resection specimen.
A: Original magnification: 4 ×, scale bar: 100 μm; B: The above figures show liver parenchyma with a central nodule/tumor fascicular array of cells having spindle-shaped nuclei, moderate degree nuclear atypia (original magnification: 10 ×; scale bar: 100 μm); C: Mitoses marked as T, and normal liver hepatocytes marked as N (original magnification: 40 ×; scale bar: 100 μm).
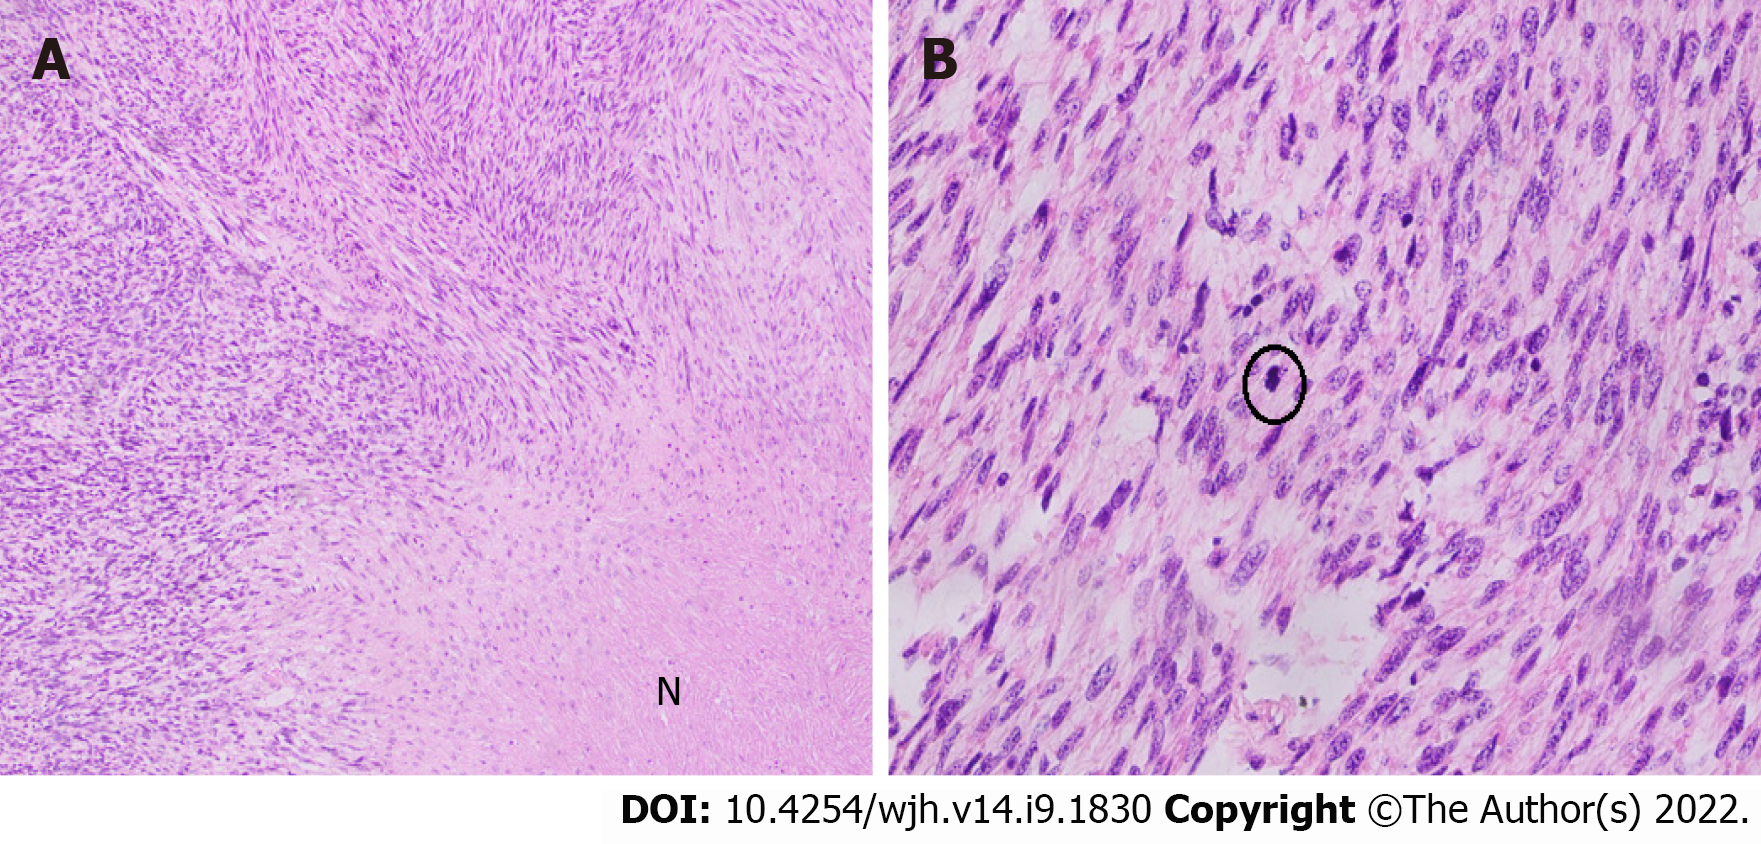
Figure 4 Hematoxylin and eosin stain of leiomoyosarcoma.
A: Hematoxylin and eosin stain of leiomoyosarcoma, resected specimen, a section of the liver shows fascicular array of cells with spindle-shaped nuclei (Original magnification: 100 ×; scale bar: 100 μm); B: A moderate degree nuclear atypia, and mitoses (encircled) along with areas of necrosis marked as N (original magnification: 400 ×; scale bar: 100 μm).
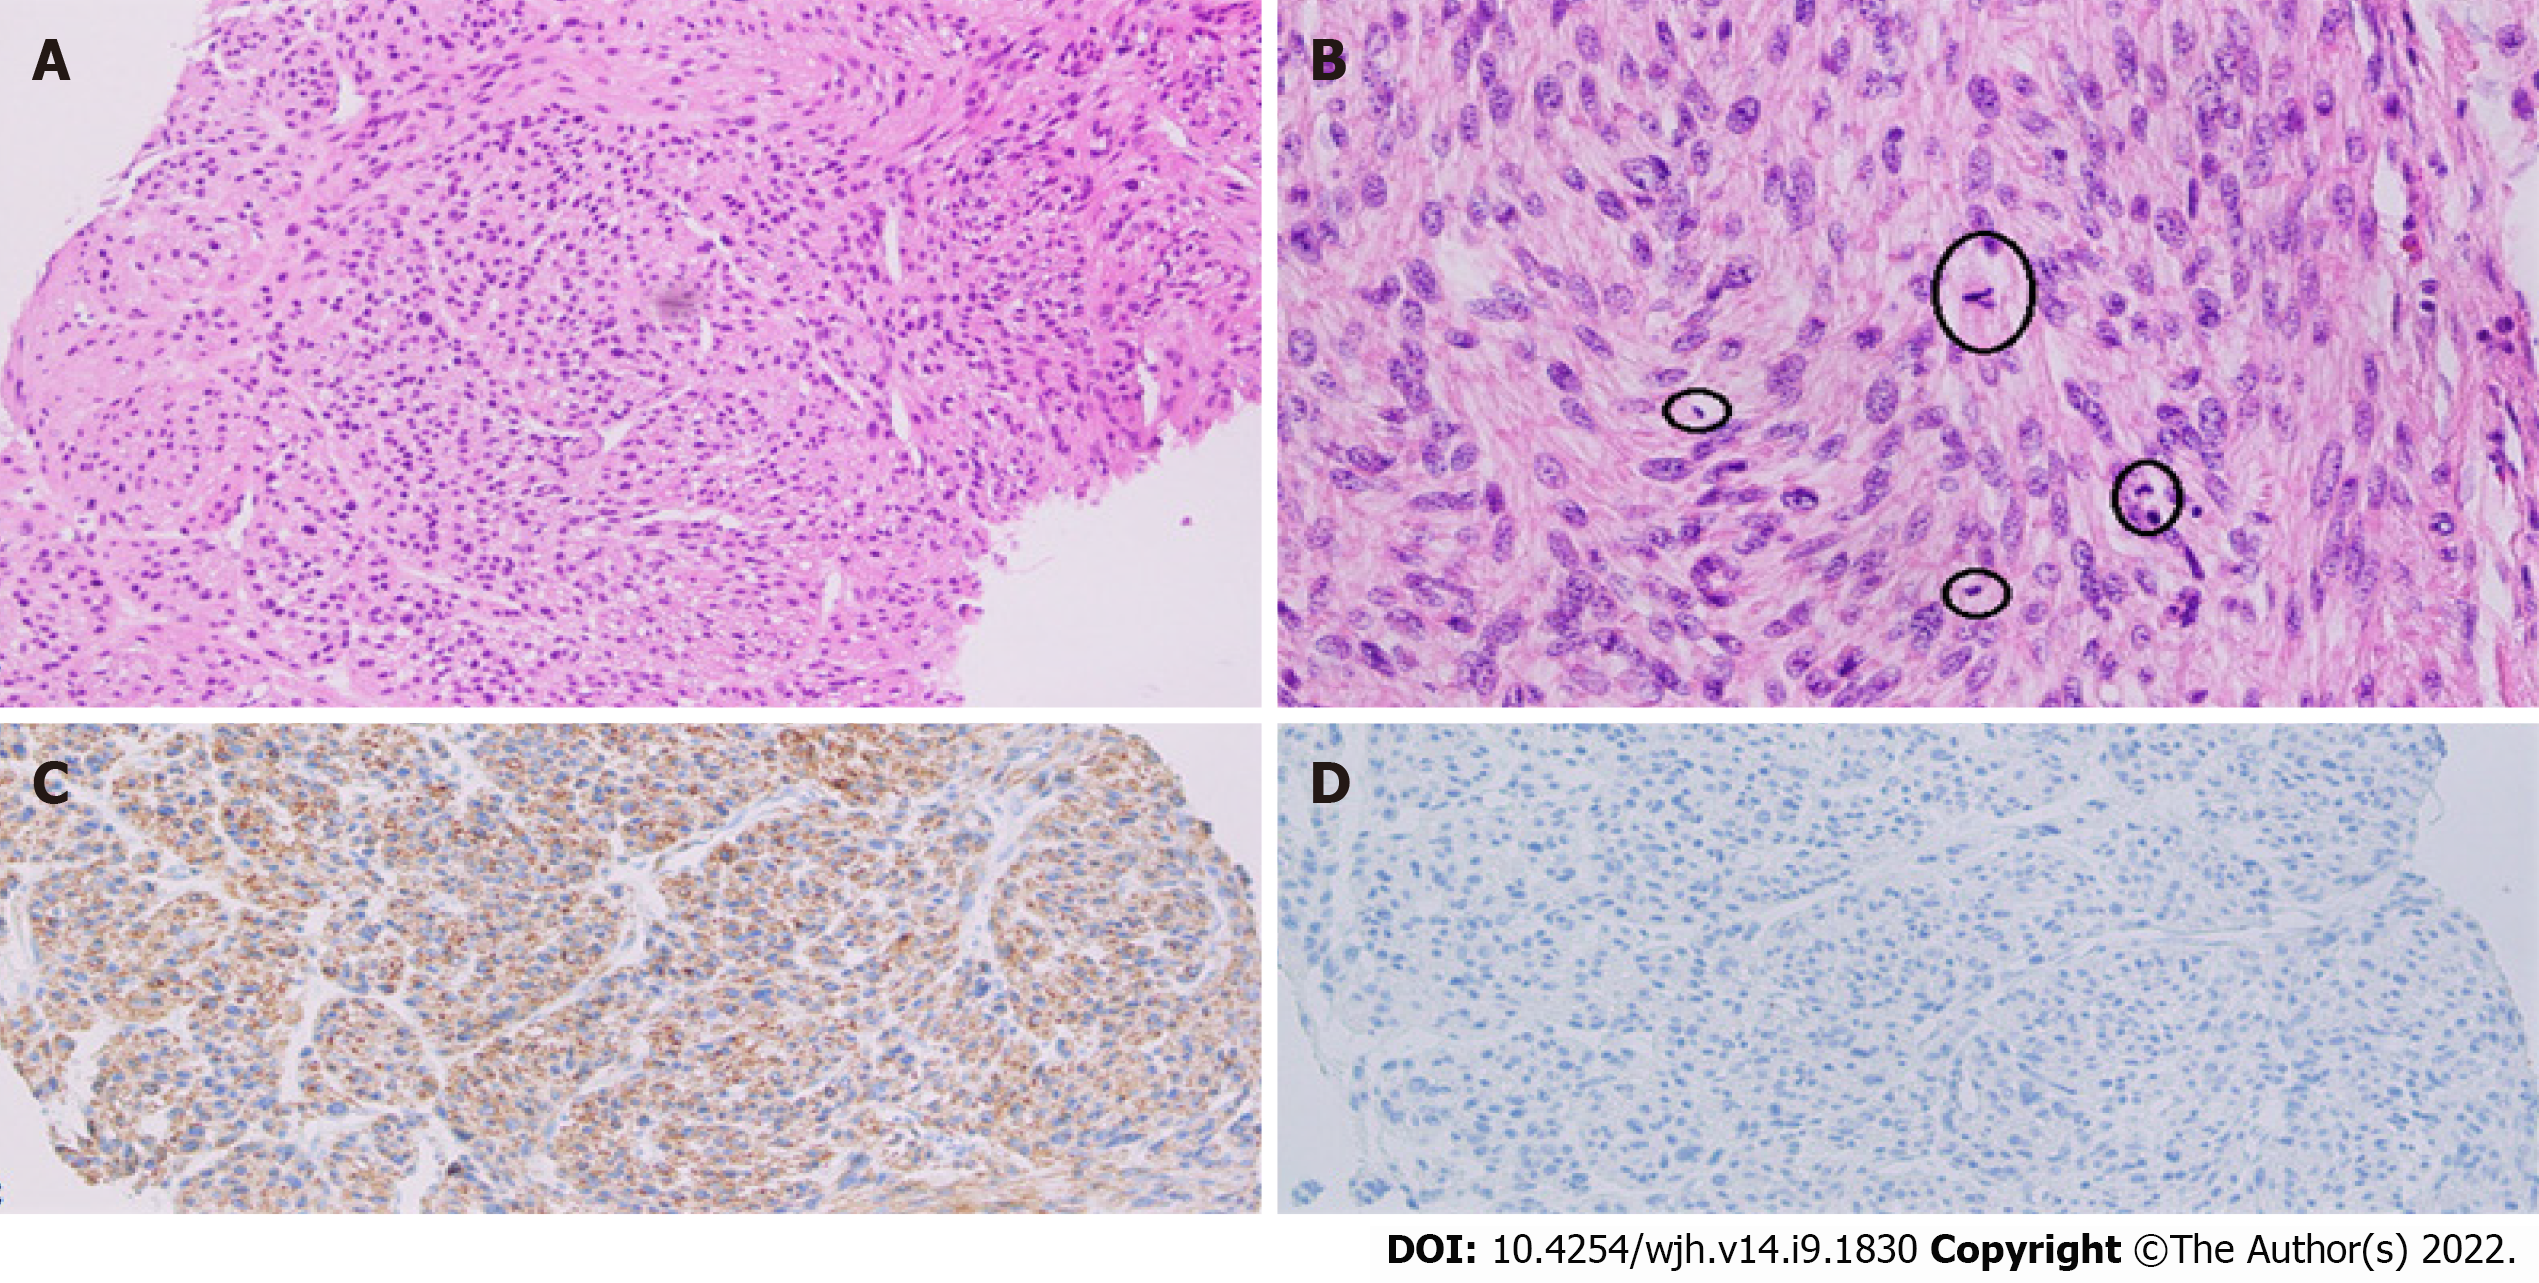
Figure 5 Fascicular array of cells with spindle-shaped nuclei.
A: Moderate degree nuclear atypia (original magnification: 100 ×; scale bar: 100 μm); B: Mitoses (encircled) (original magnification: 100 ×; scale bar: 100 μm); C: Immunostaining of desmin highlighting spindle-shaped cells (original magnification: 100 ×; scale bar: 100 μm); D: Caldesmon-negative (original magnification: 100 ×; scale bar: 100 μm).
- Citation: Ahmed H, Bari H, Nisar Sheikh U, Basheer MI. Primary hepatic leiomyosarcoma: A case report and literature review . World J Hepatol 2022; 14(9): 1830-1839
- URL: https://www.wjgnet.com/1948-5182/full/v14/i9/1830.htm
- DOI: https://dx.doi.org/10.4254/wjh.v14.i9.1830


