Copyright
©The Author(s) 2022.
World J Hepatol. Sep 27, 2022; 14(9): 1790-1803
Published online Sep 27, 2022. doi: 10.4254/wjh.v14.i9.1790
Published online Sep 27, 2022. doi: 10.4254/wjh.v14.i9.1790
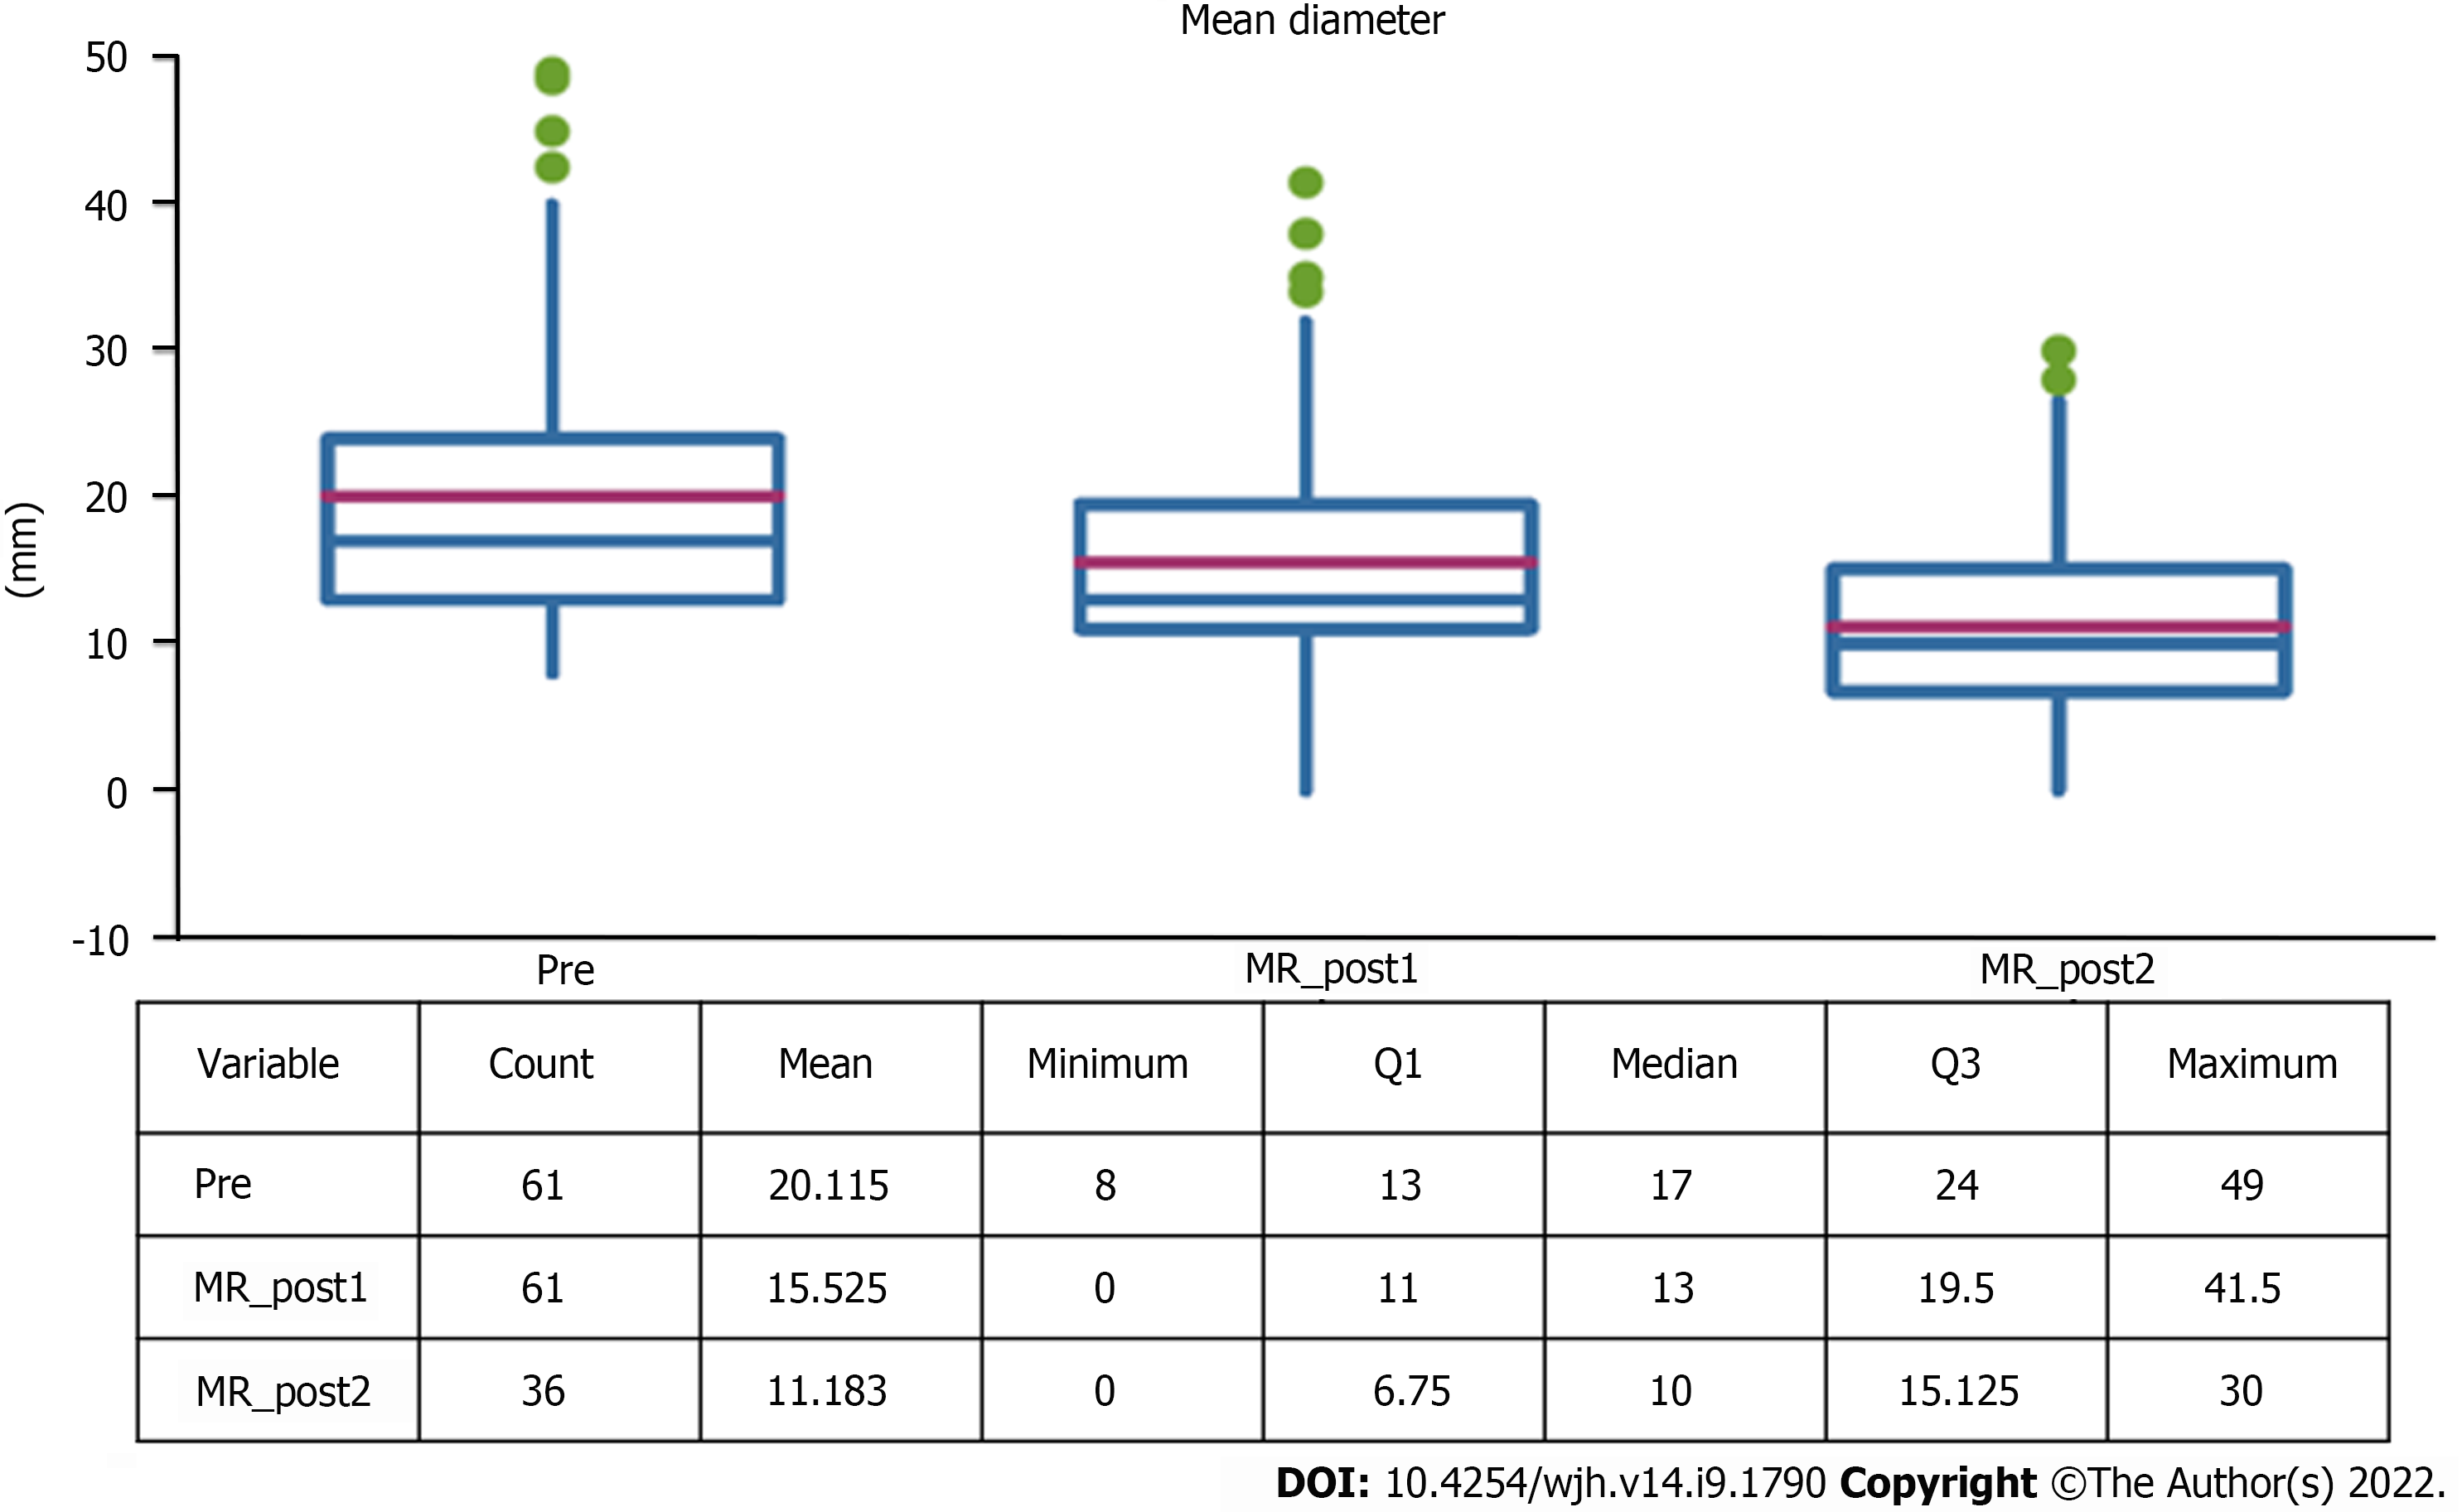
Figure 1 Change in lesion diameter.
MR: Magnetic resonance.
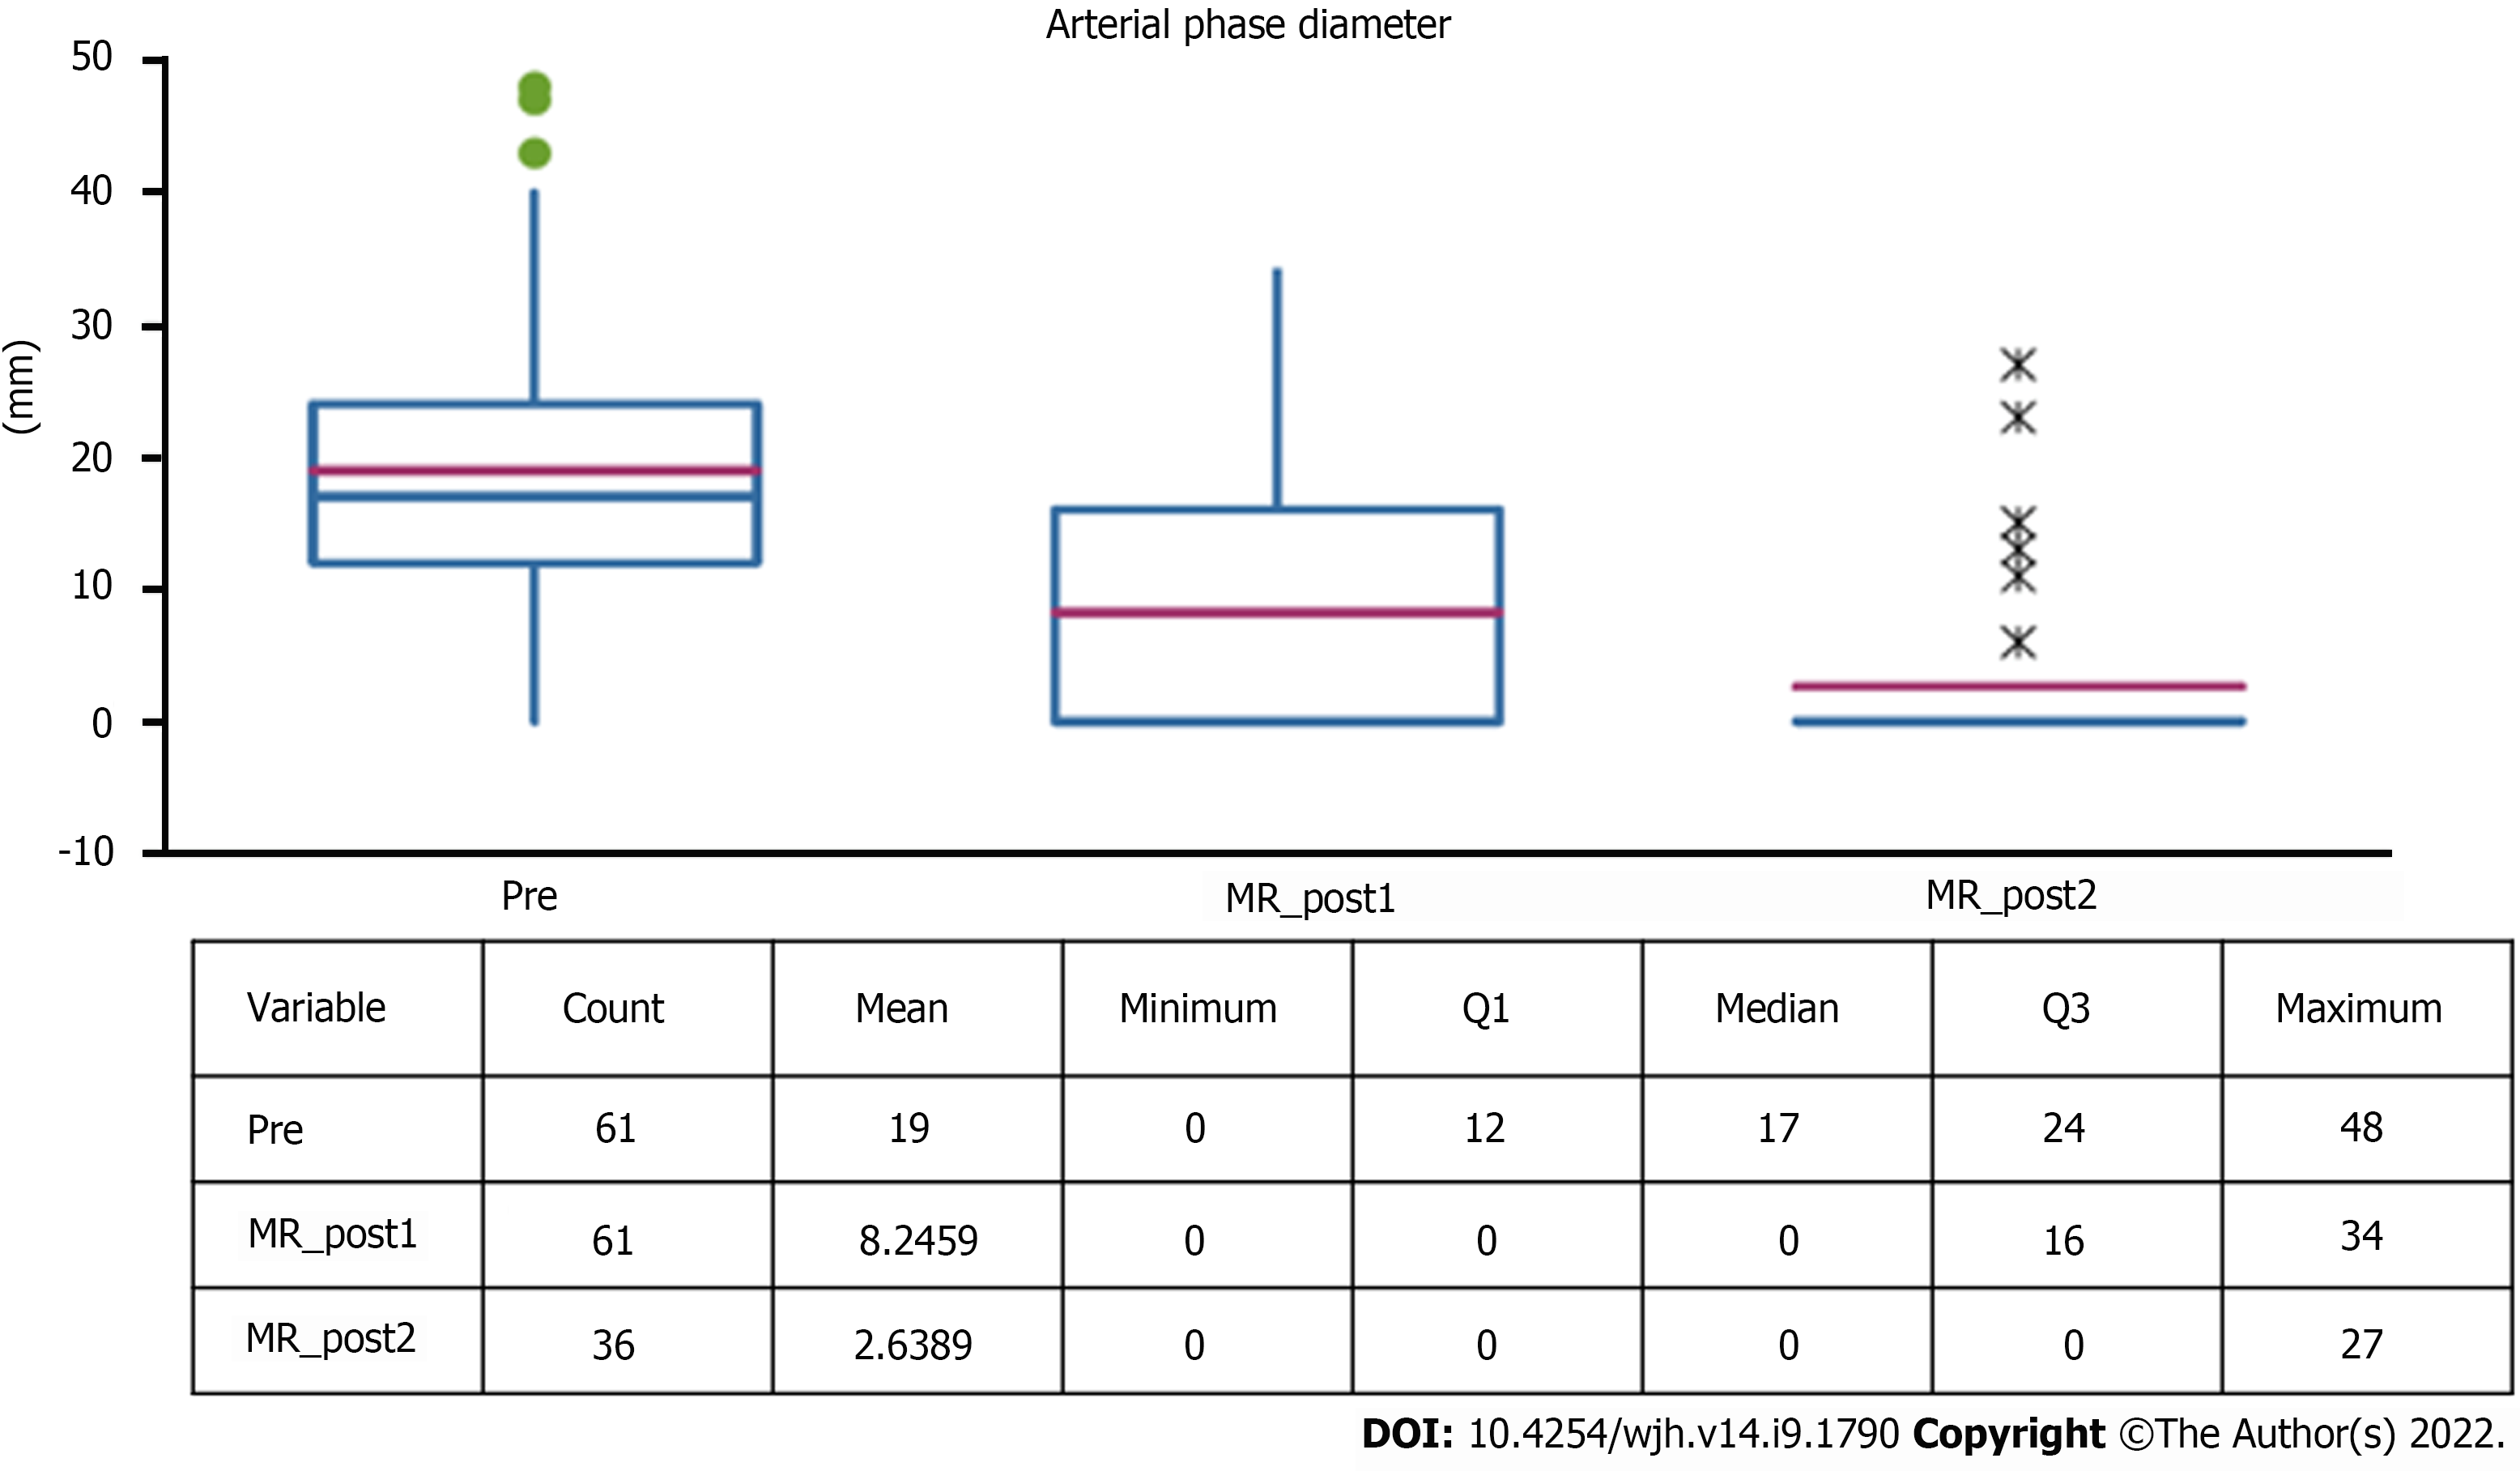
Figure 2 Tissue diameter with wash-in at pre-stereotactic body radiation therapy and follow-ups.
MR: Magnetic resonance.
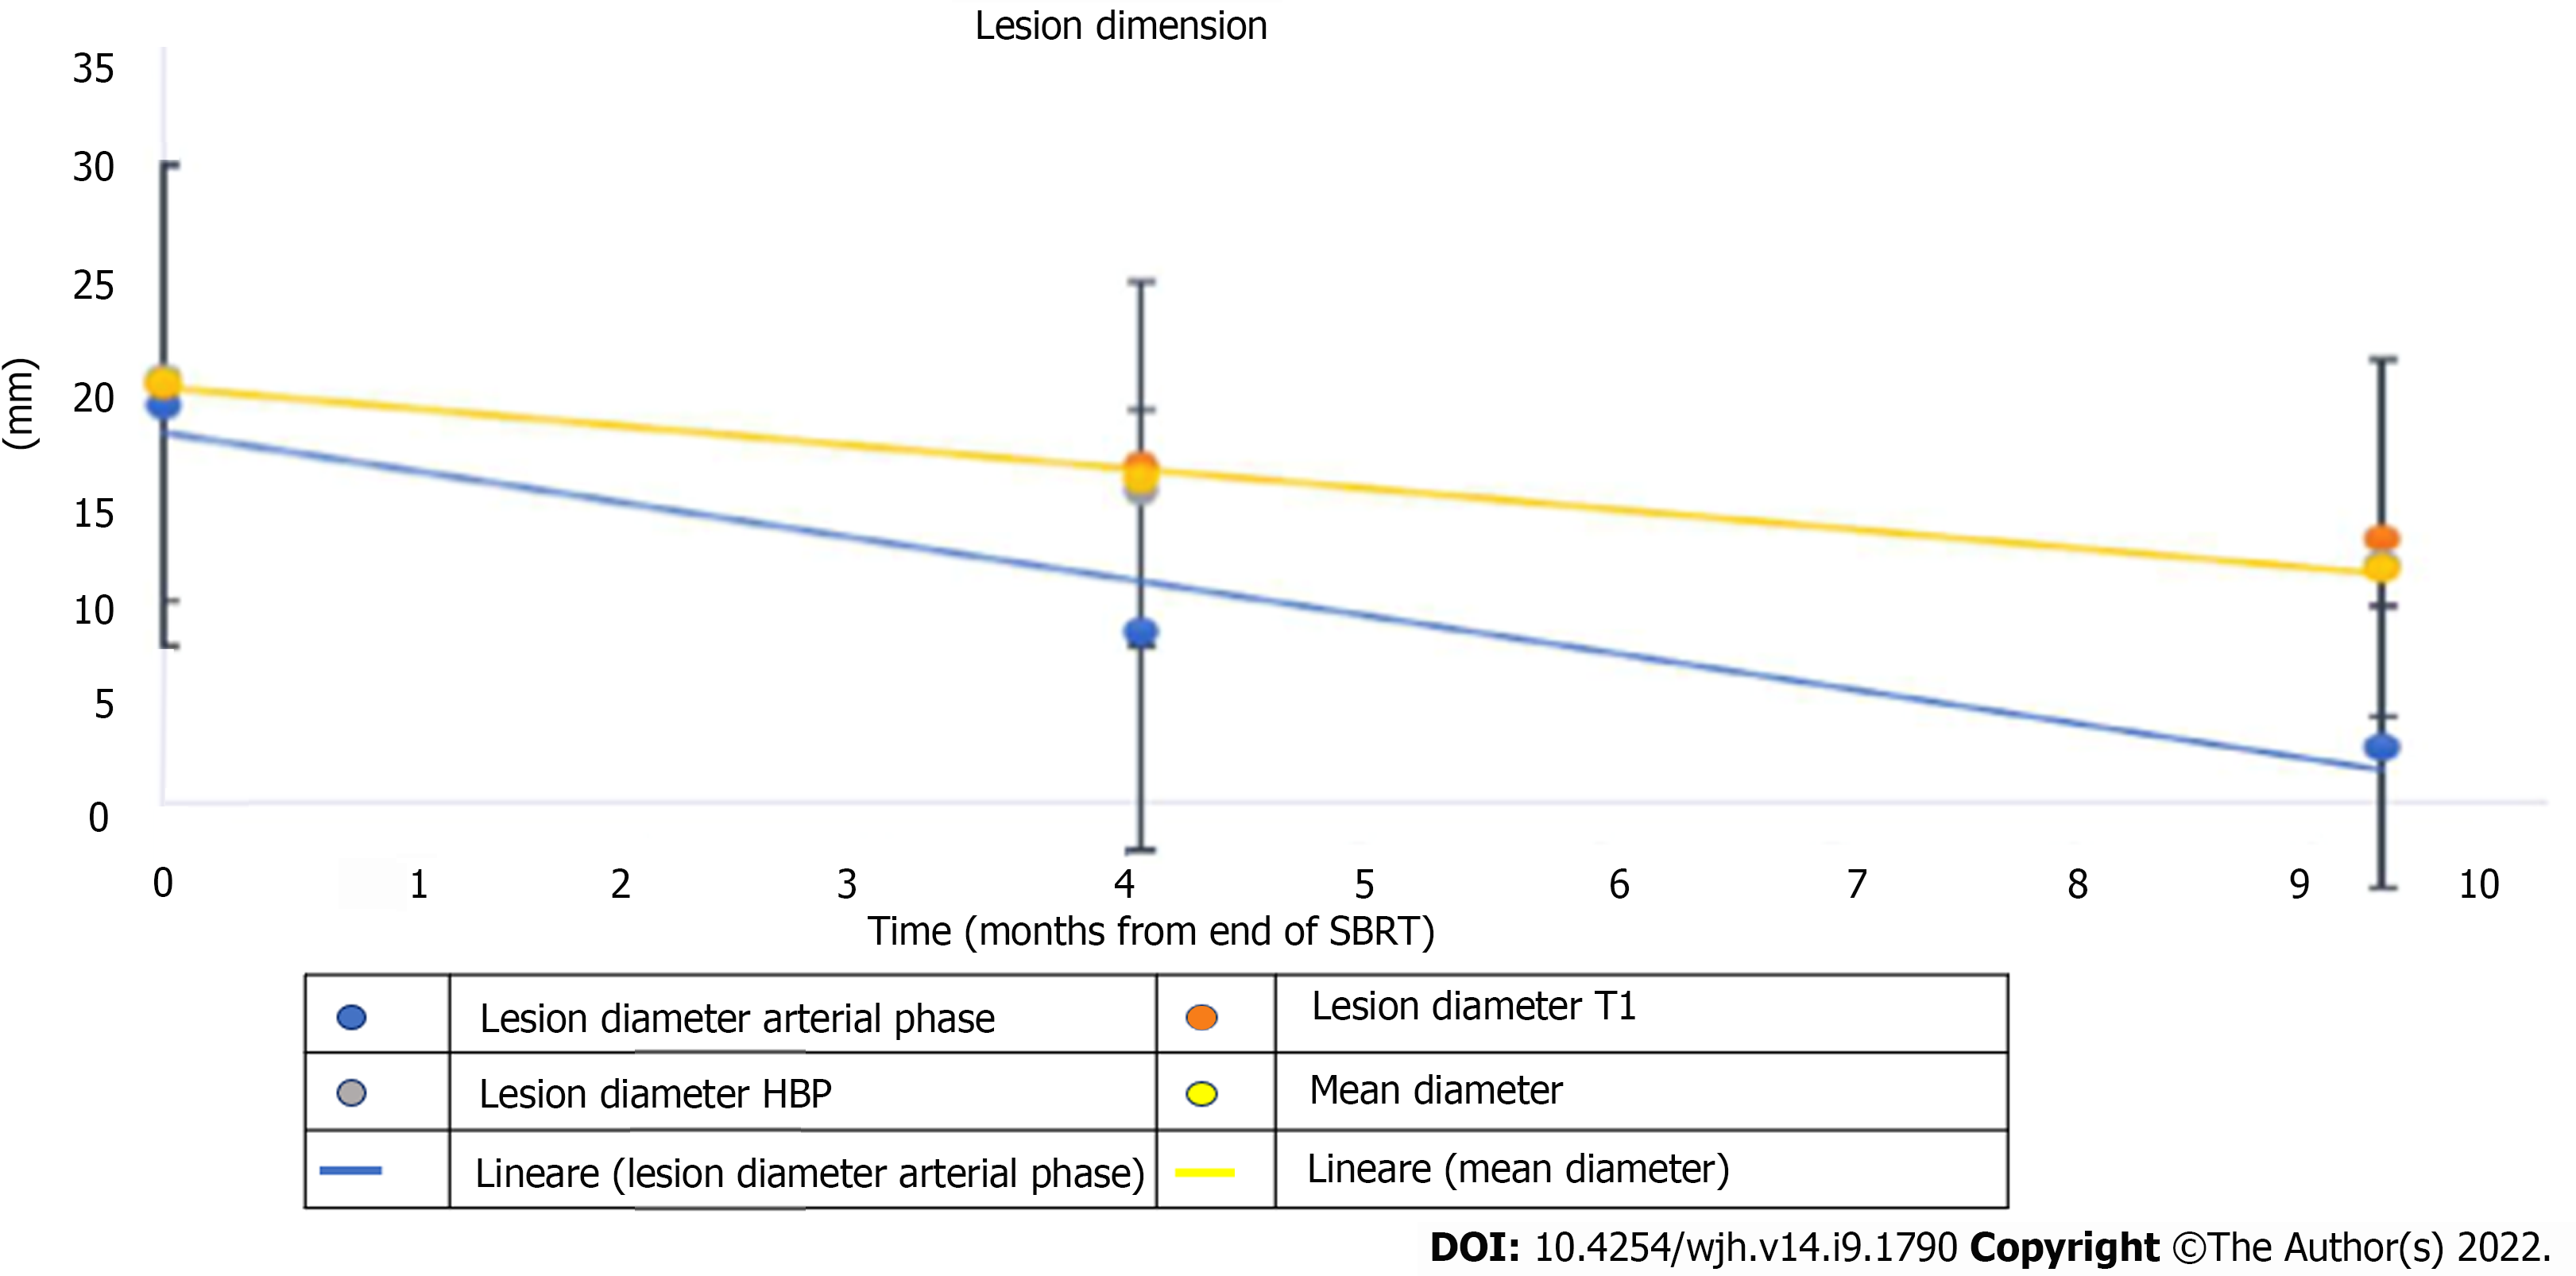
Figure 3 Variation in lesion diameters over time in basal, arterial, and hepatobiliary excretion phases.
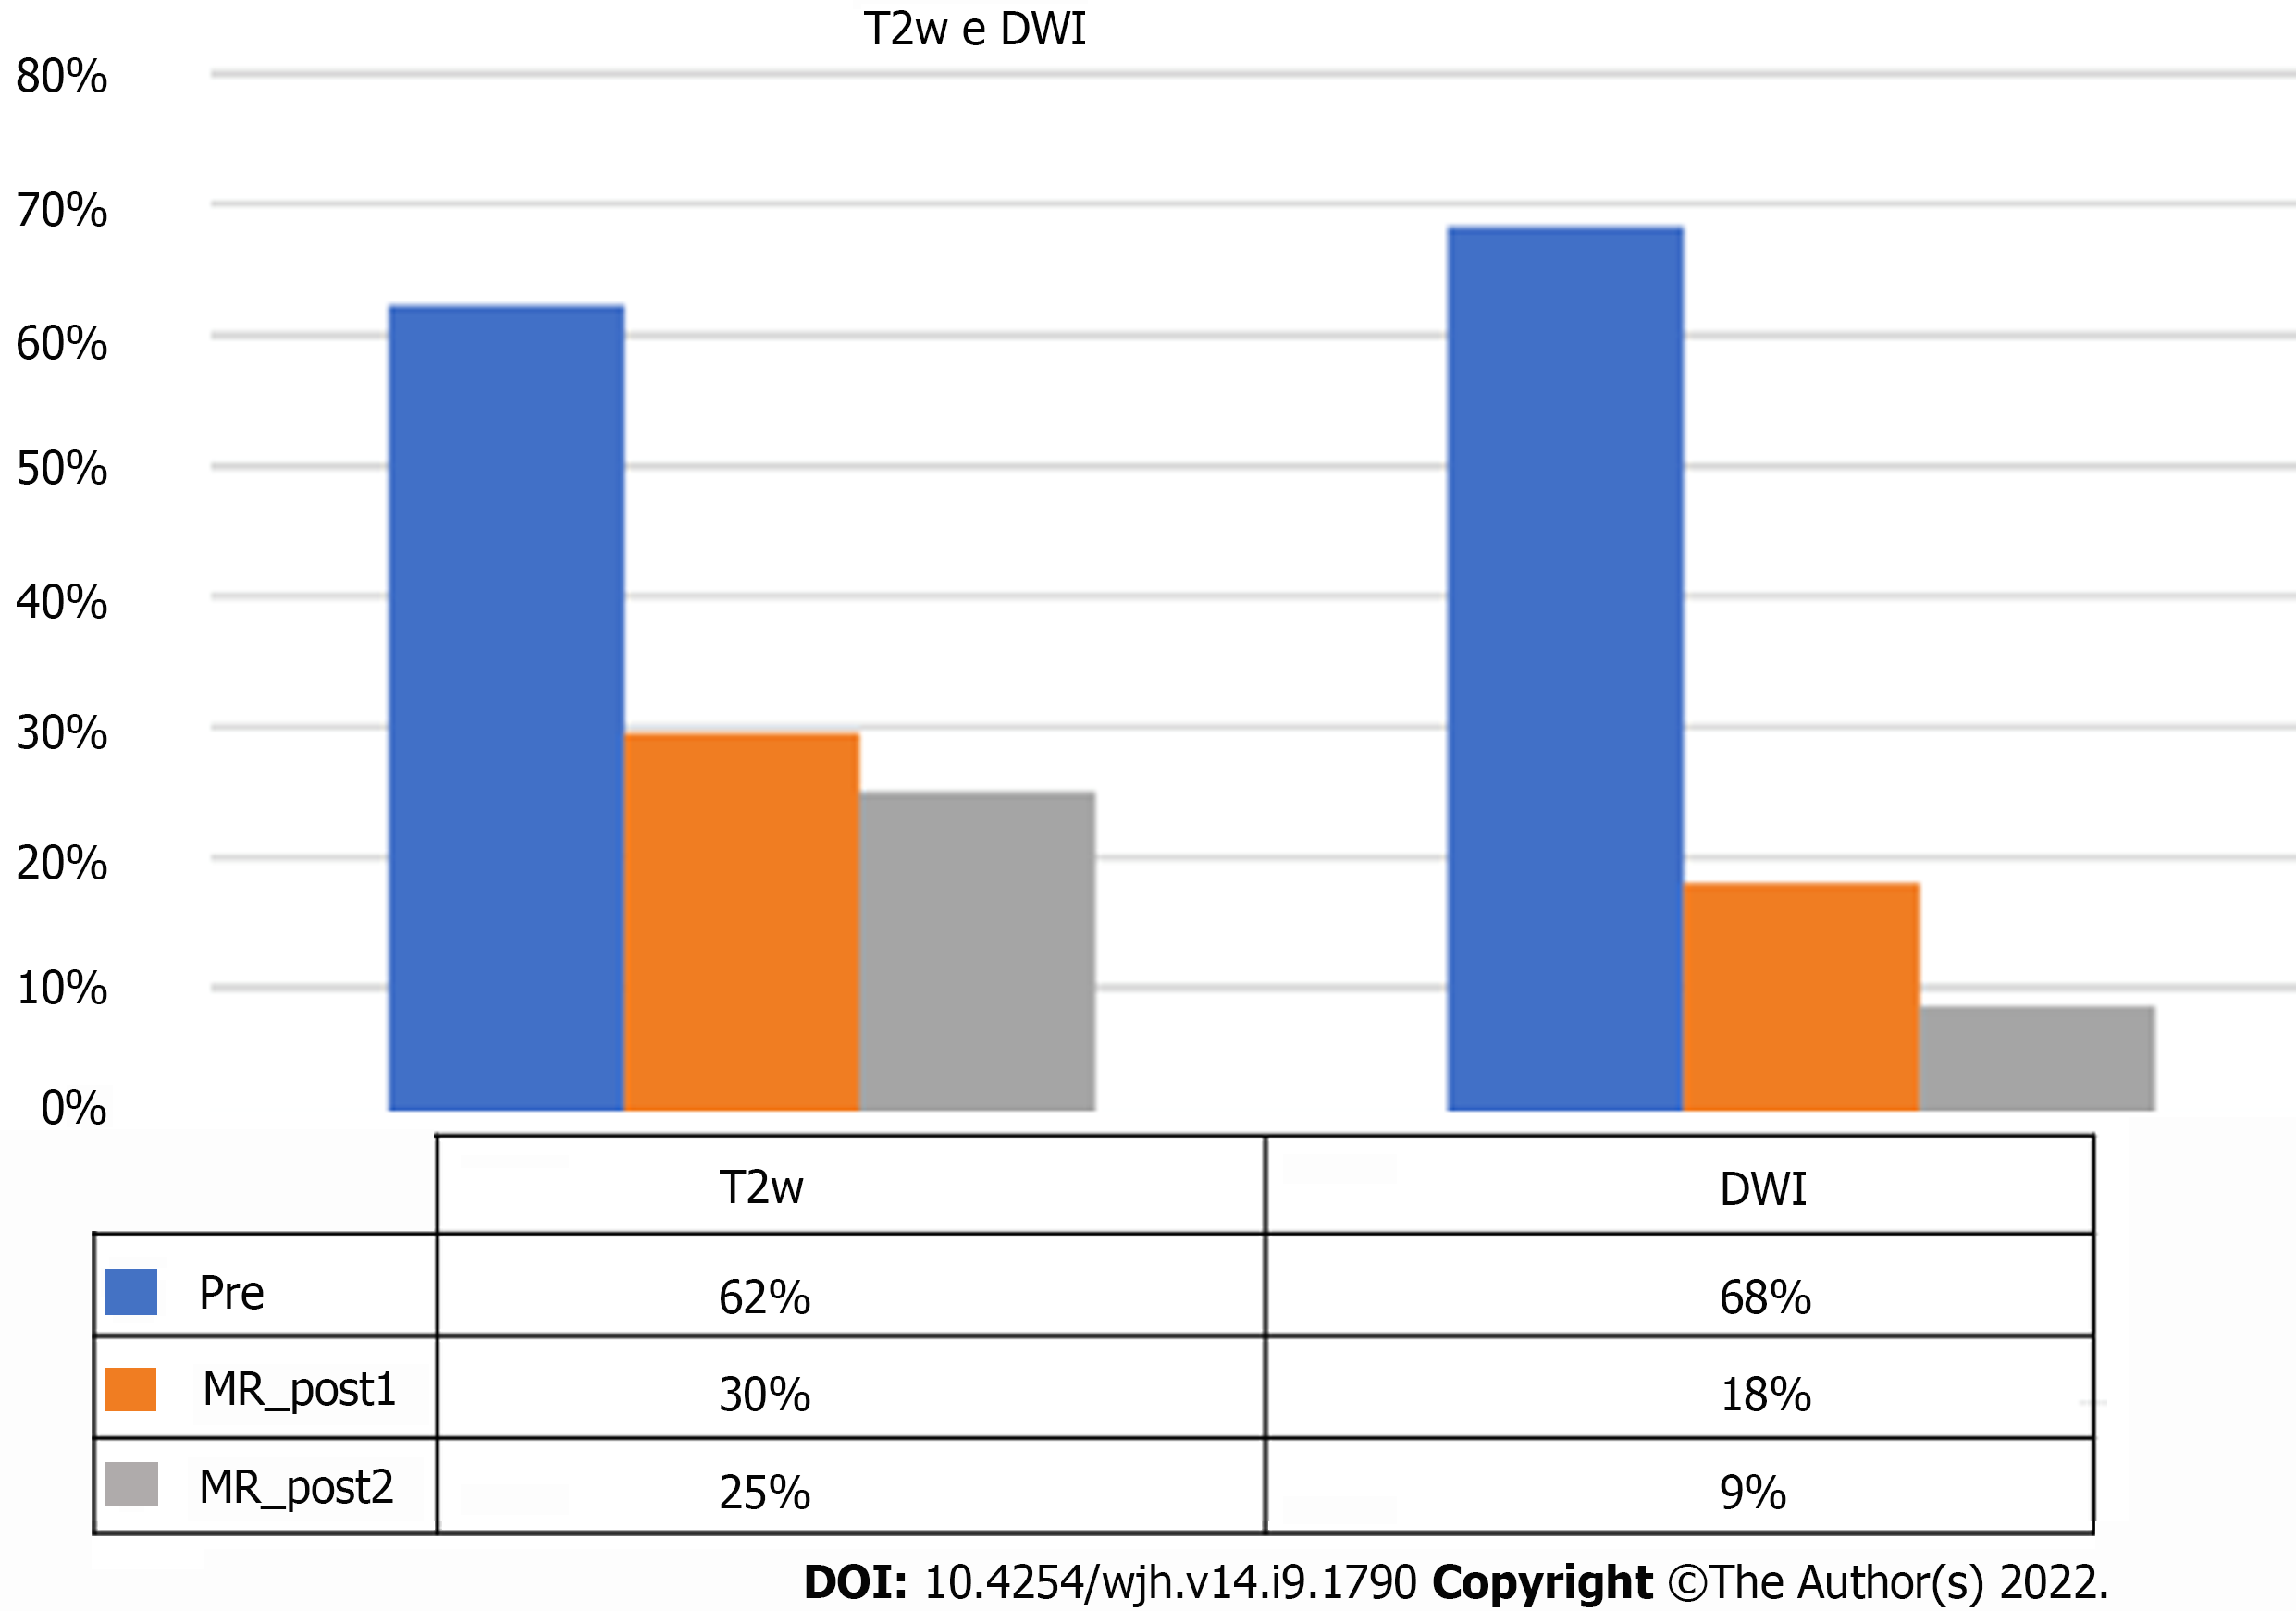
Figure 4 Frequency of signal hyperintensity in T2-weighted and diffusion-weighted imaging sequences.
MR: Magnetic resonance; DWI: Diffusion-weighted imaging.
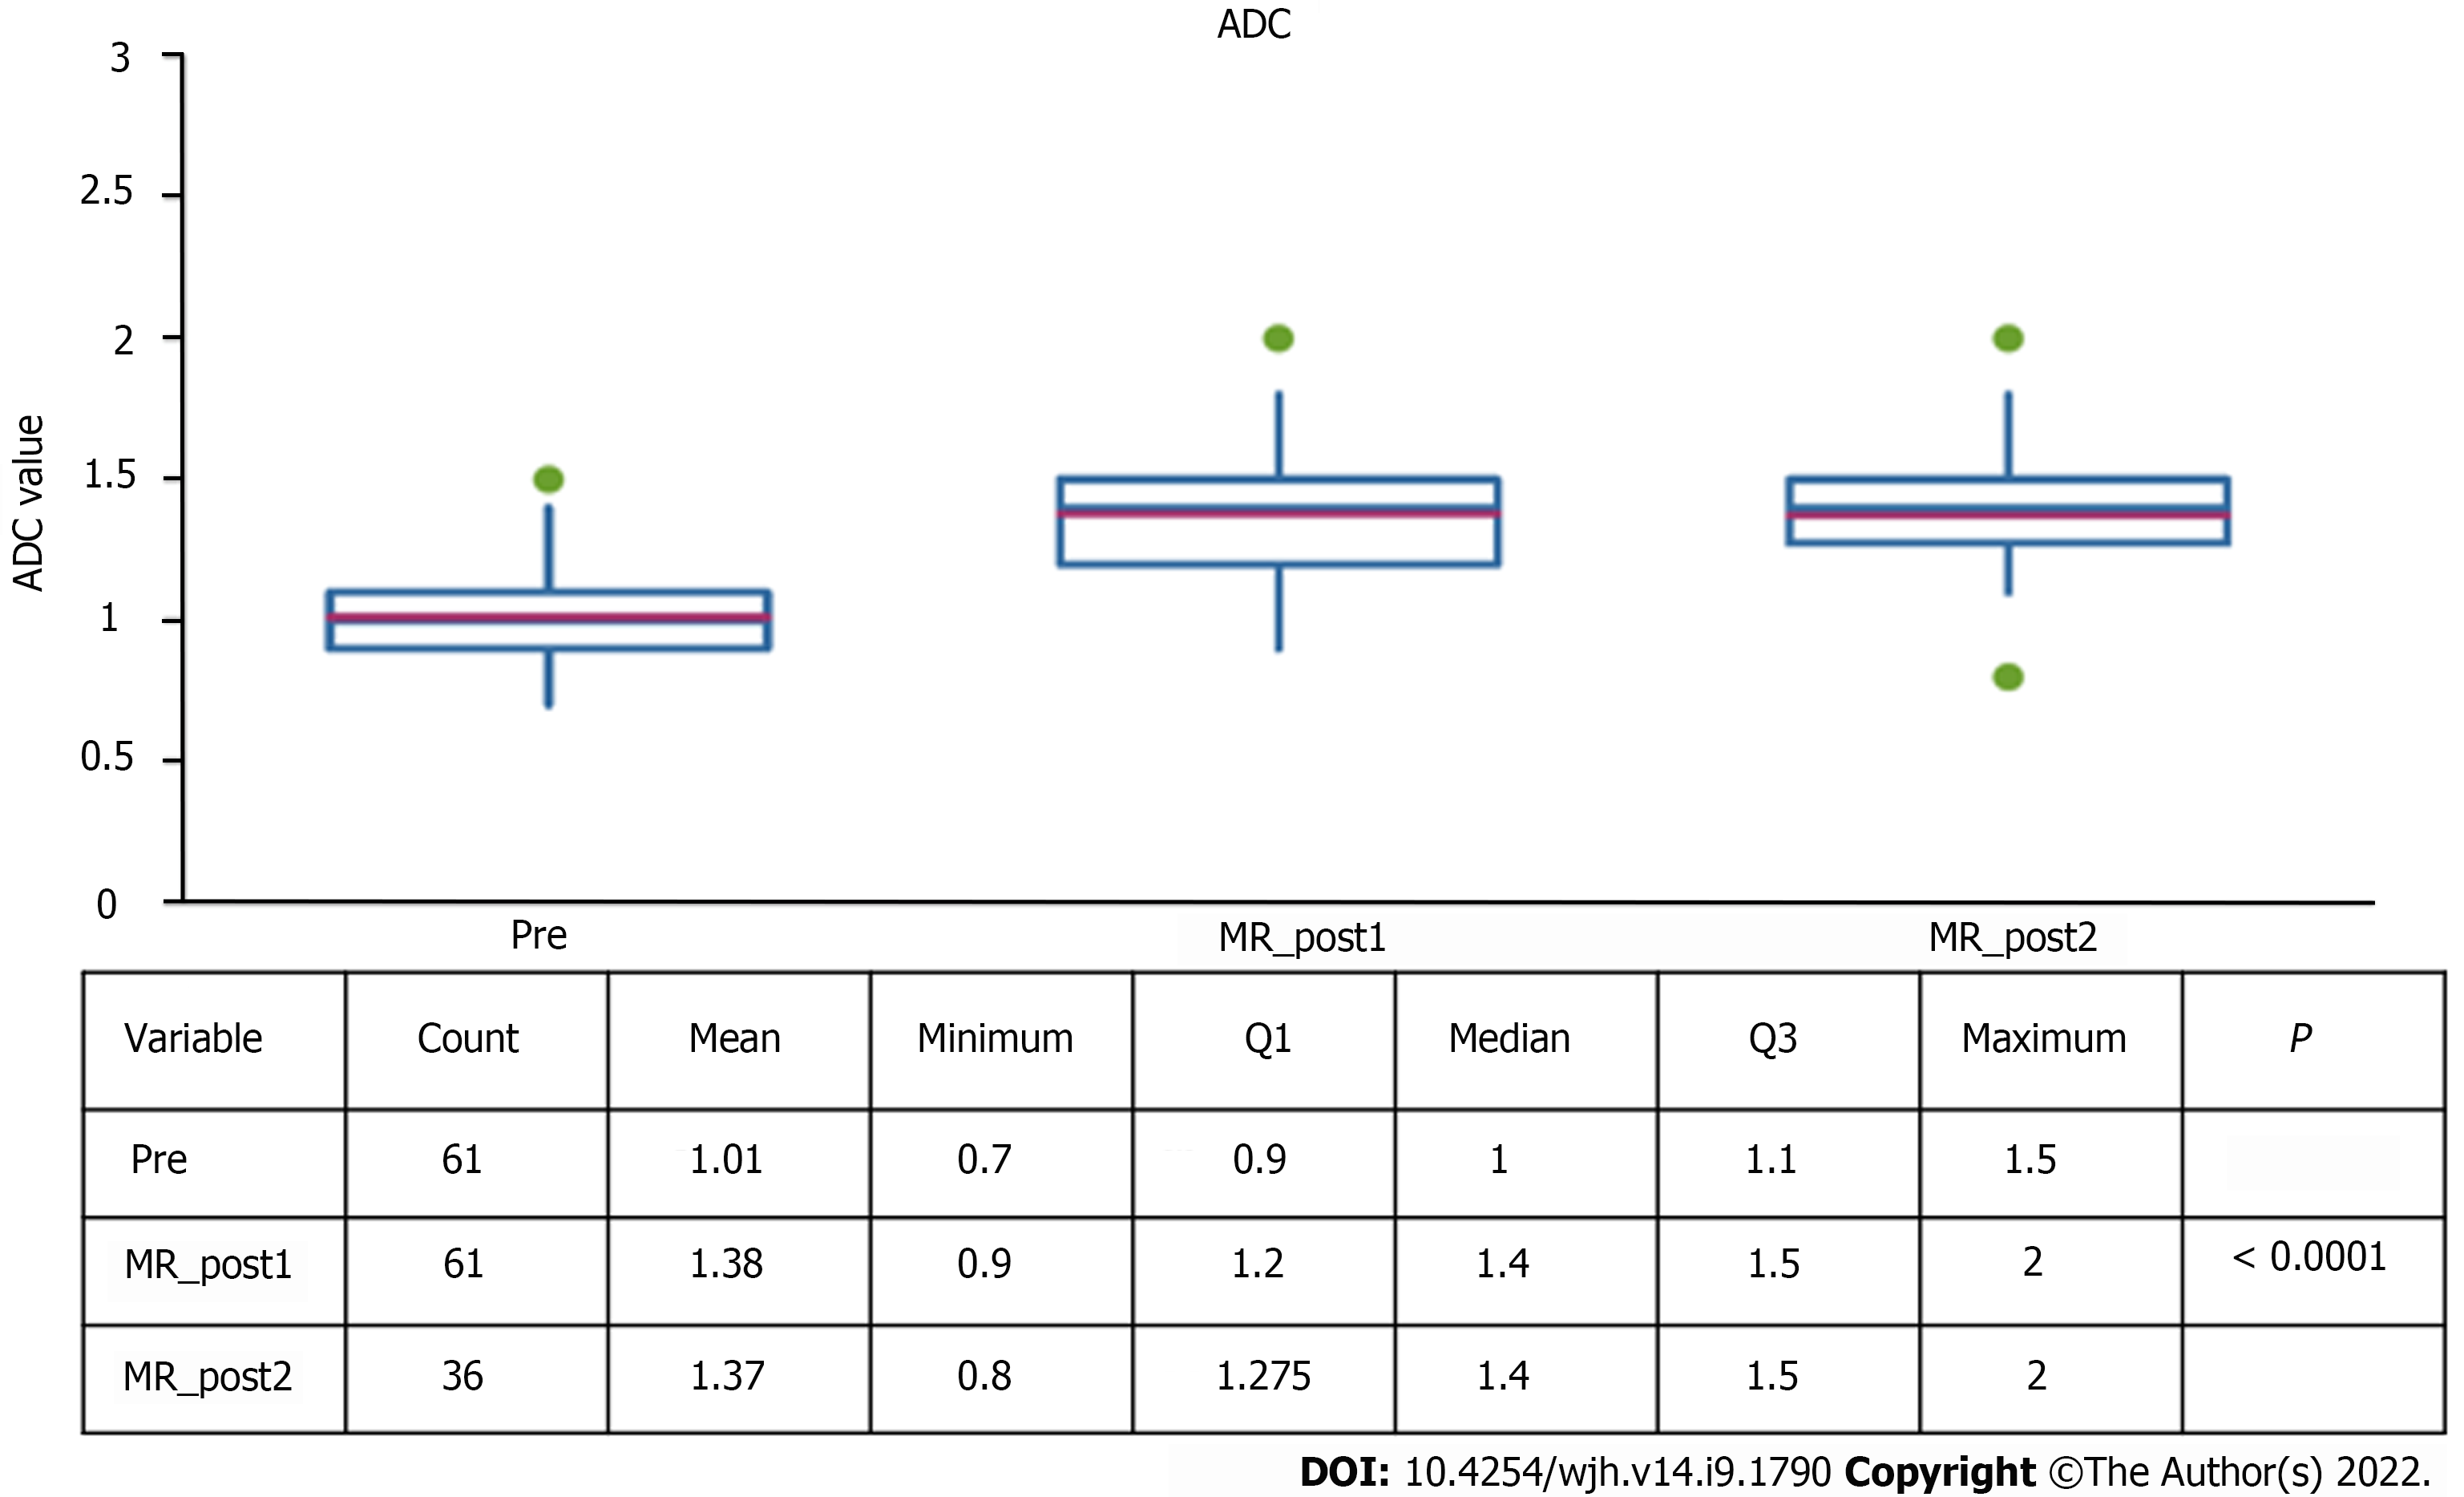
Figure 5 Apparent diffusion coefficient value at pre-stereotactic body radiation therapy and follow-ups.
MR: Magnetic resonance; ADC: Apparent diffusion coefficient.
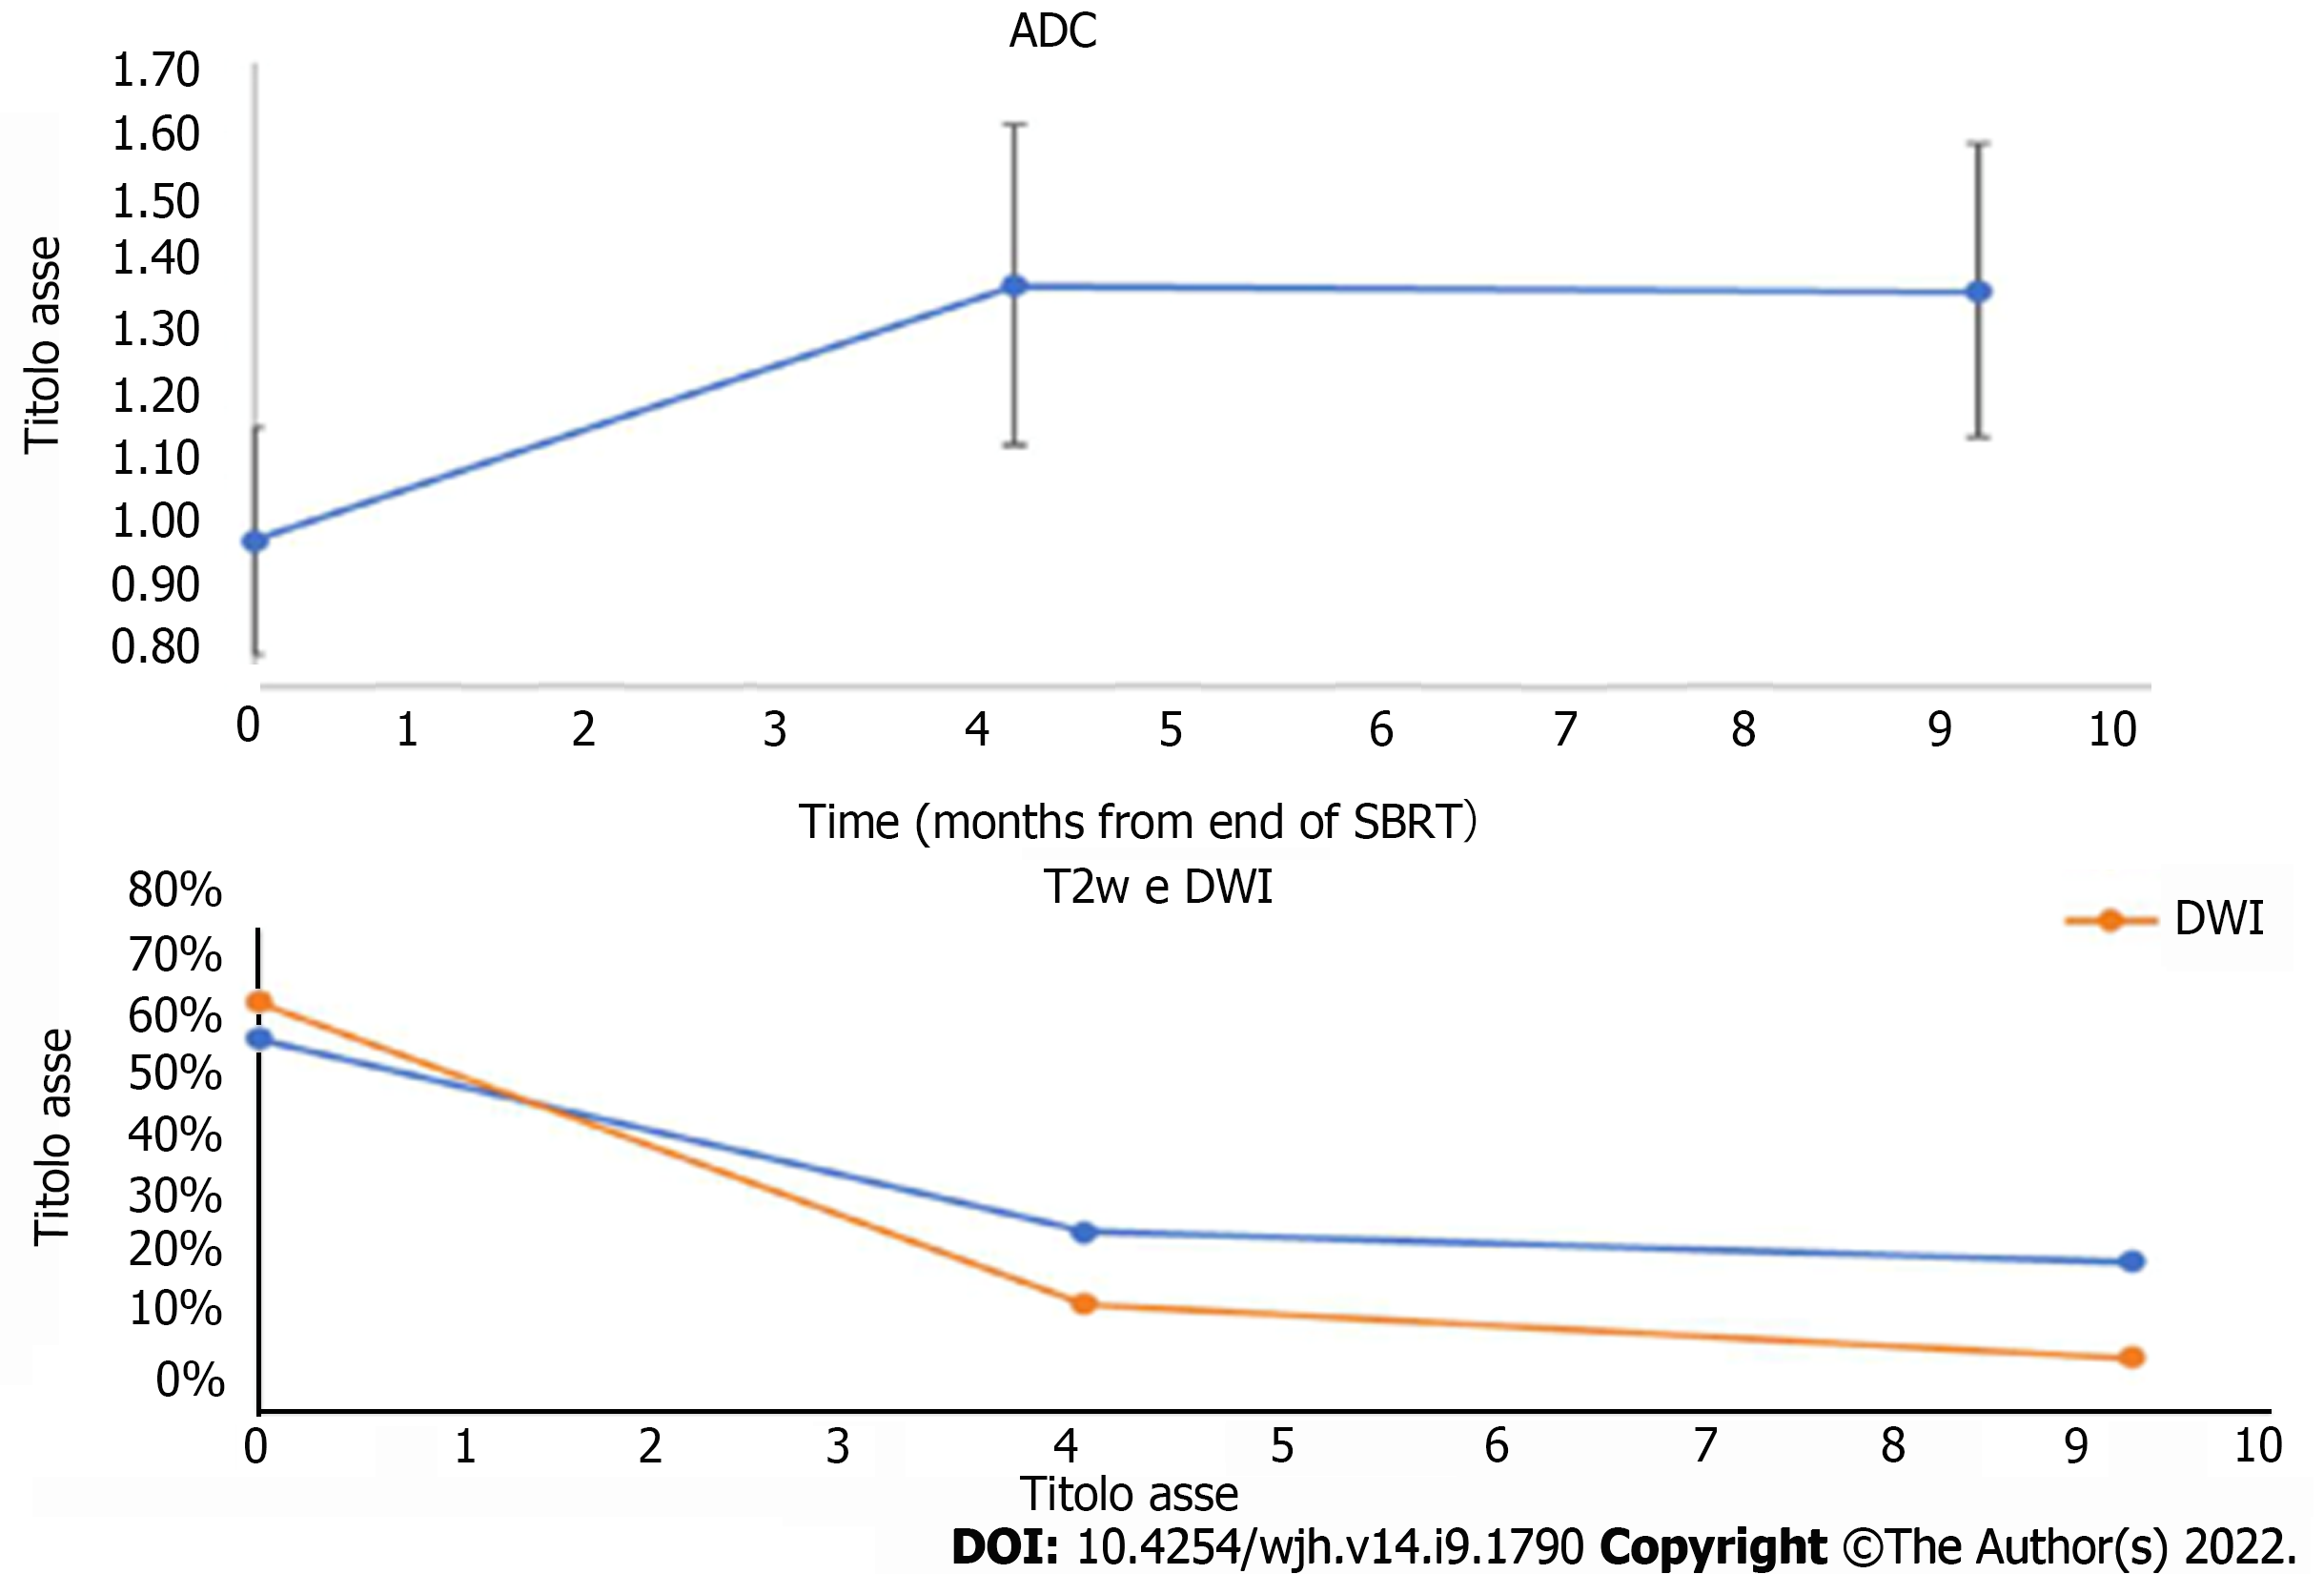
Figure 6 Comparison of changes in T2-weighted and diffusion-weighted imaging findings and apparent diffusion coefficient values over time.
ADC: Apparent diffusion coefficient; DWI: Diffusion-weighted imaging; T2W: T2-weighted; SBRT: Stereotactic body radiation therapy.
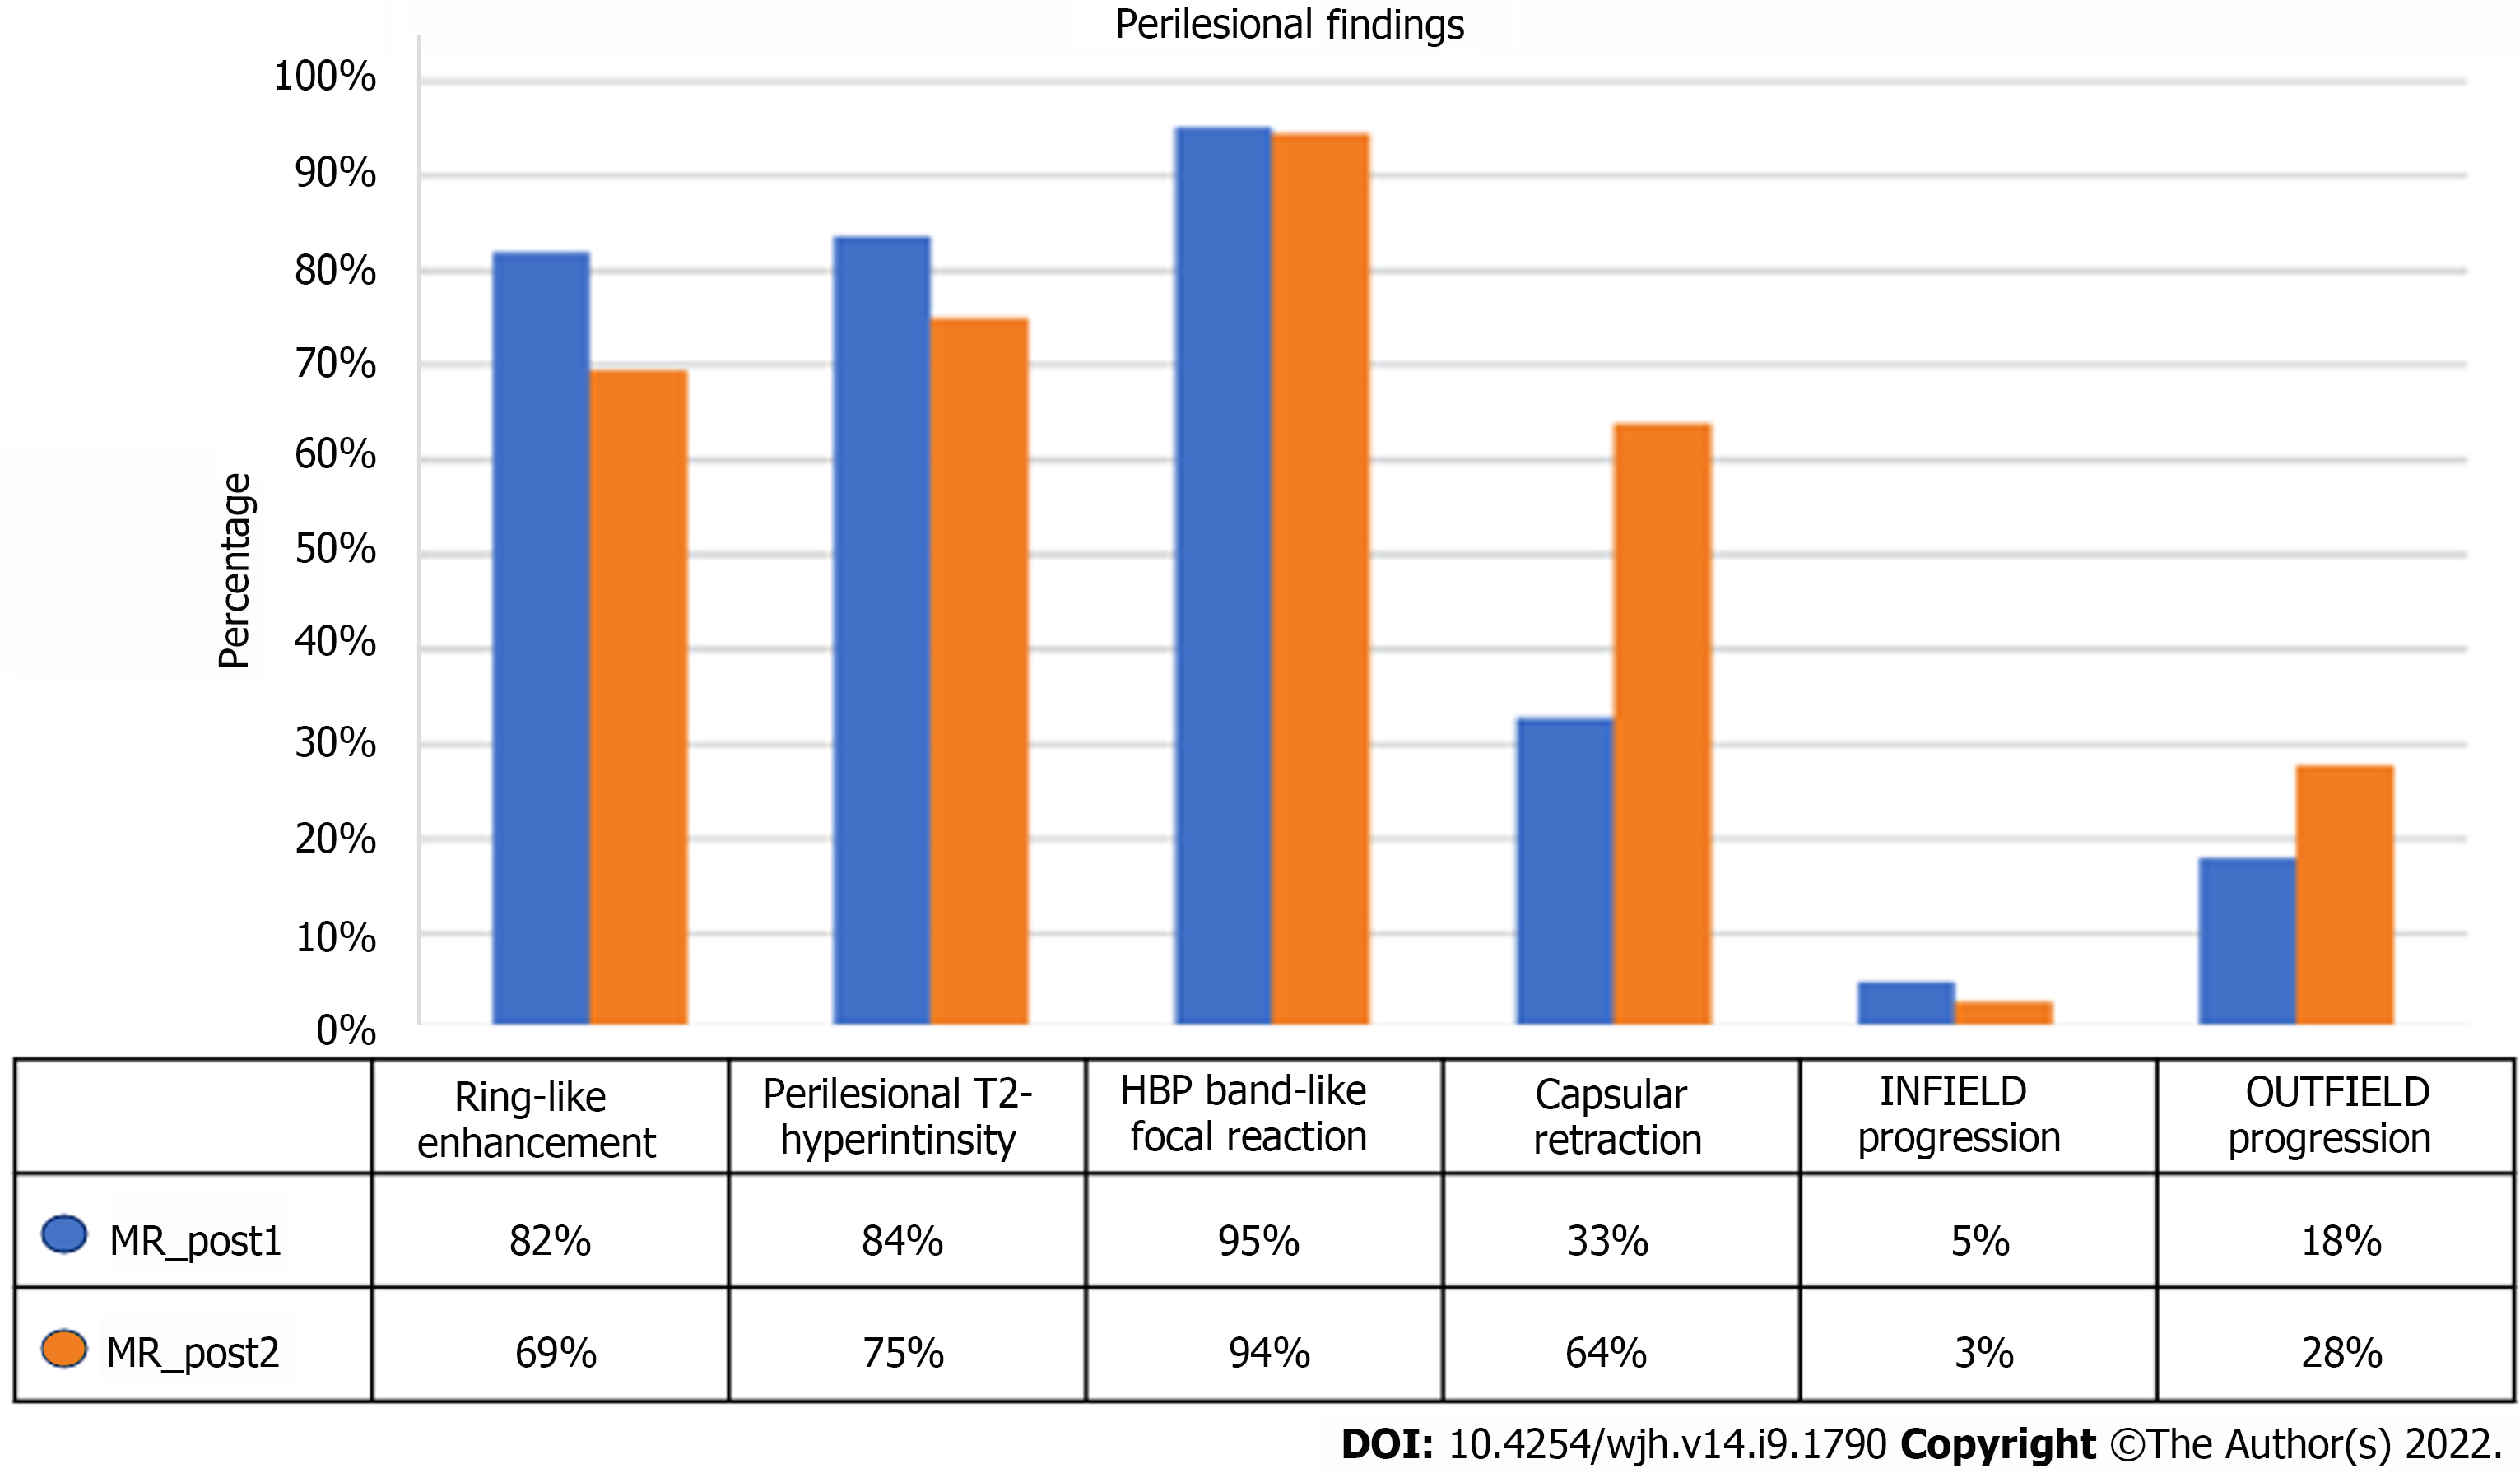
Figure 7 Frequency of perilesional parenchyma findings.
MR: Magnetic resonance; HBP: Hepatobiliary phase.
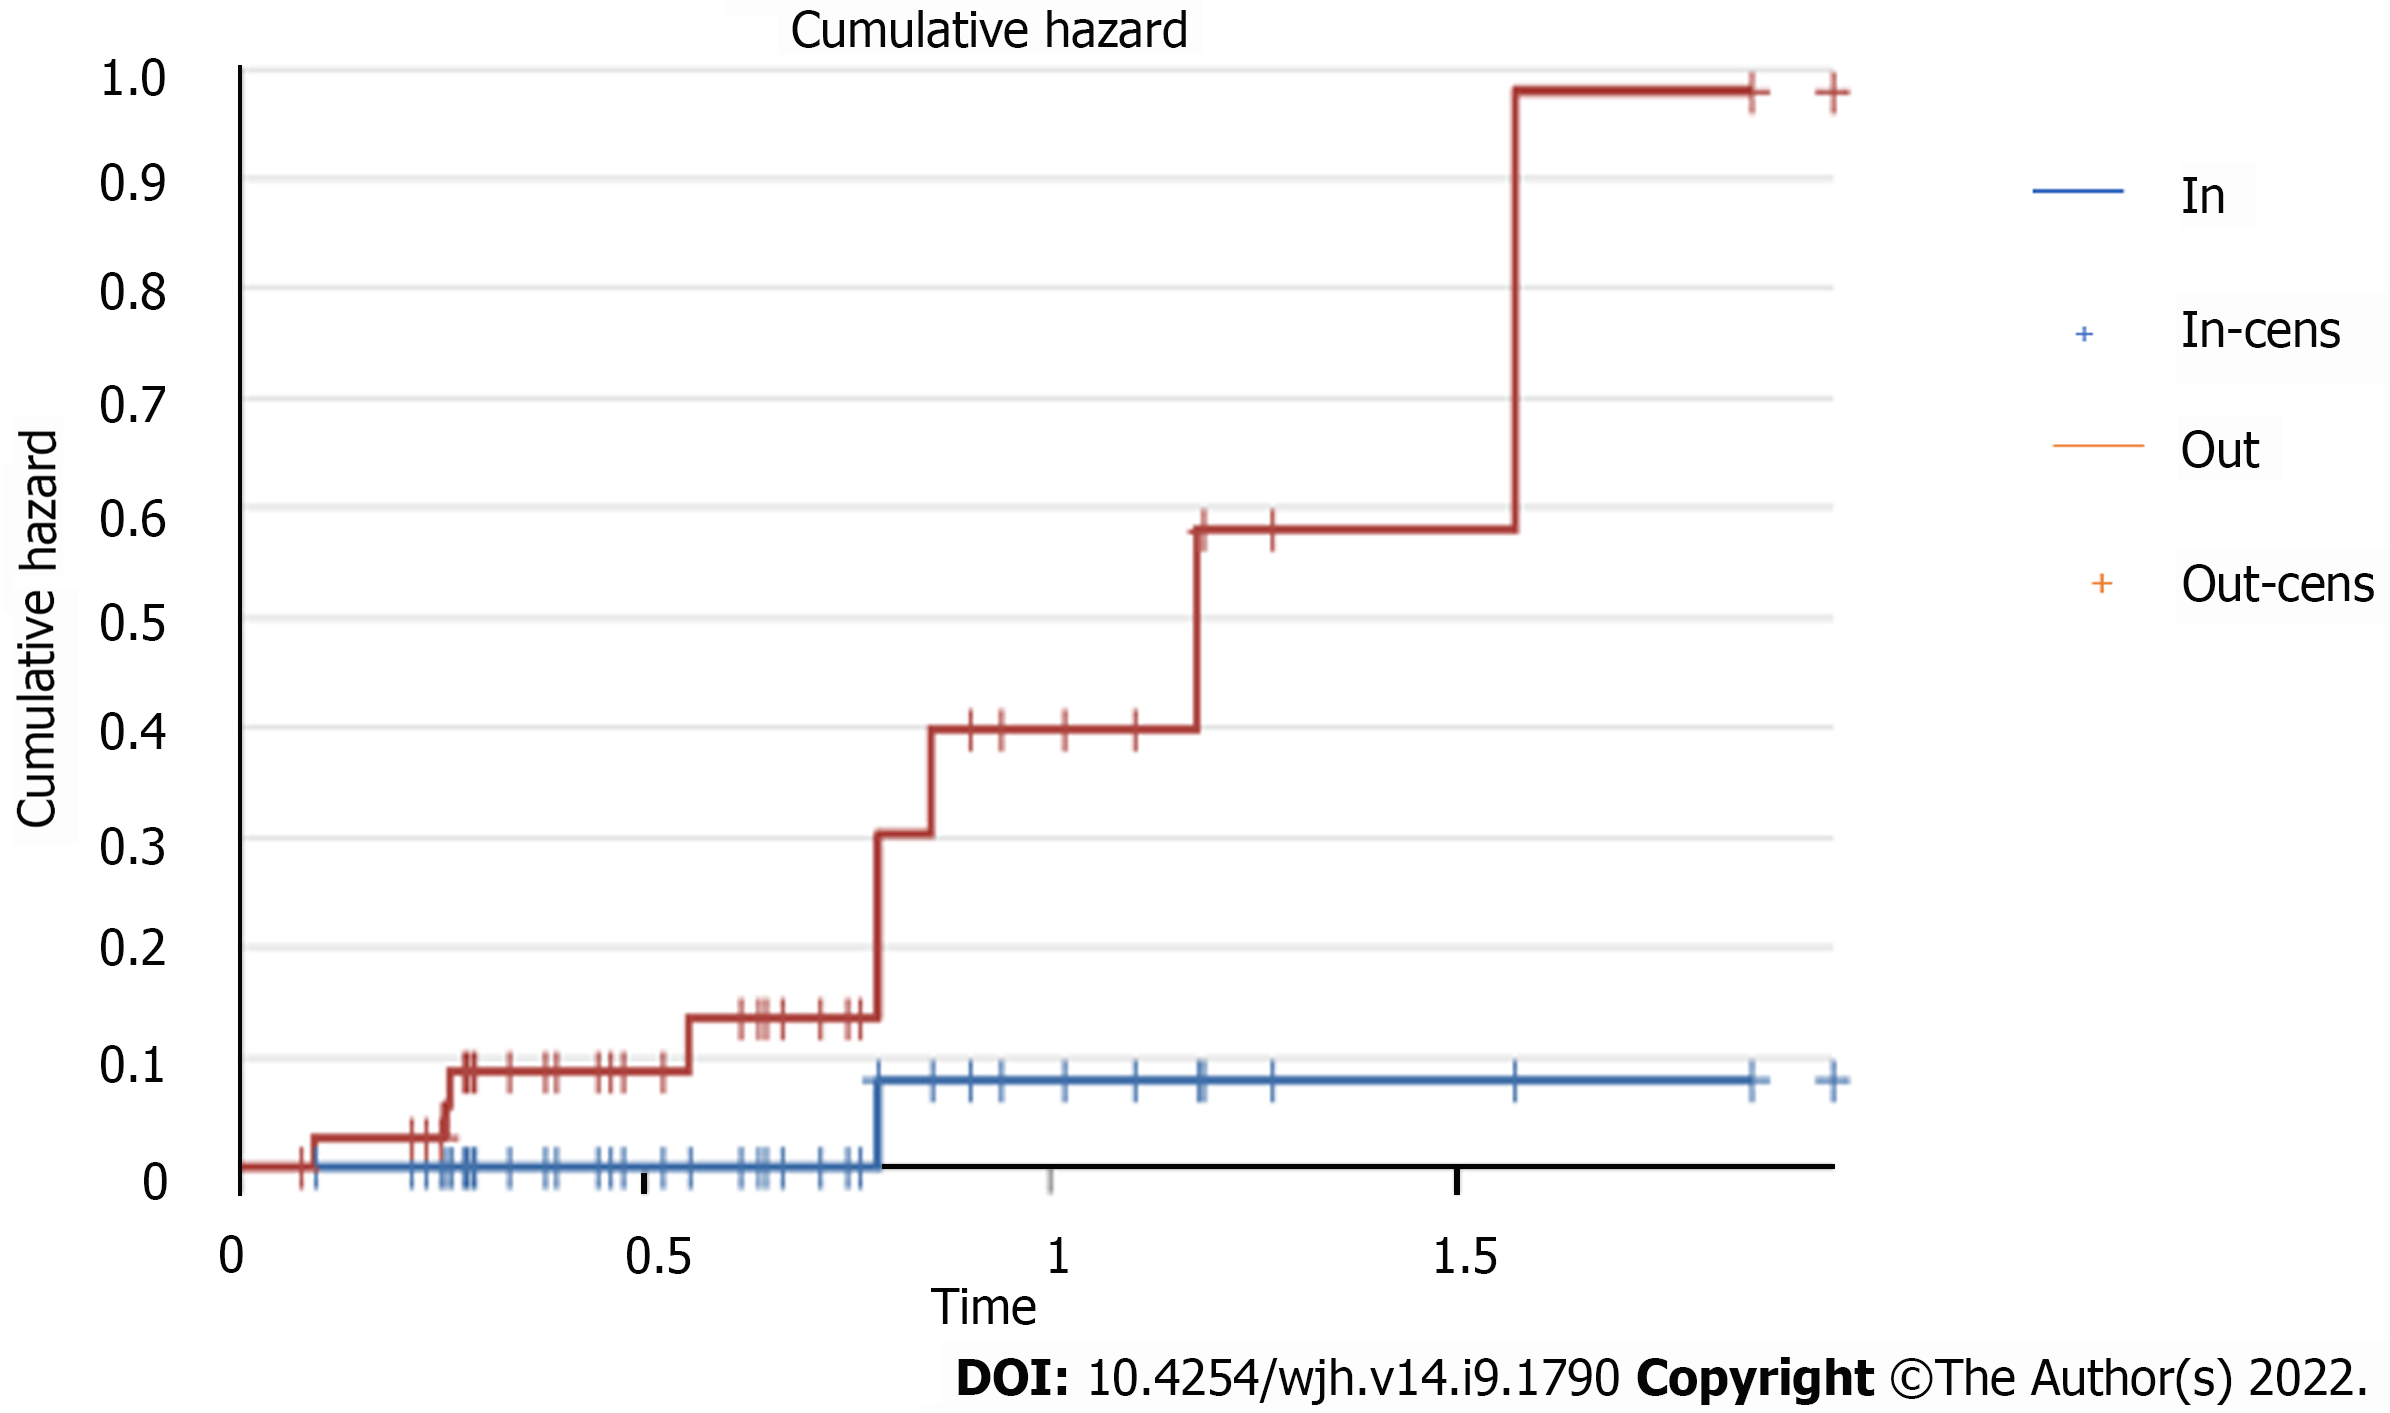
Figure 8
Risk of presenting infield and outfield progression over time.
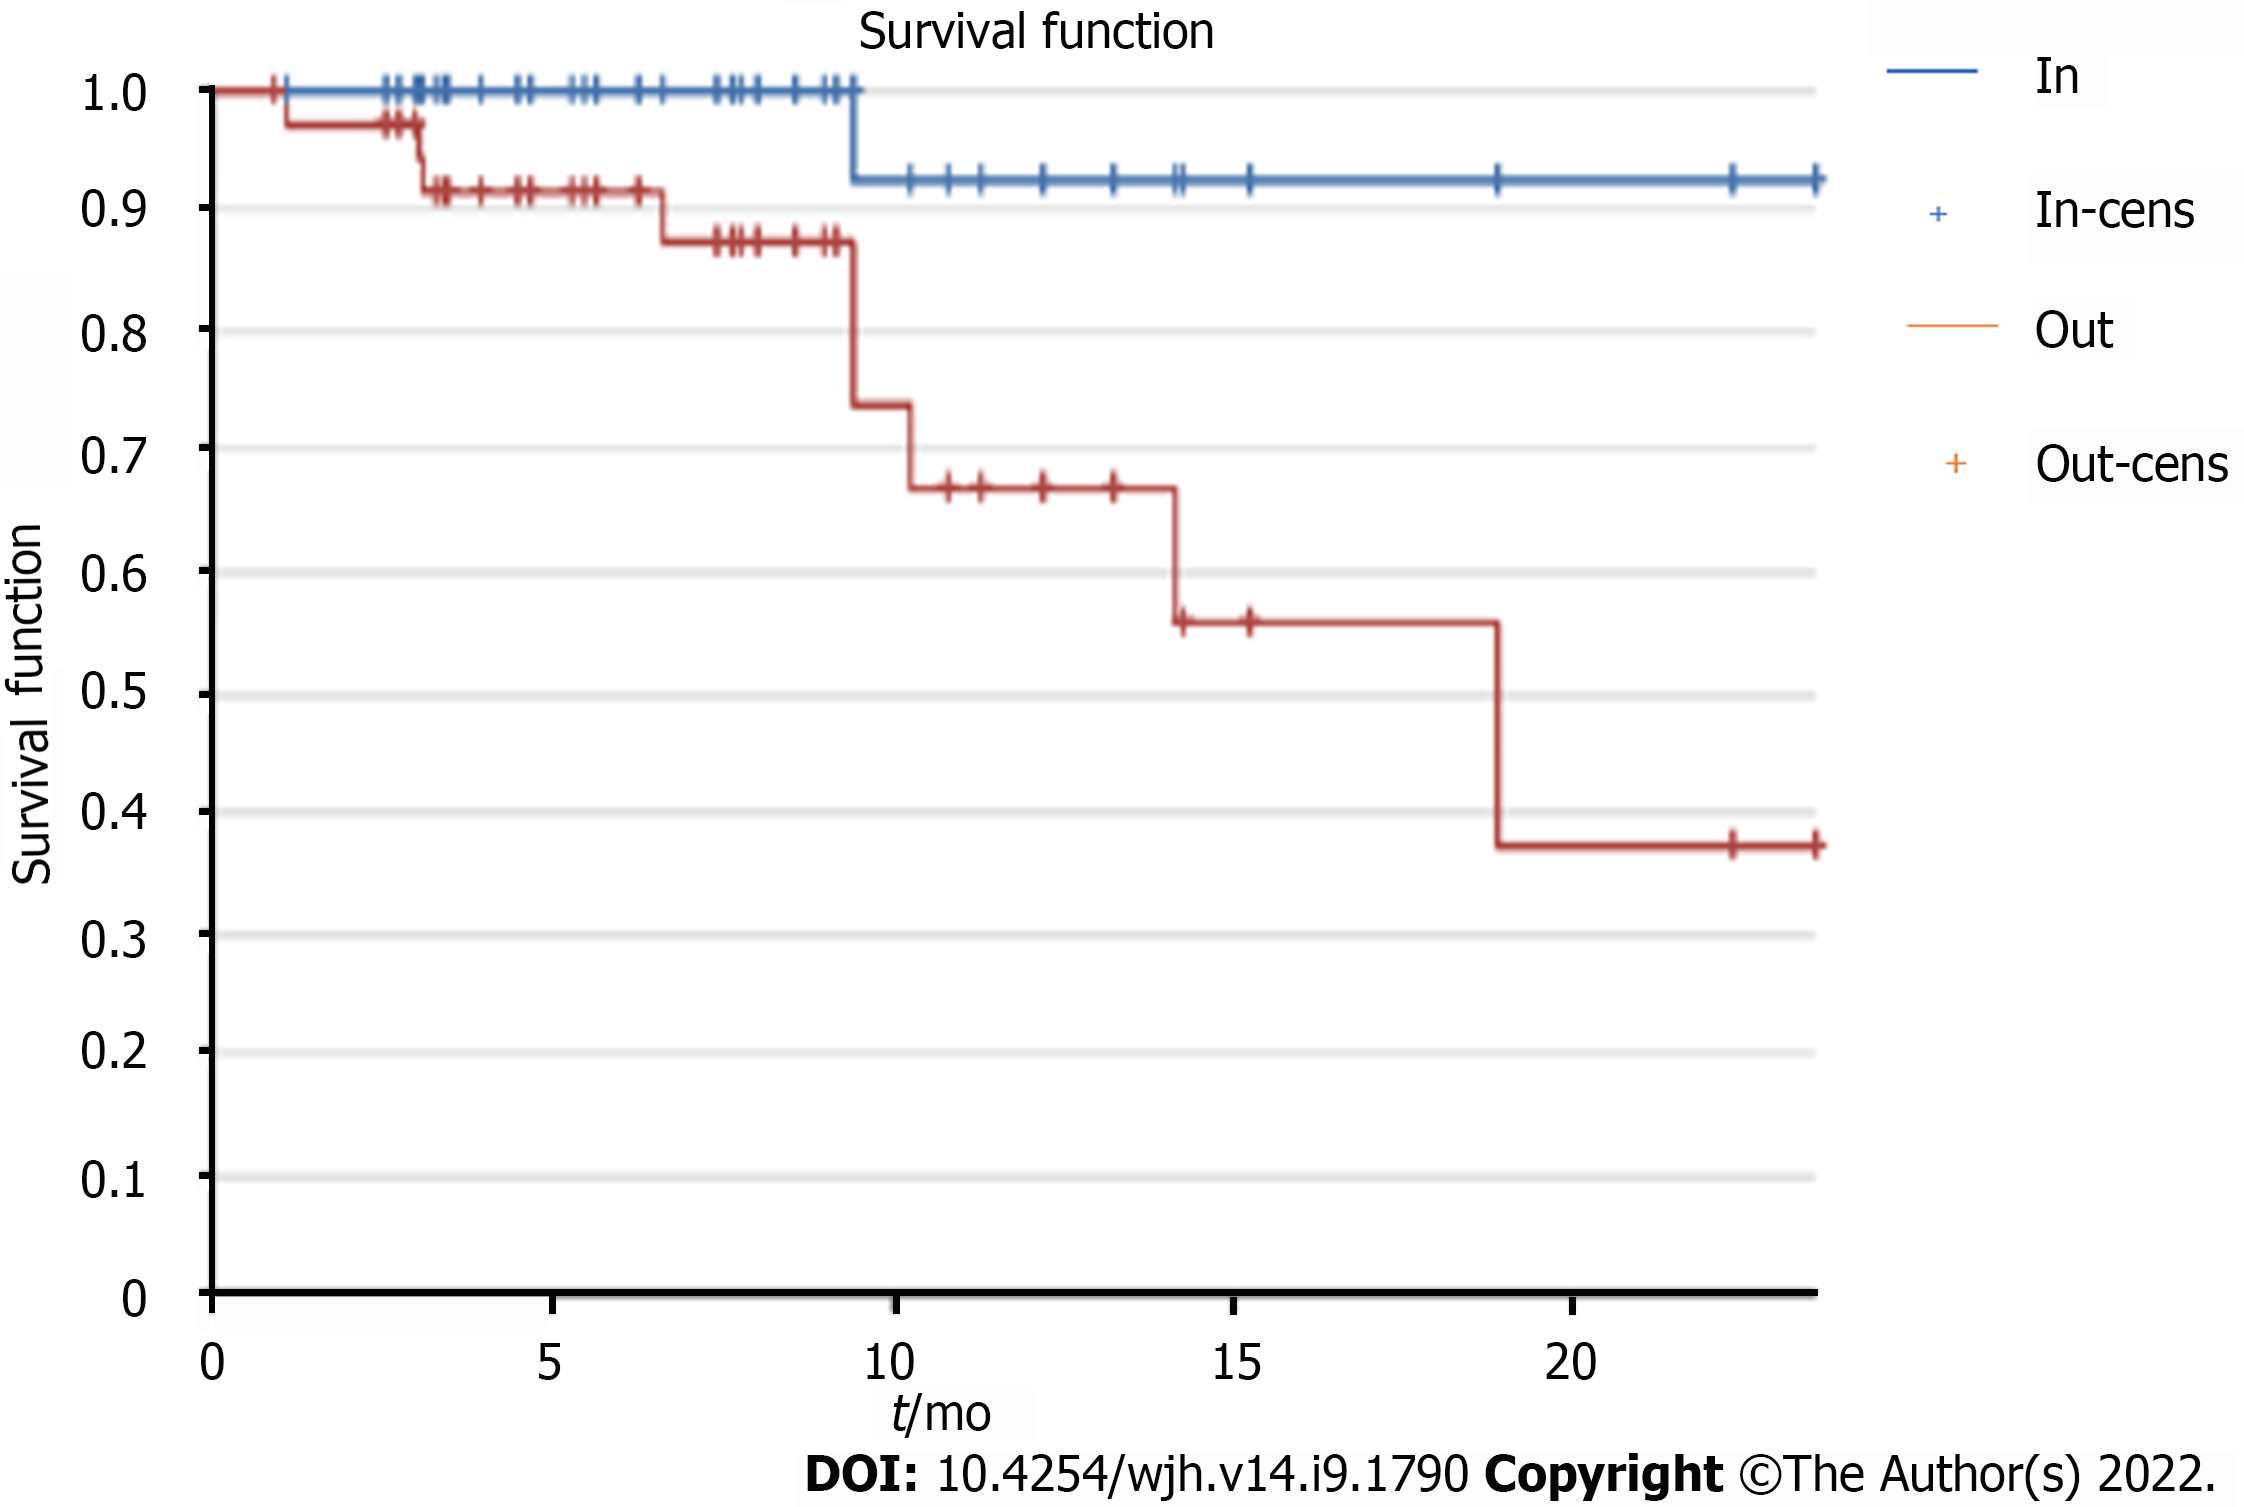
Figure 9
Infield and outfield progression and impact on survival.
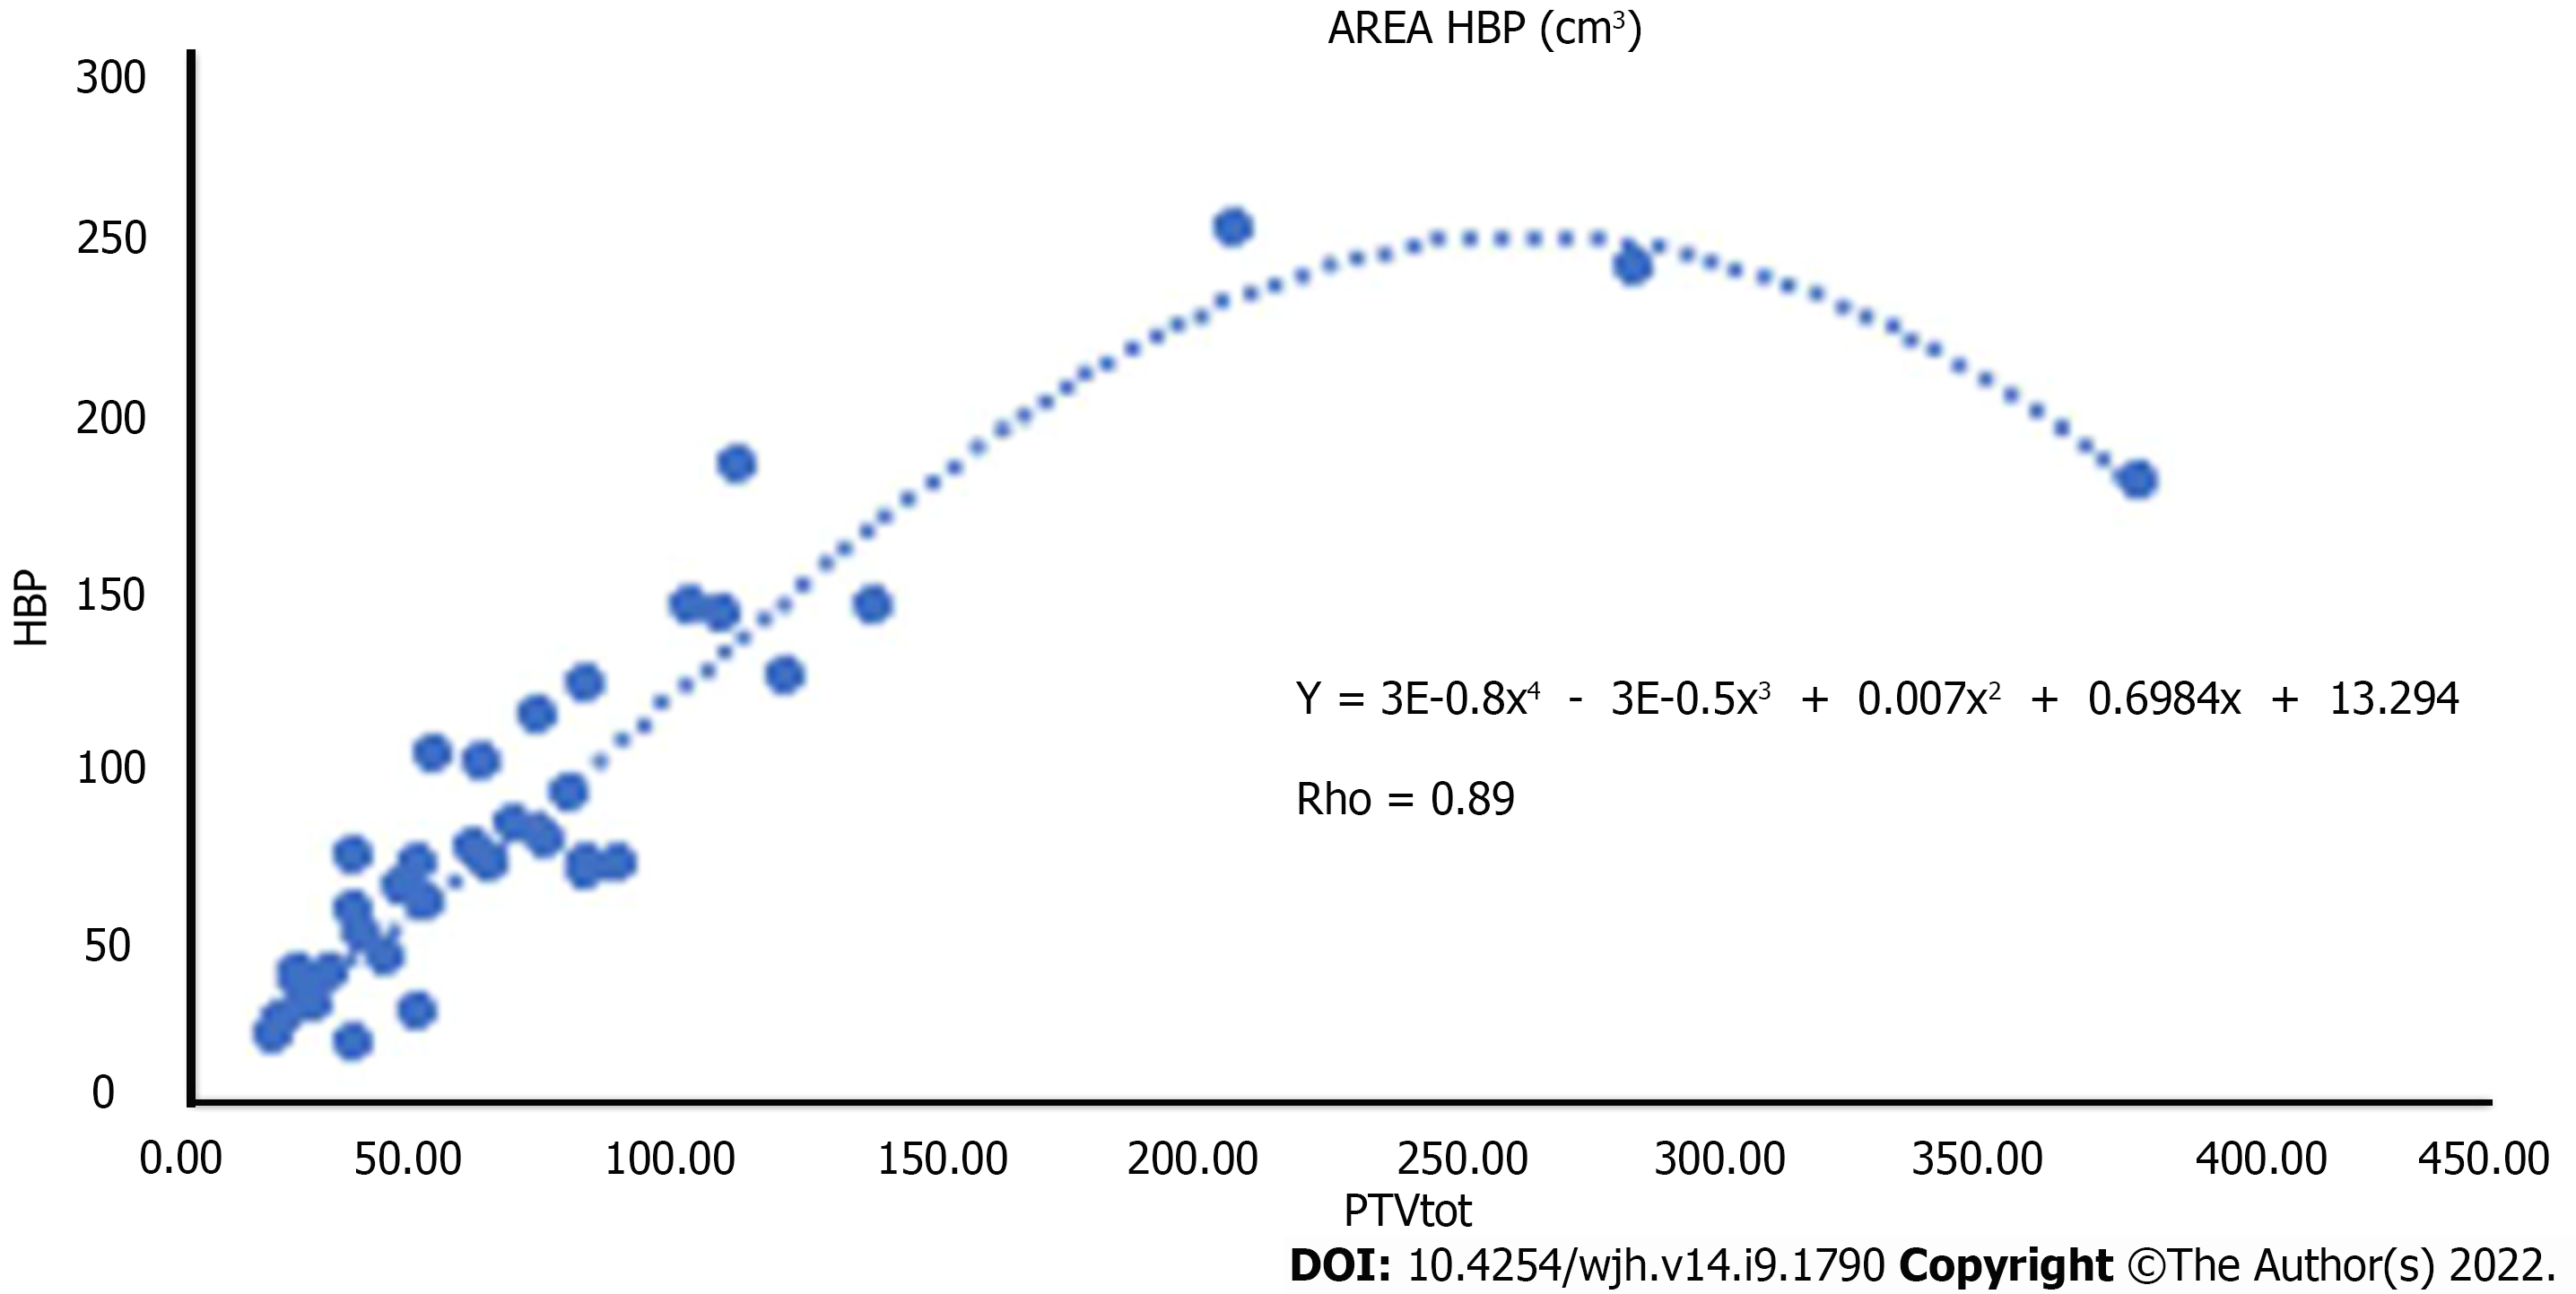
Figure 10 Relationship between hepatobiliary phase hypointensity area and planning target volume.
HBP: Hepatobiliary phase.
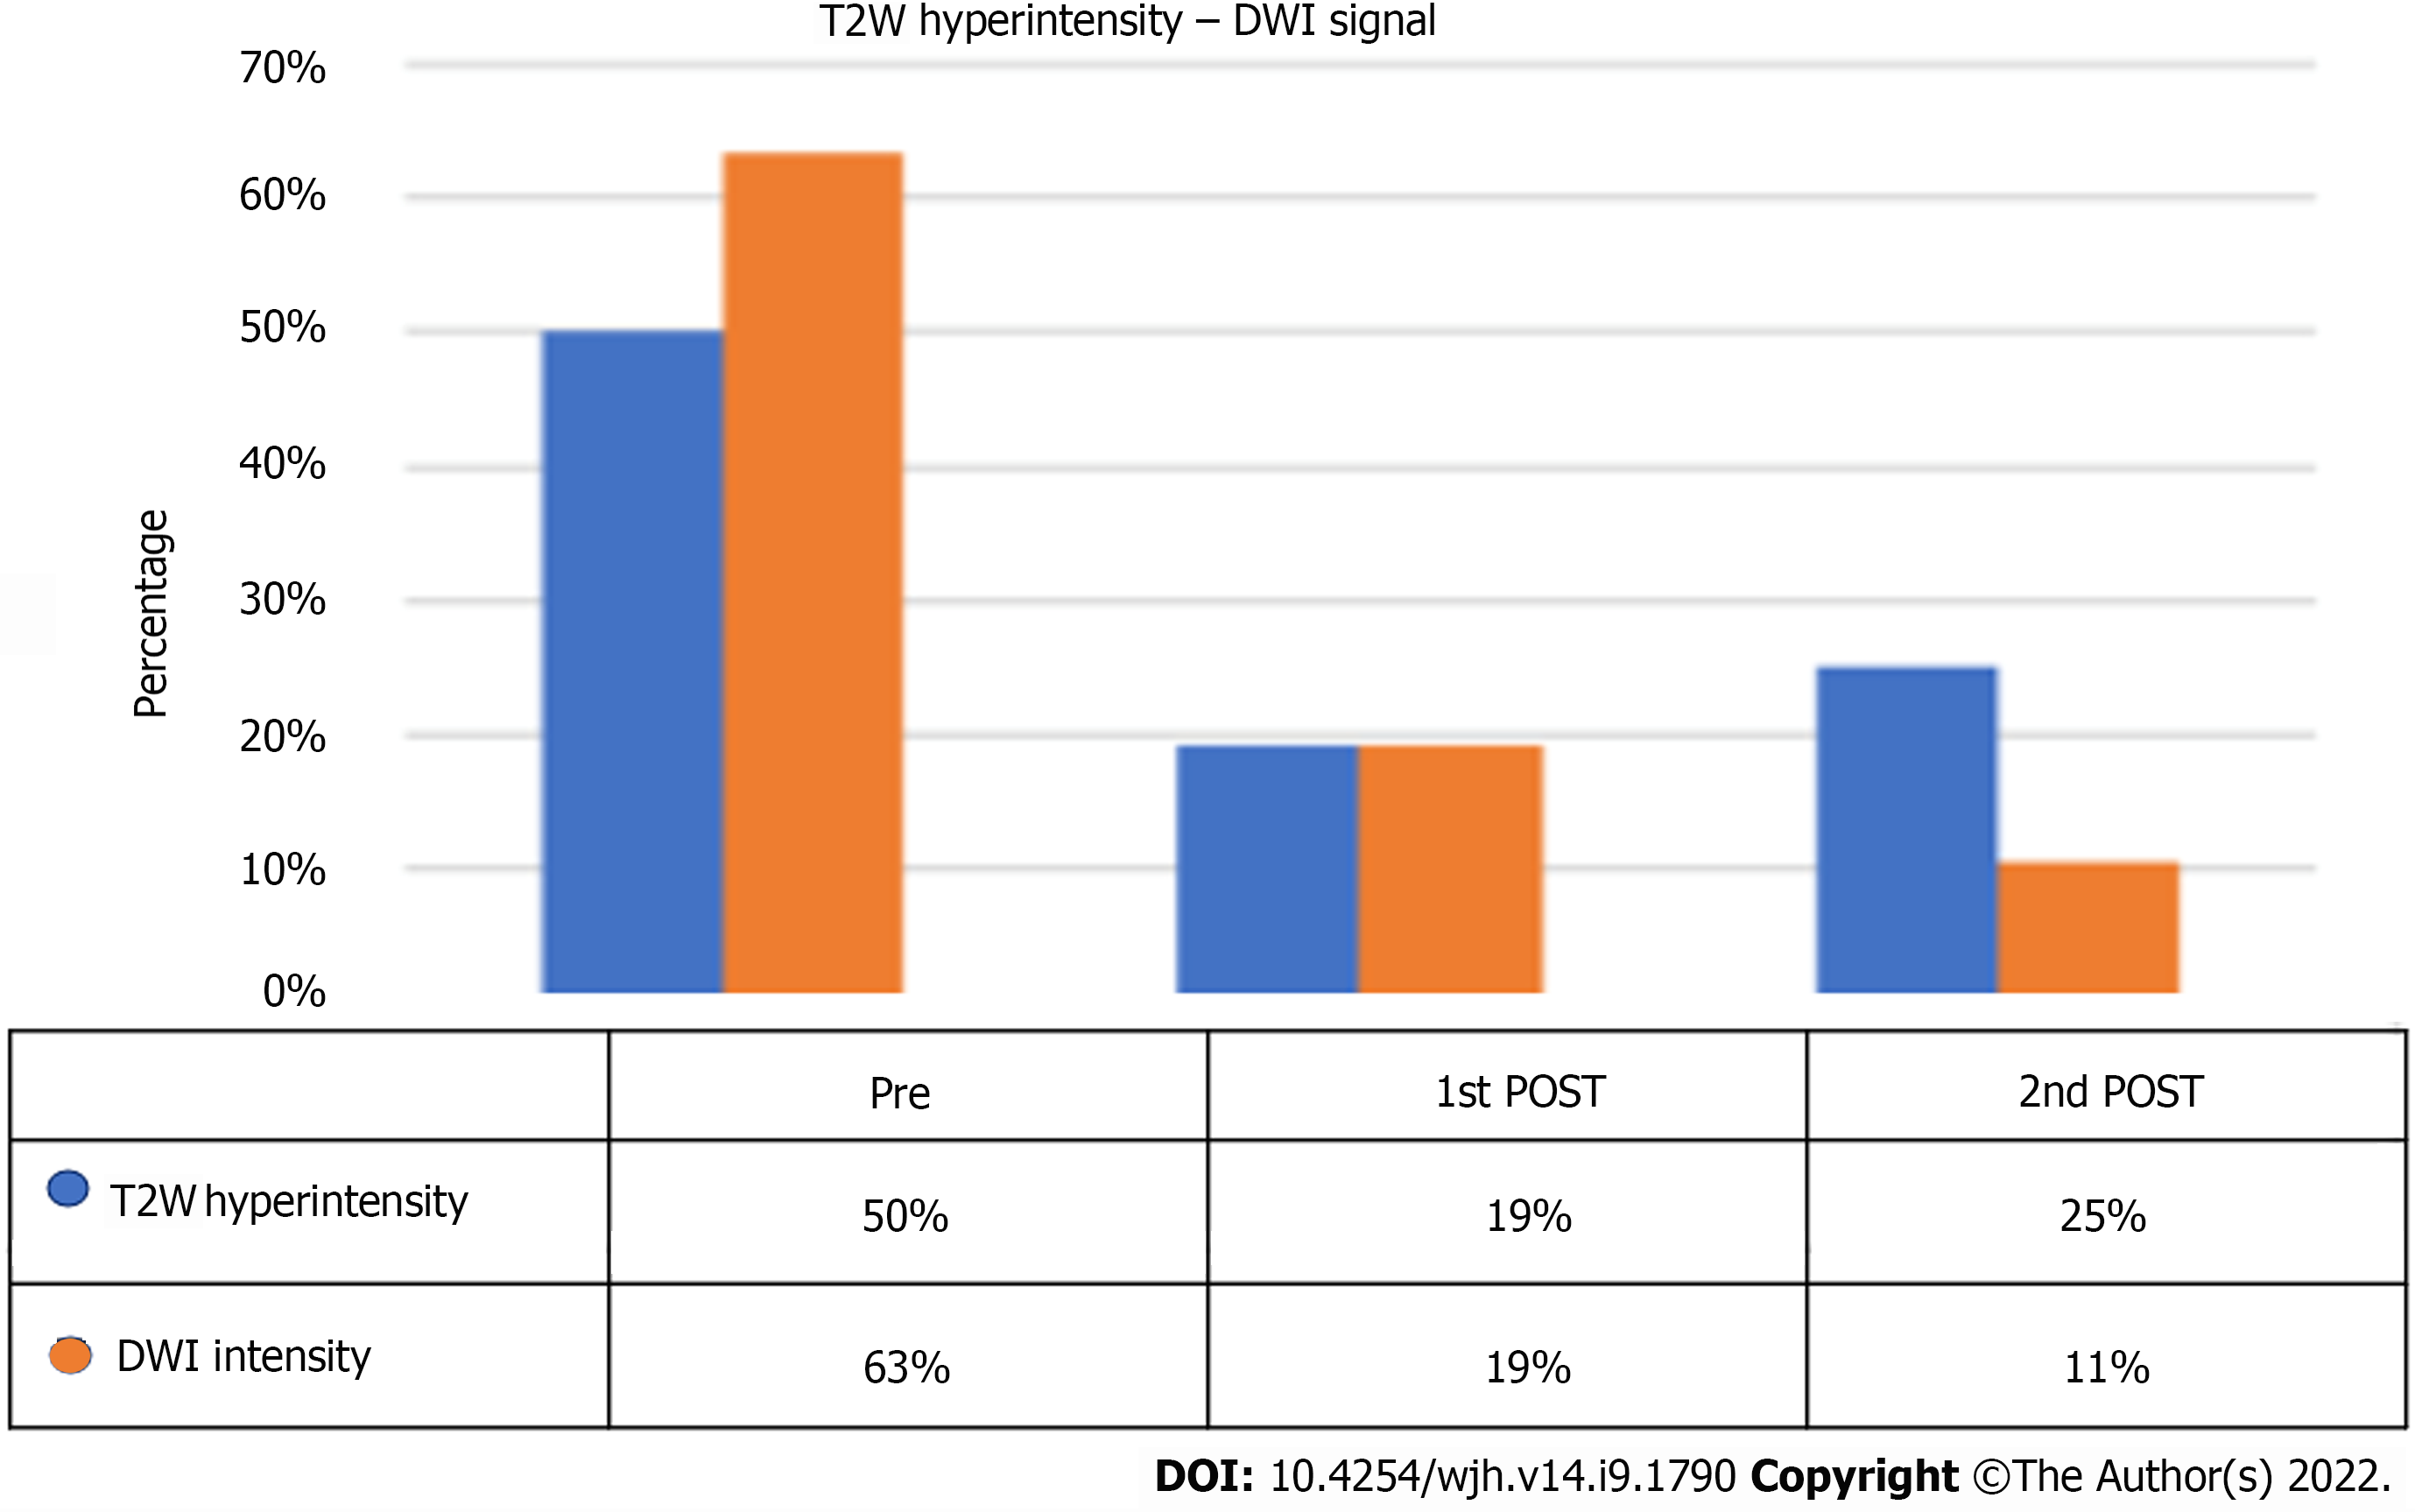
Figure 11 T2-weighted hyperintensity and diffusion-weighted imaging signal percentage at pre-stereotactic body radiation therapy and follow-ups.
T2W: T2-weighted; DWI: Diffusion-weighted imaging.
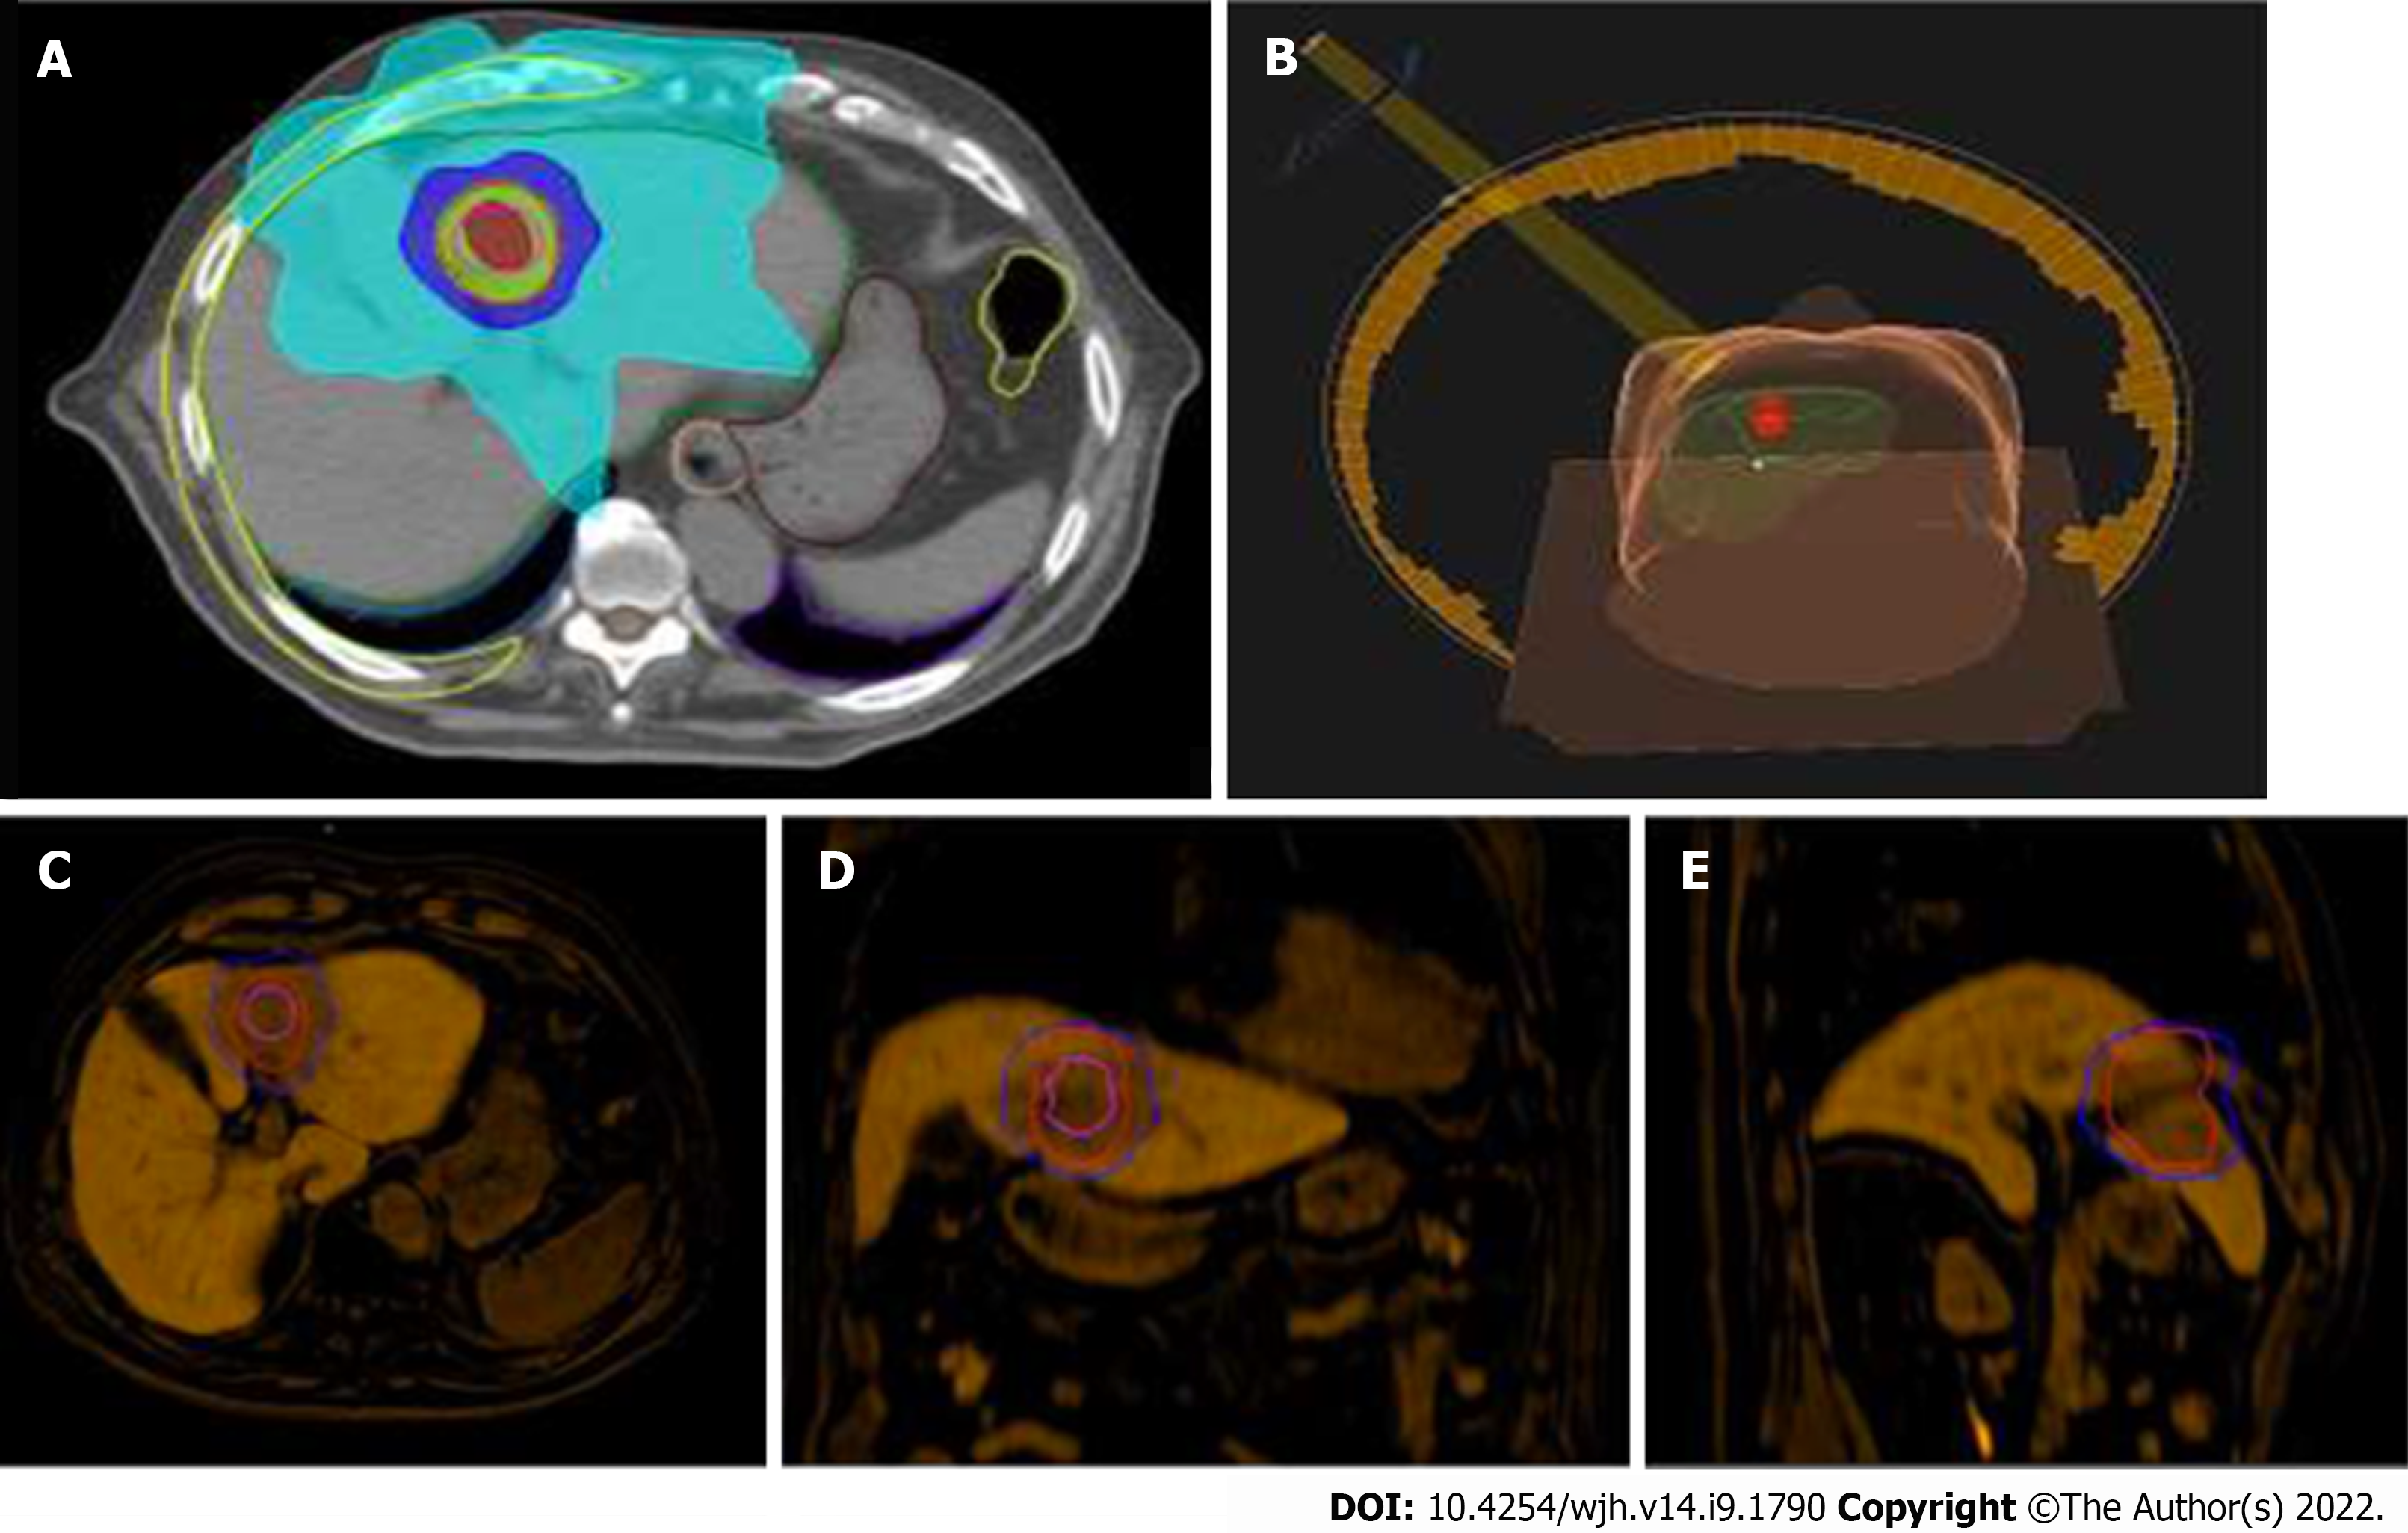
Figure 12 Stereotactic body radiation therapy planning for hepatocellular carcinoma.
A: Radiotherapy treatment planning with visualization of clinical target volume (pink line), planning target volume (red line), and areas of decreasing isodose; B: 3D rendering of the radiation beam and its incidence on the patient once positioned on the couch; C-E: Fusion Imaging of pre-stereotactic body radiation therapy planning (clinical target volume, pink line; planning target volume, red line; Isodose, 50% blue line) with magnetic resonance imaging images of the hepatobiliary excretion phase obtained 6 mo after the end of treatment. Band-like hypodensity during hepatobiliary excretion, an expression of functional resentment of the radio-treated parenchyma, is superimposed on the planning target volume area.
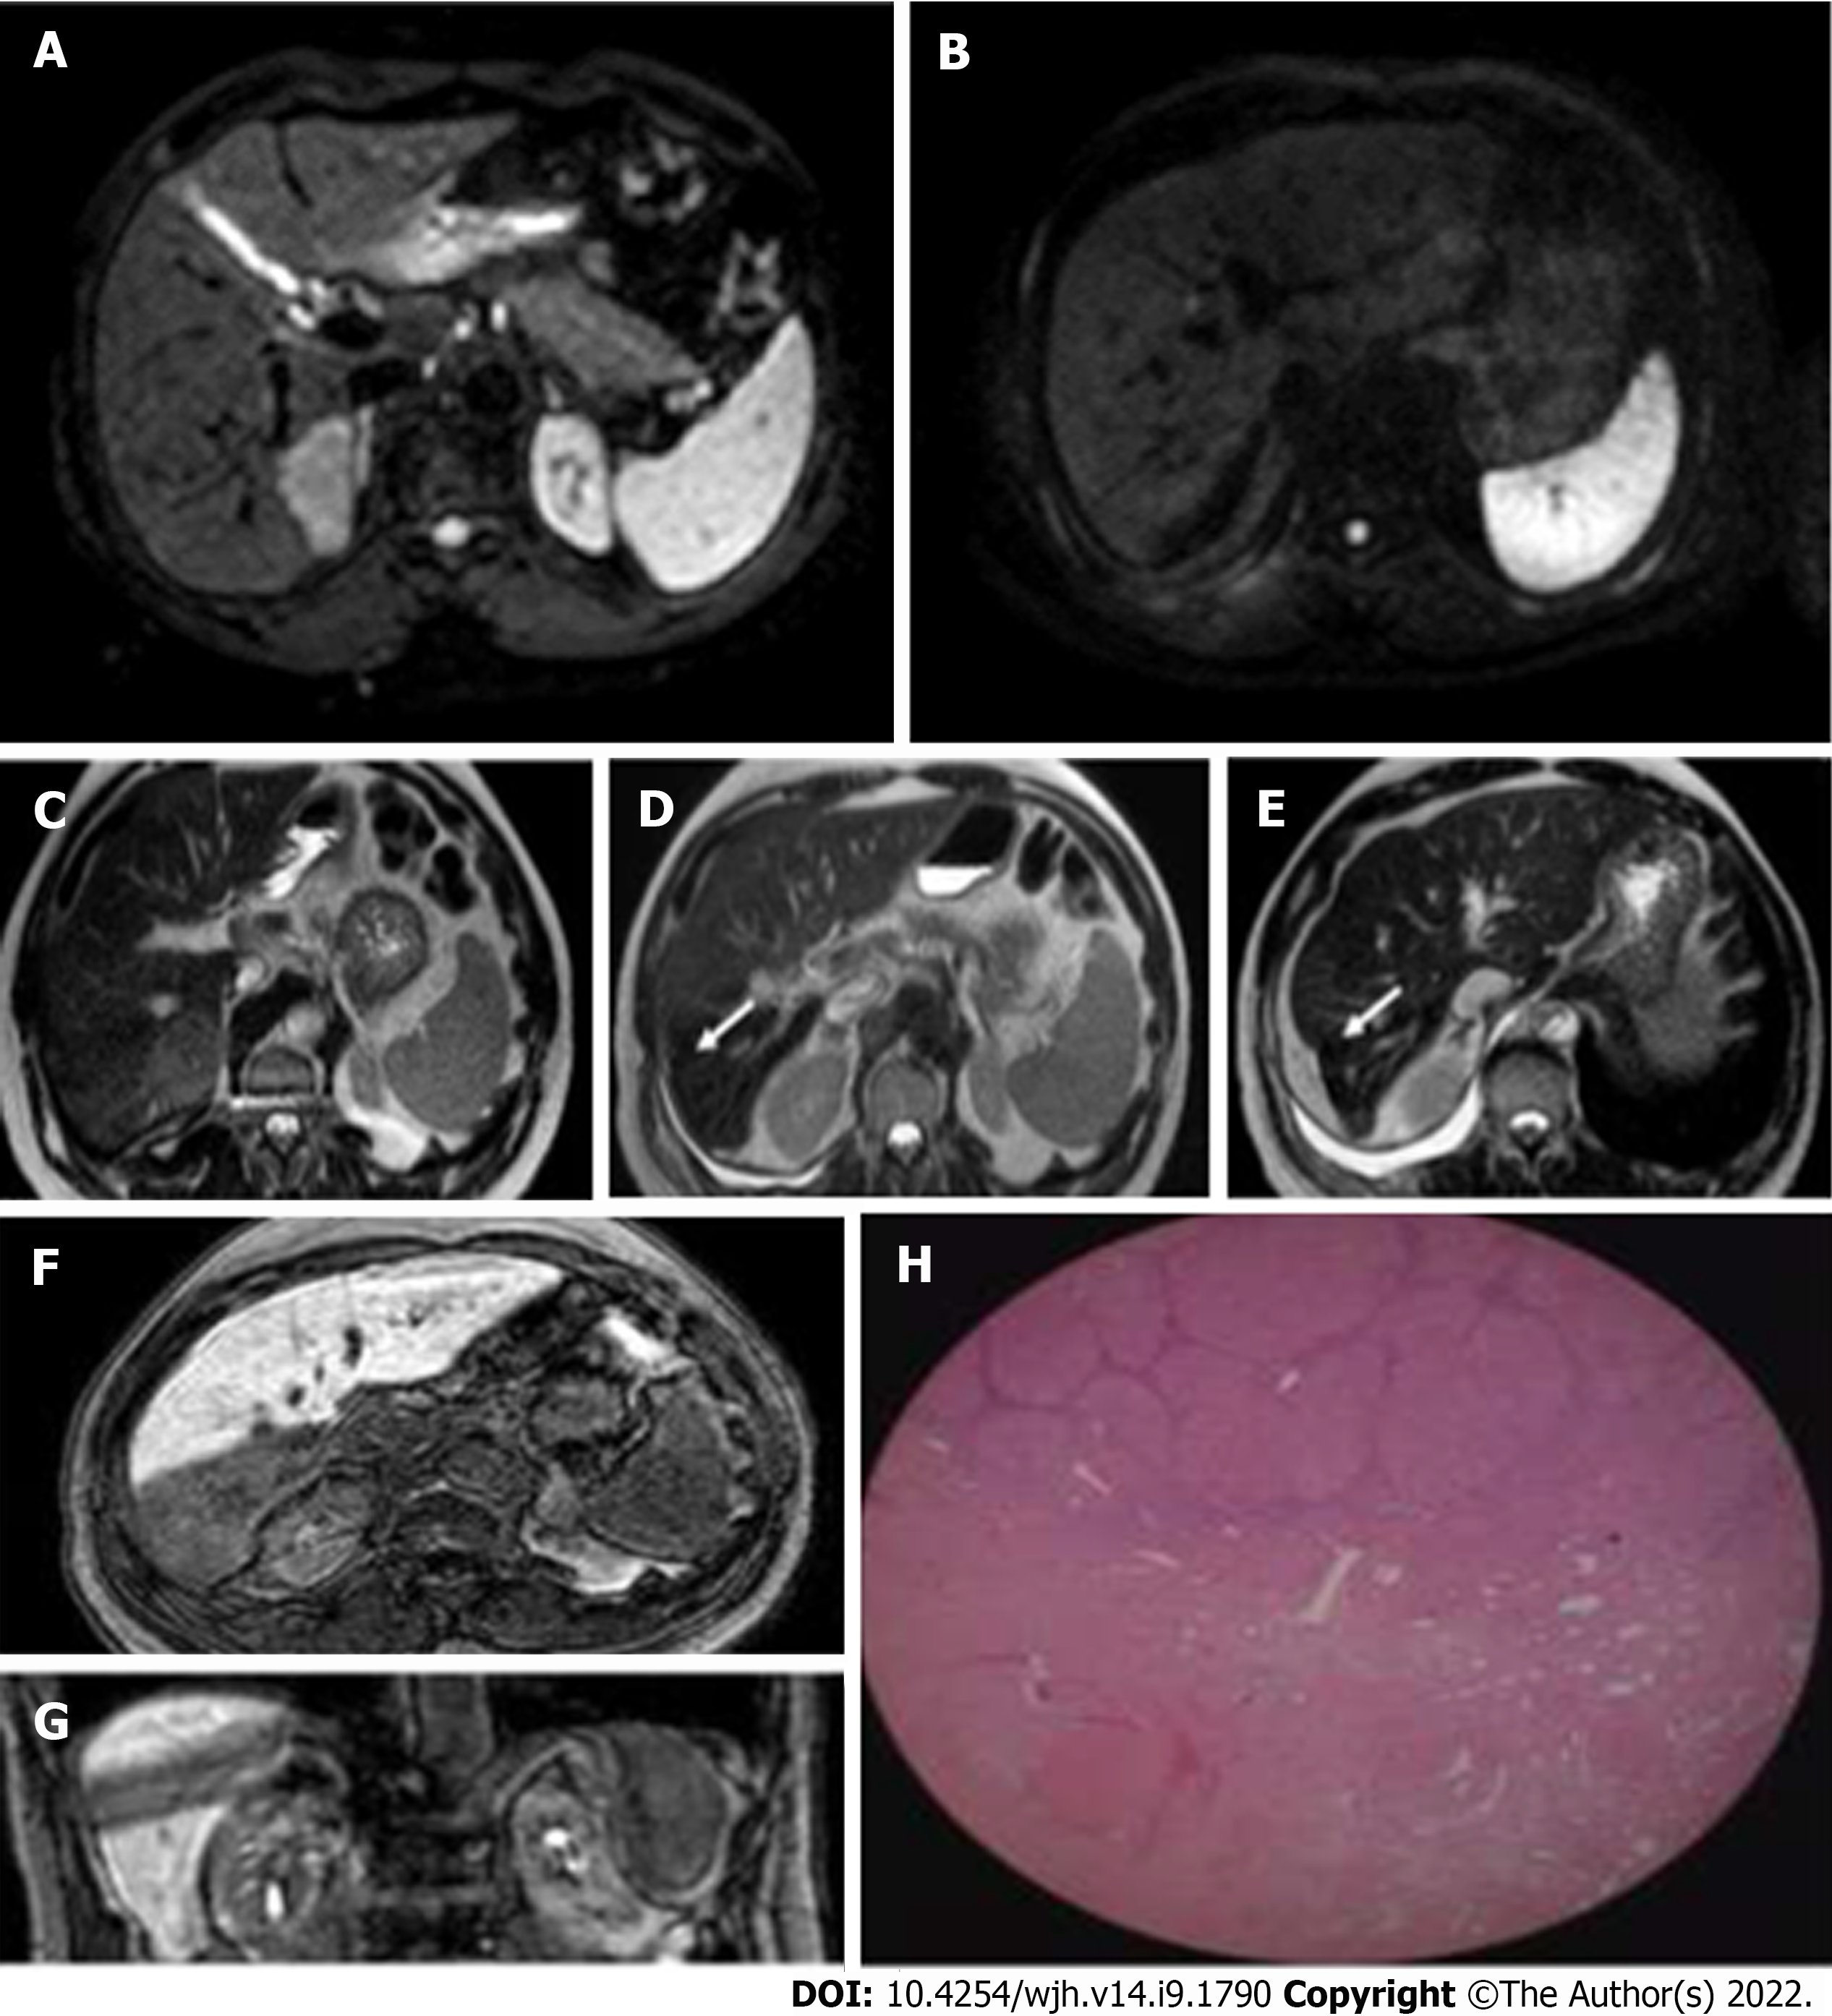
Figure 13 Hepatocellular carcinoma in a 75-year-old man treated with stereotactic body radiation therapy.
A and B: Diffusion-weighted imaging signal of a lesion located in segment VII, before and after treatment. In the pre-therapy evaluation, the nodule presented a marked narrowing of the diffusion of water molecules, a feature no longer present at post-stereotactic body radiation therapy (SBRT) examination; C: Hepatocellular carcinoma nodule located in segment VII characterized by intermediate signal on T2-weighted imaging; D and E: Initial capsular retraction (white arrow) was already evident at the first post-SBRT magnetic resonance examination and particularly evident at the 9 mo follow-up; F and G: SBRT outcomes characterised by an area of "band" hypodensity in the hepatic excretion phase in the axial and coronal sequences, corresponding to shaded hyperintensity in the T2-weighted sequences with the same distribution and morphology; H: These findings are an expression of treatment-induced fibrosis as demonstrated by the histological finding, where postradiotherapy fibrotic tissue can be identified after liver transplantation.
- Citation: Serafini A, Ruggeri V, Inchingolo R, Gatti M, Guarneri A, Maino C, Ippolito D, Grazioli L, Ricardi U, Faletti R. Liver magnetic resonance imaging for evaluation of response to treatment after stereotactic body radiation therapy of hepatocellular carcinoma. World J Hepatol 2022; 14(9): 1790-1803
- URL: https://www.wjgnet.com/1948-5182/full/v14/i9/1790.htm
- DOI: https://dx.doi.org/10.4254/wjh.v14.i9.1790


