Copyright
©The Author(s) 2022.
World J Hepatol. Jun 27, 2022; 14(6): 1210-1225
Published online Jun 27, 2022. doi: 10.4254/wjh.v14.i6.1210
Published online Jun 27, 2022. doi: 10.4254/wjh.v14.i6.1210
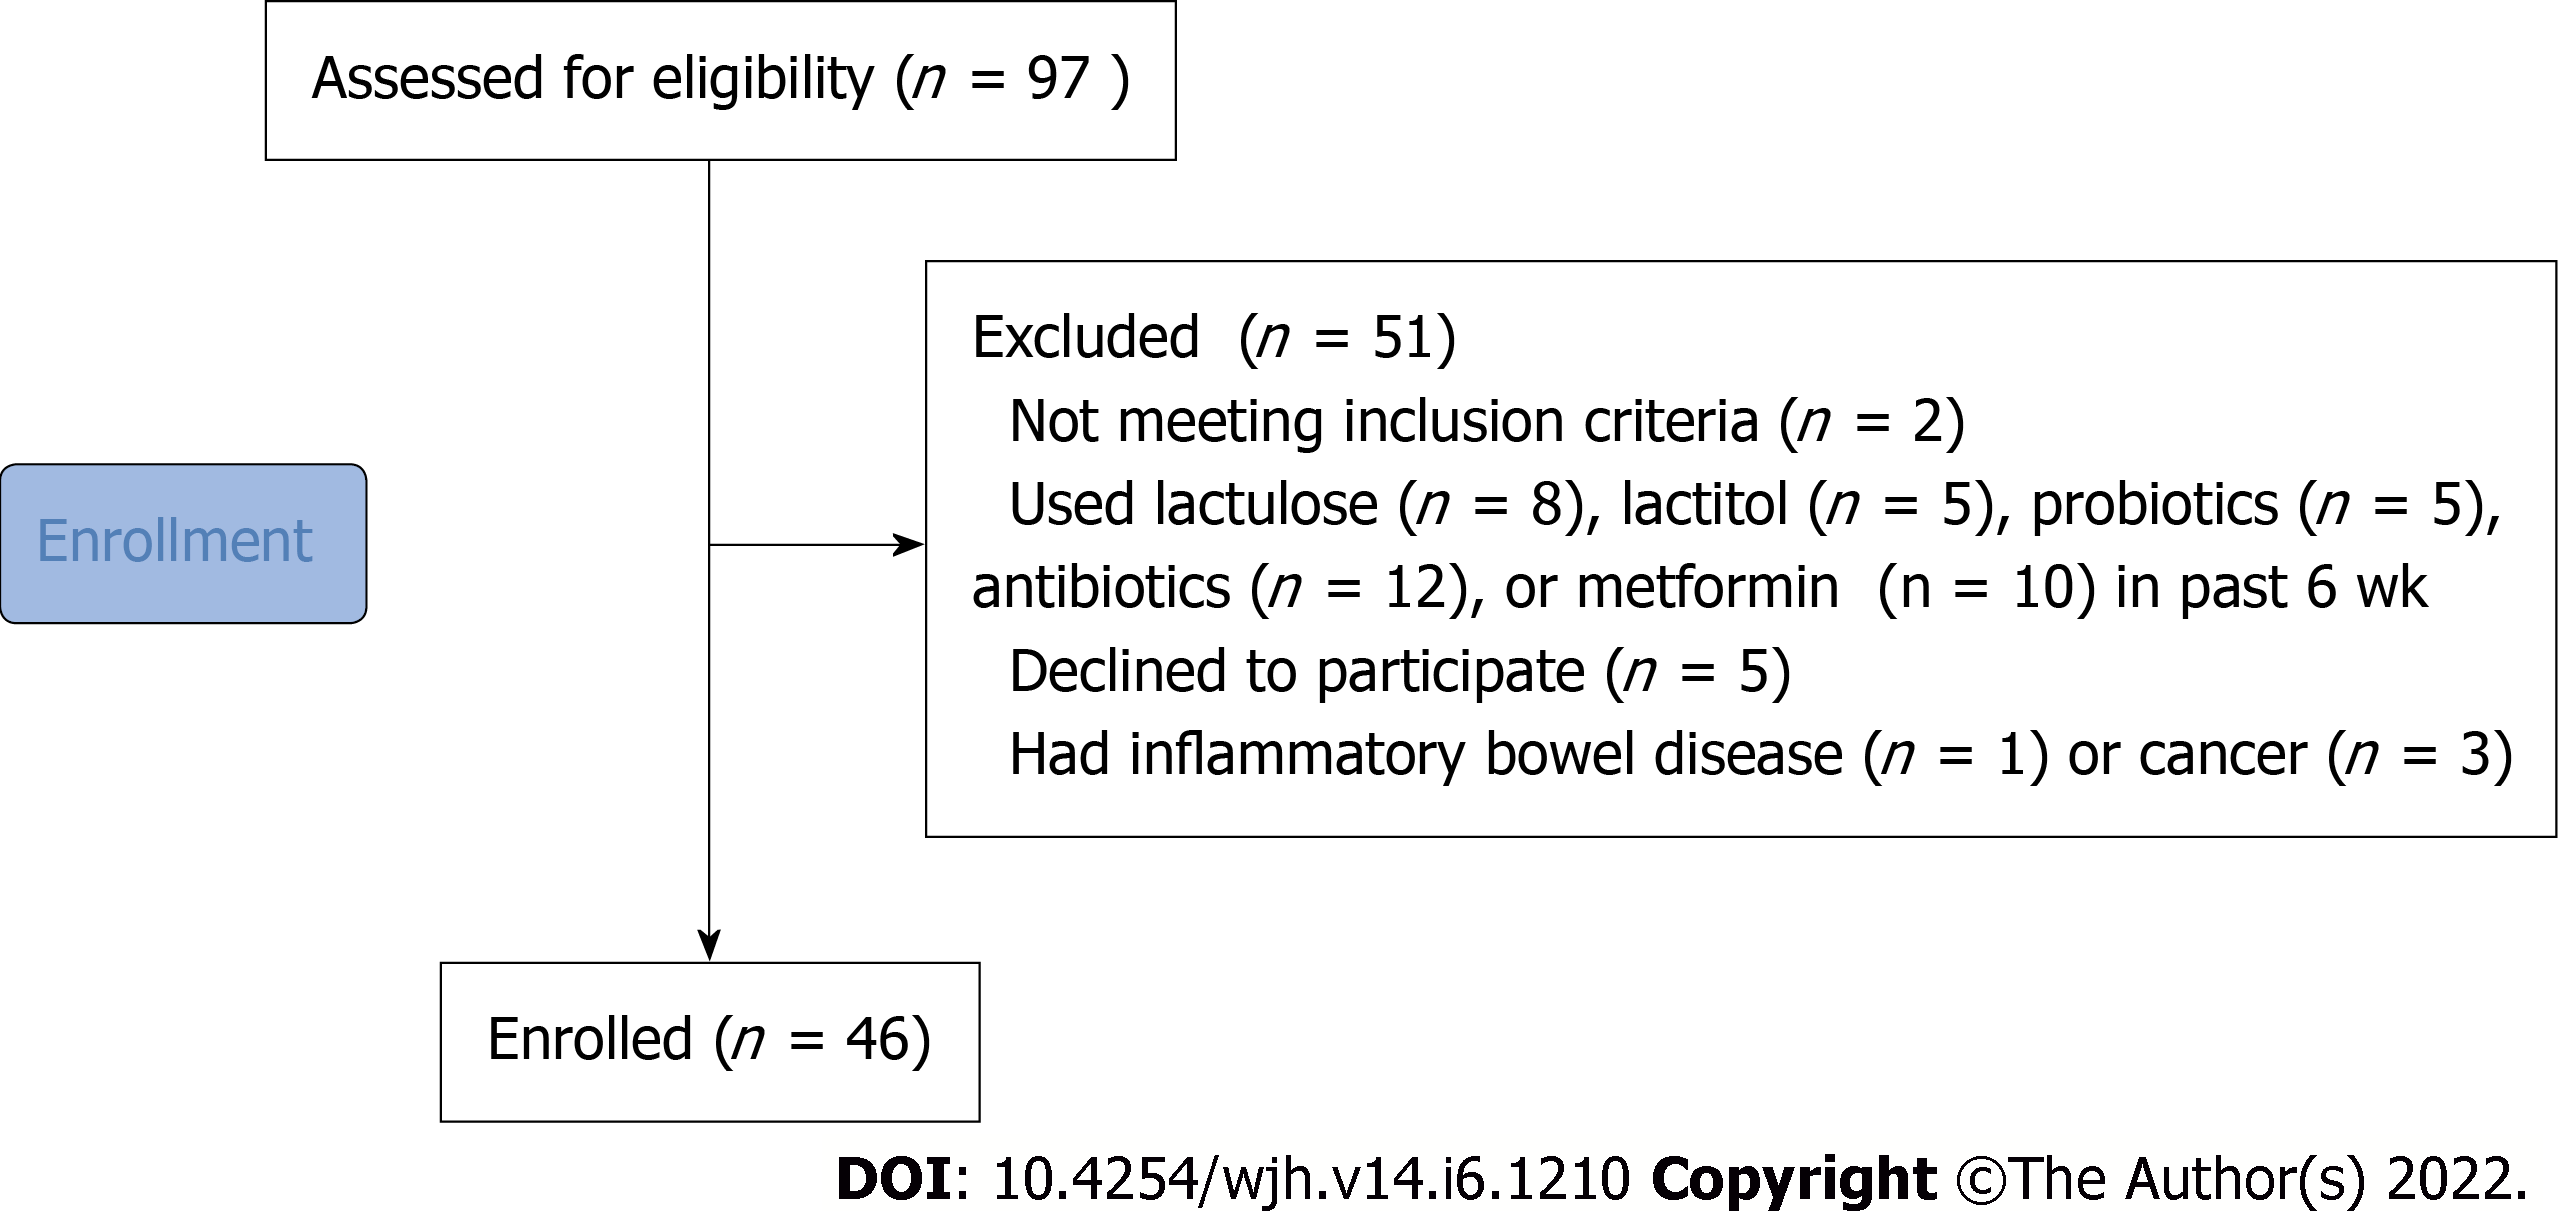
Figure 1 CONSORT 2010 flow diagram.
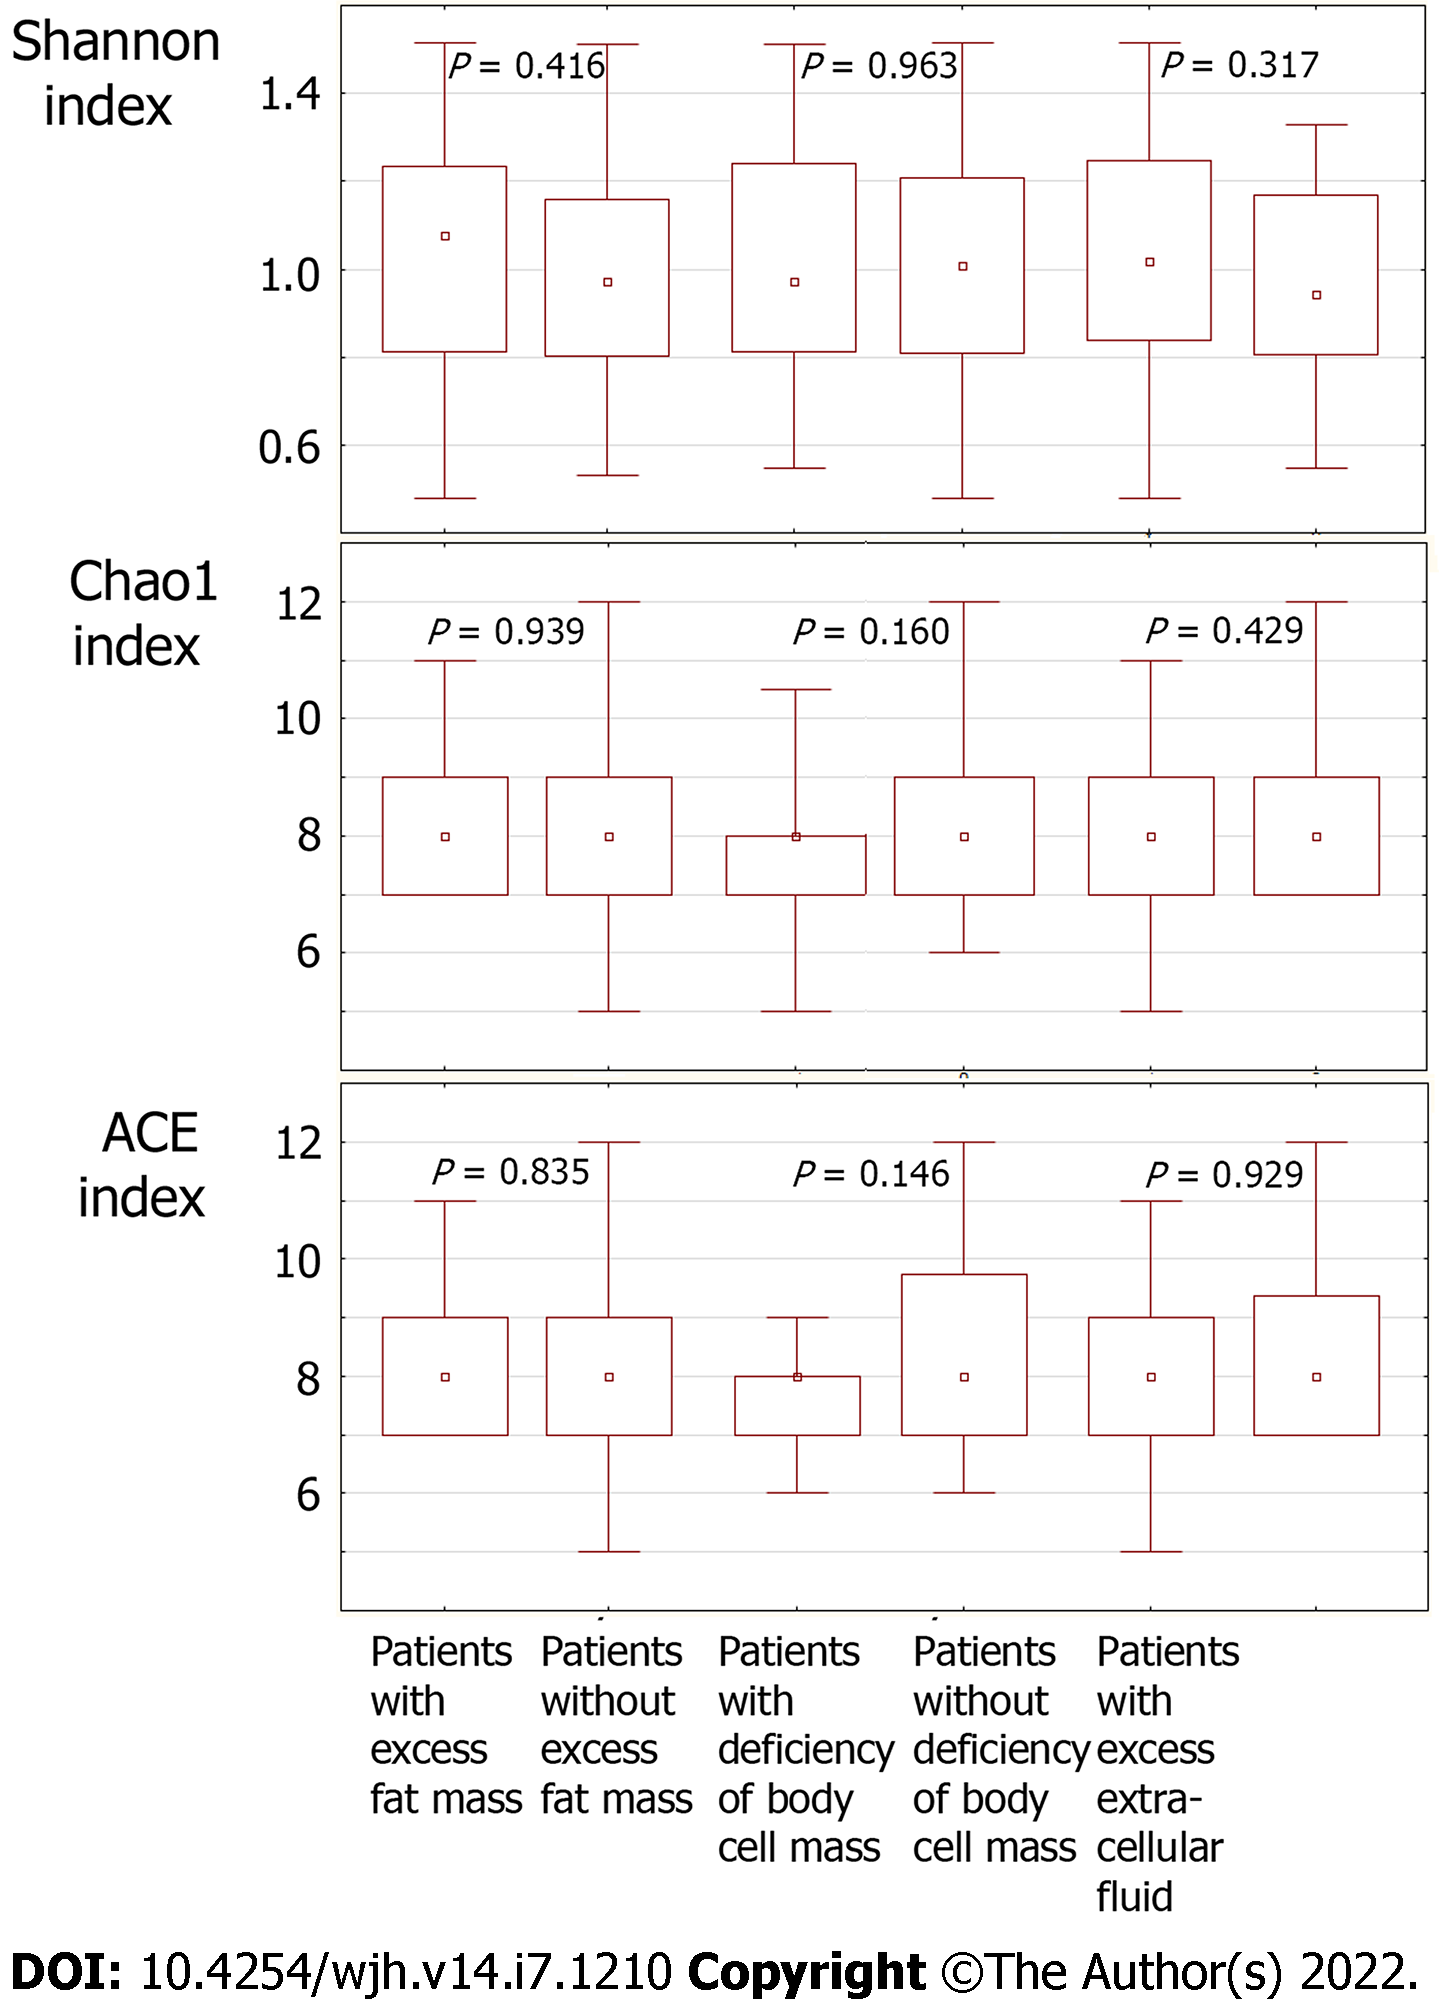
Figure 2 Comparison of gut microbiota biodiversity indices between the patient groups.
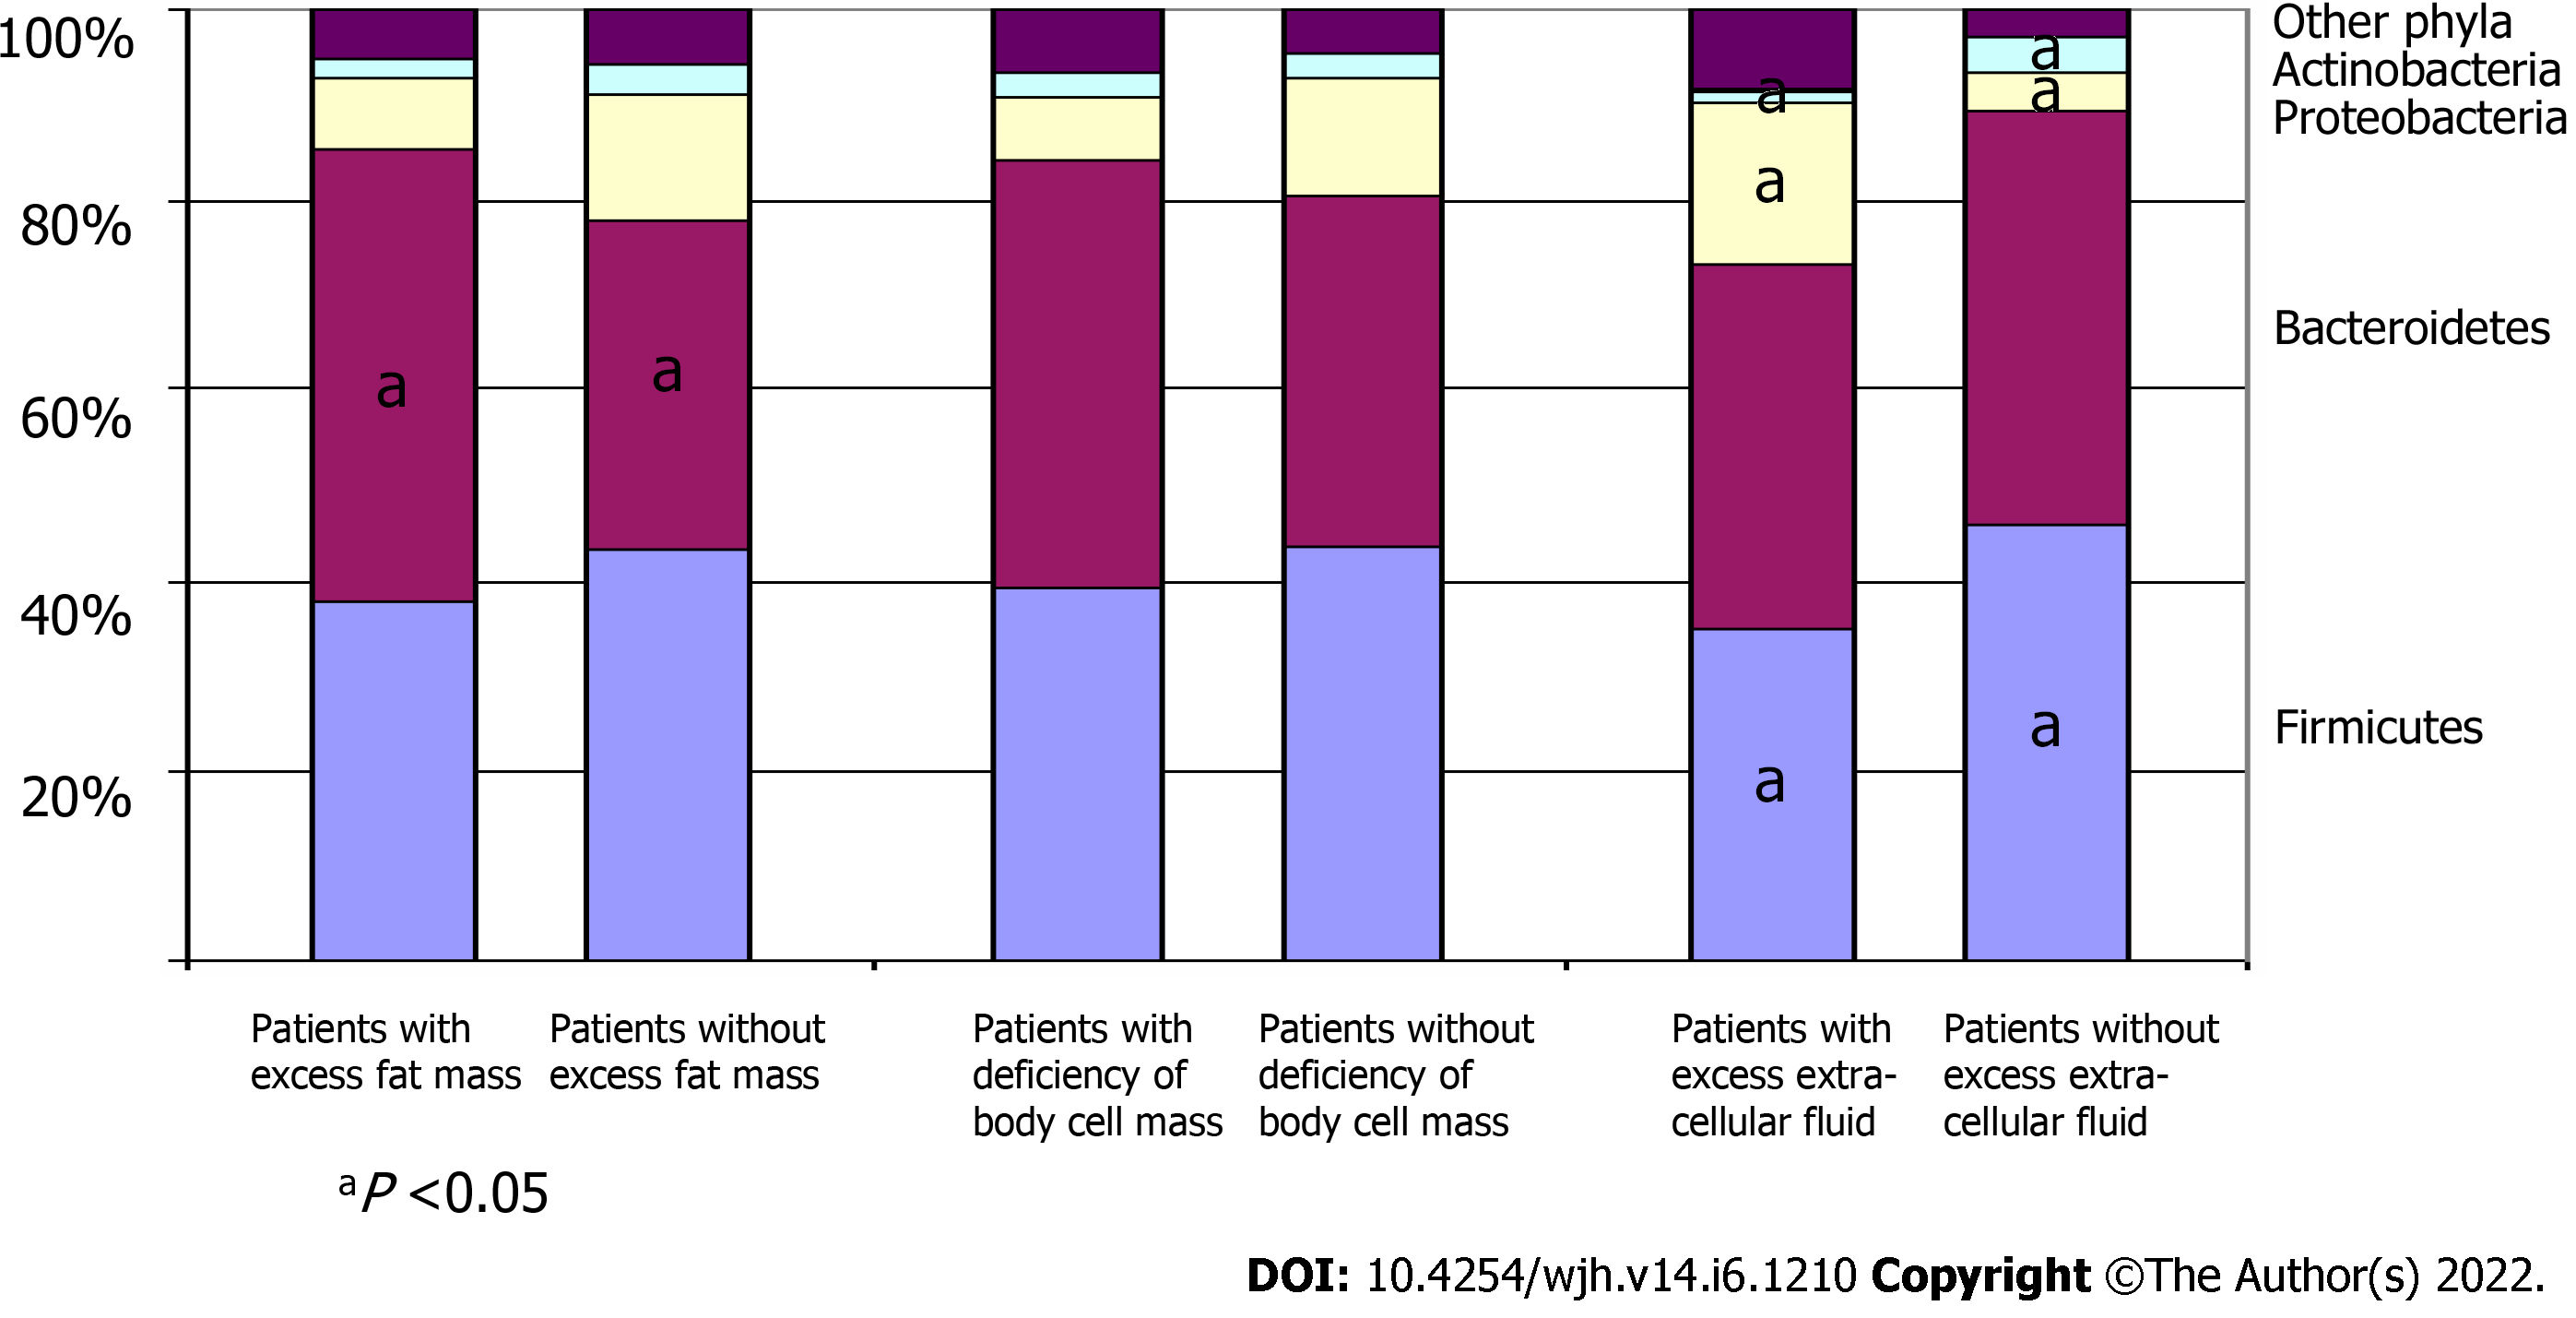
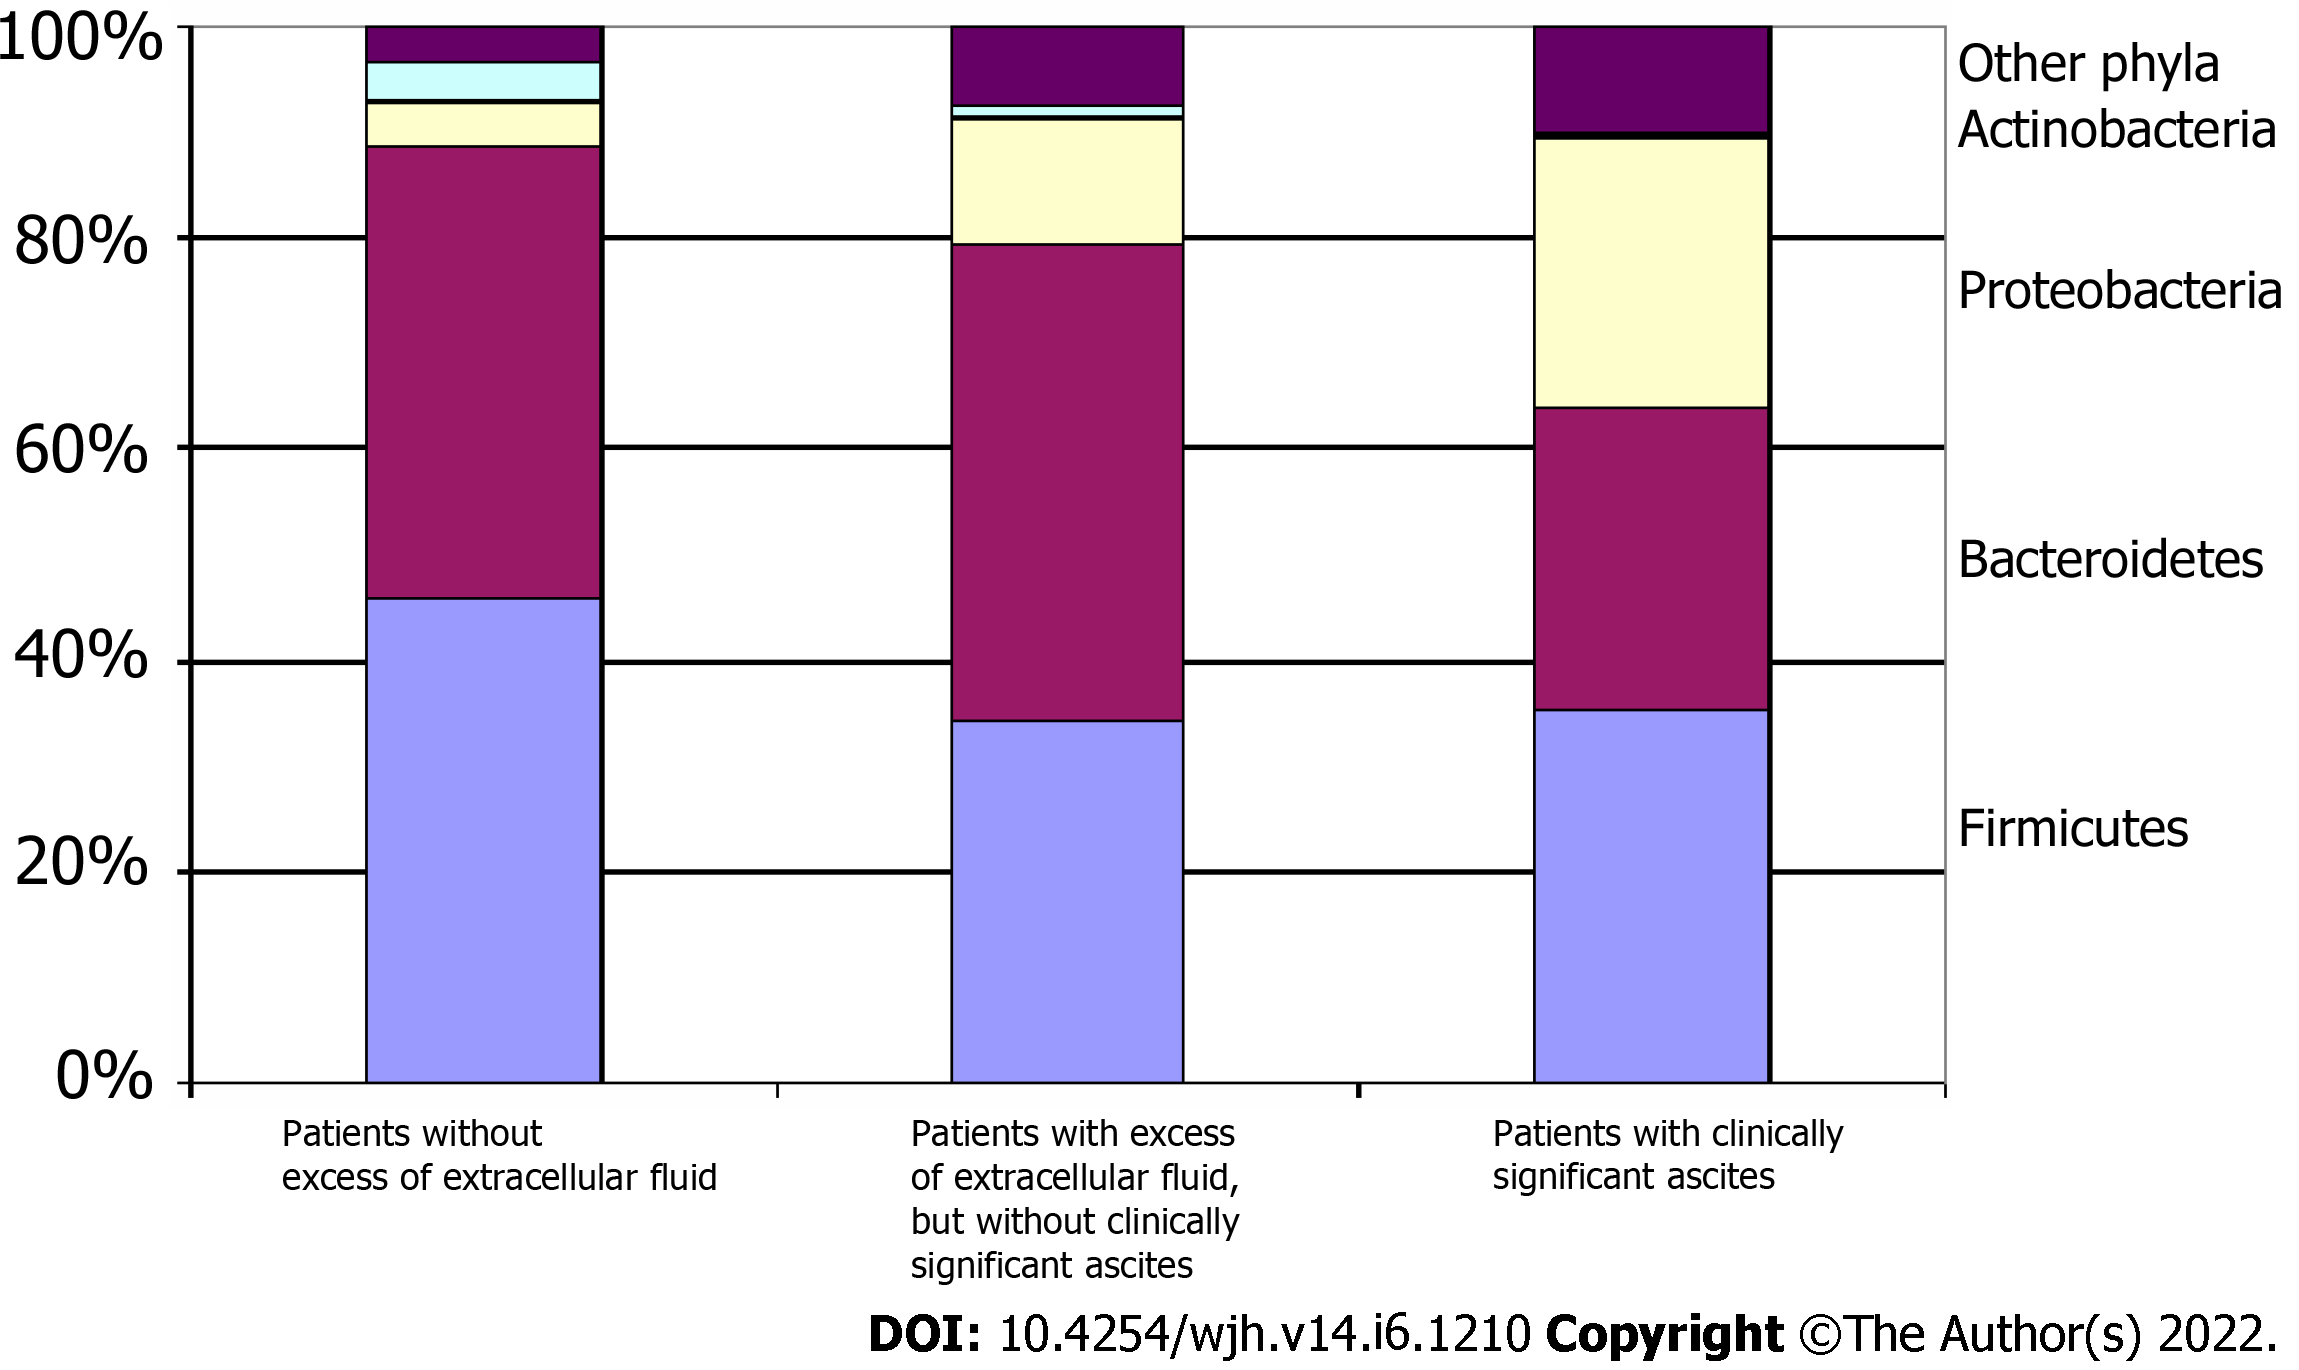
Figure 3 Comparison of gut microbiome at the phylum level between the patient groups.
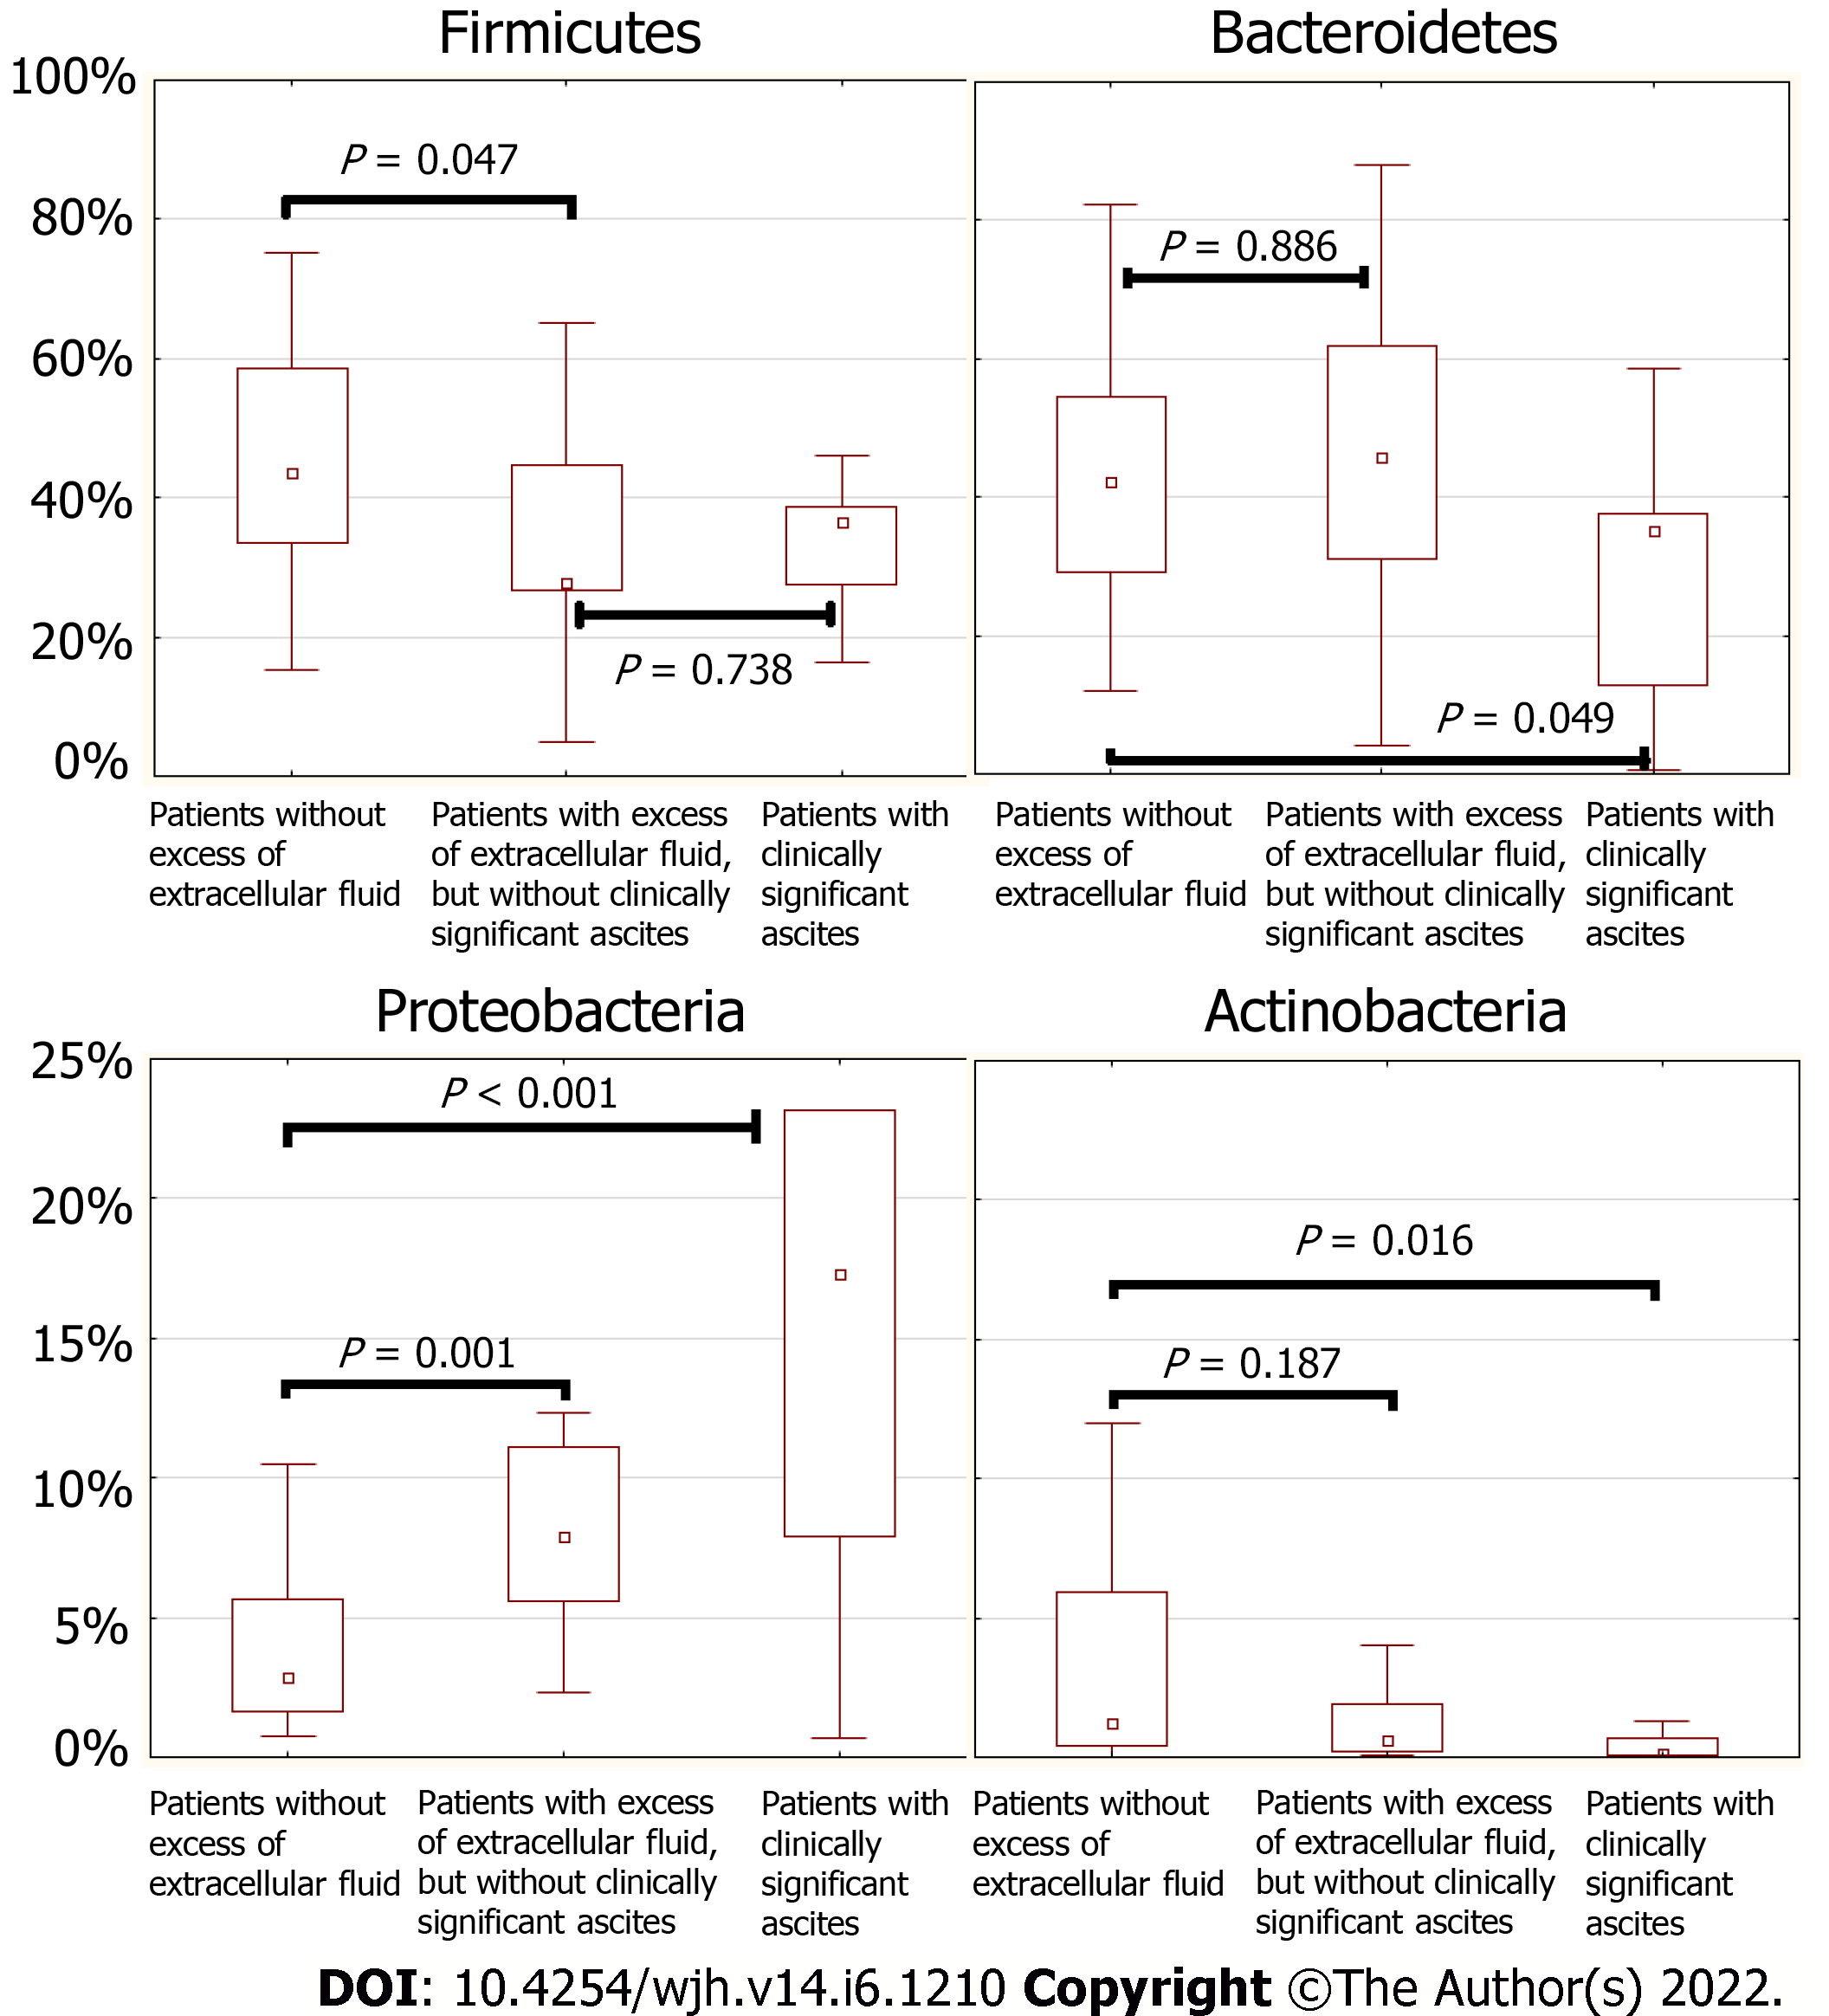
Figure 4 Abundance of the main phyla in the gut microbiome of patients without excess extracellular fluid, patients with excess extracellular fluid but without clinically significant ascites, and patients with clinically significant ascites.
Figure 5 Comparison of gut microbiome at the phylum level between the groups of the patients without excess extracellular fluid, patients with excess extracellular fluid but without clinically significant ascites, and patients with clinically significant ascites.
- Citation: Maslennikov R, Ivashkin V, Alieva A, Poluektova E, Kudryavtseva A, Krasnov G, Zharkova M, Zharikov Y. Gut dysbiosis and body composition in cirrhosis. World J Hepatol 2022; 14(6): 1210-1225
- URL: https://www.wjgnet.com/1948-5182/full/v14/i6/1210.htm
- DOI: https://dx.doi.org/10.4254/wjh.v14.i6.1210


