Copyright
©The Author(s) 2022.
World J Hepatol. Oct 27, 2022; 14(10): 1884-1898
Published online Oct 27, 2022. doi: 10.4254/wjh.v14.i10.1884
Published online Oct 27, 2022. doi: 10.4254/wjh.v14.i10.1884
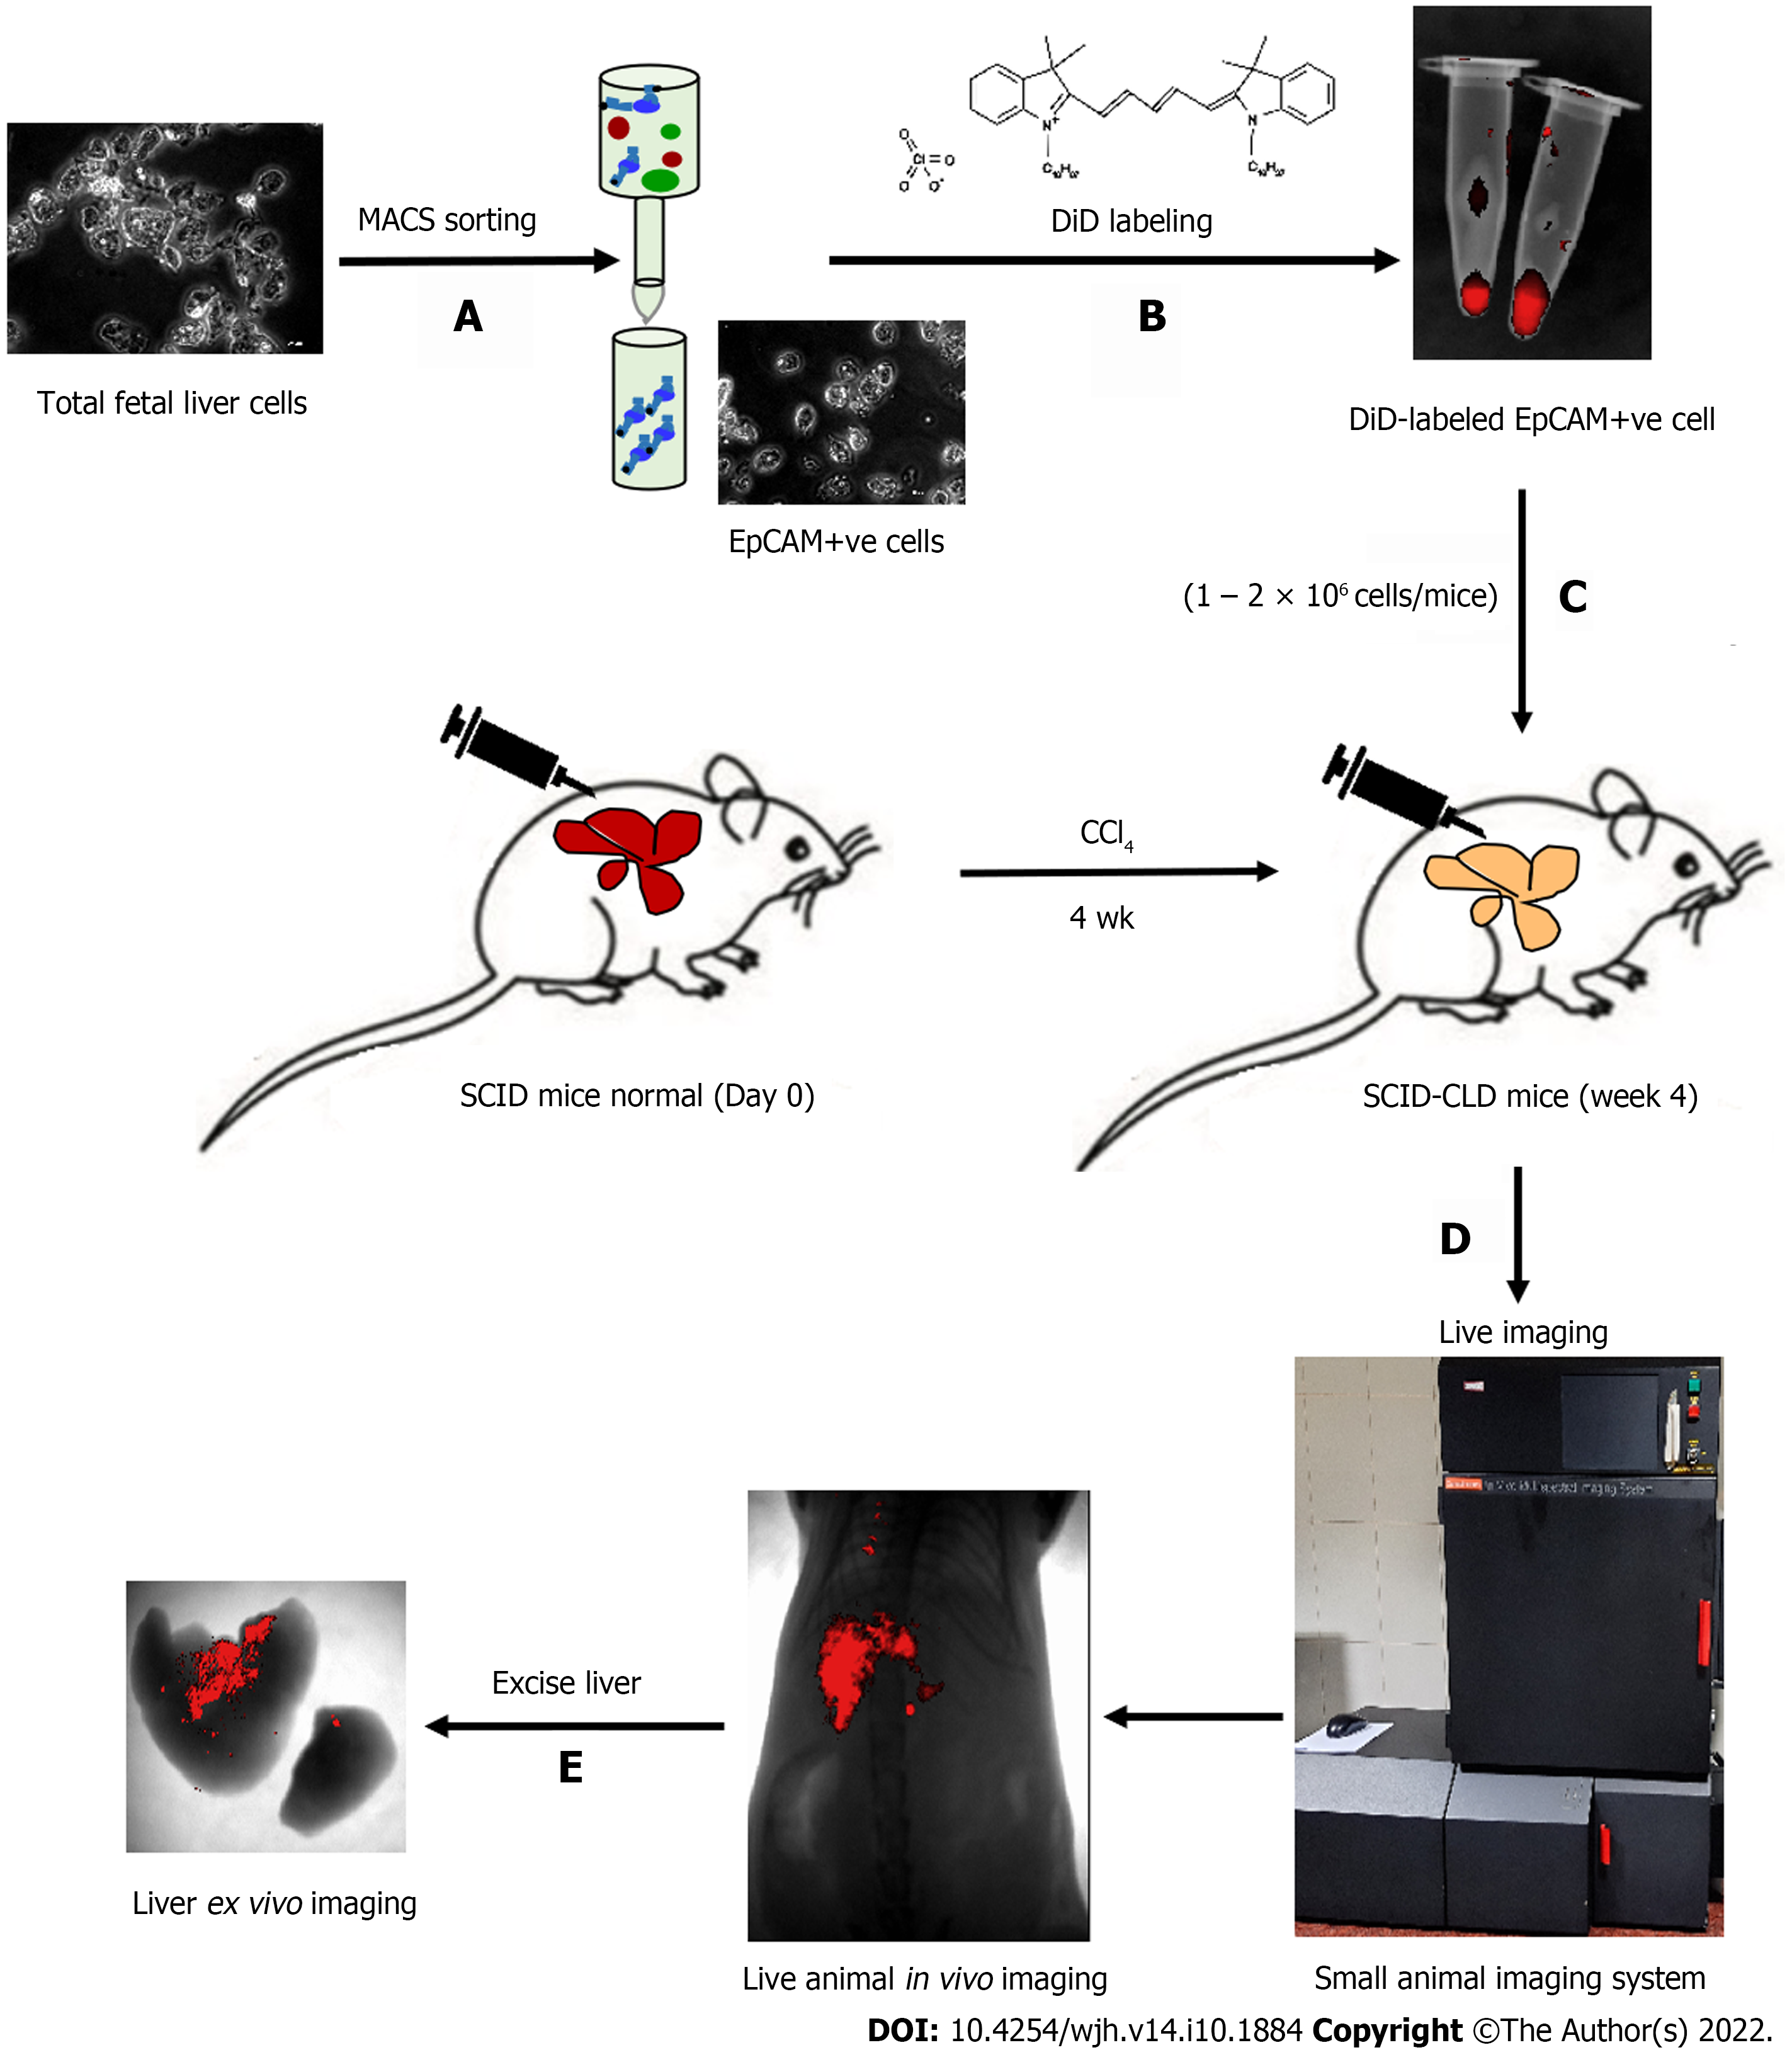
Figure 1 Schematic presentation of the study.
A: Total fetal liver cells were enriched for EpCAM-positive cells by magnetically activated cell sorting; B: Cells were labeled with DiD and visualized in the tube by near-infrared imaging as red fluorescence; C: Cells were intra-hepatically transplanted into injured livers of severe combined immunodeficiency mice; D: In vivo imaging of live animals was performed at specified time points; E: Ex vivo imaging of liver confirmed the retention of DiD-labeled transplanted cells in the liver. EpCAM: Epithelial cell adhesion molecule; SCID: Severe combined immunodeficiency; MACS: Magnetic activated cell sorting.
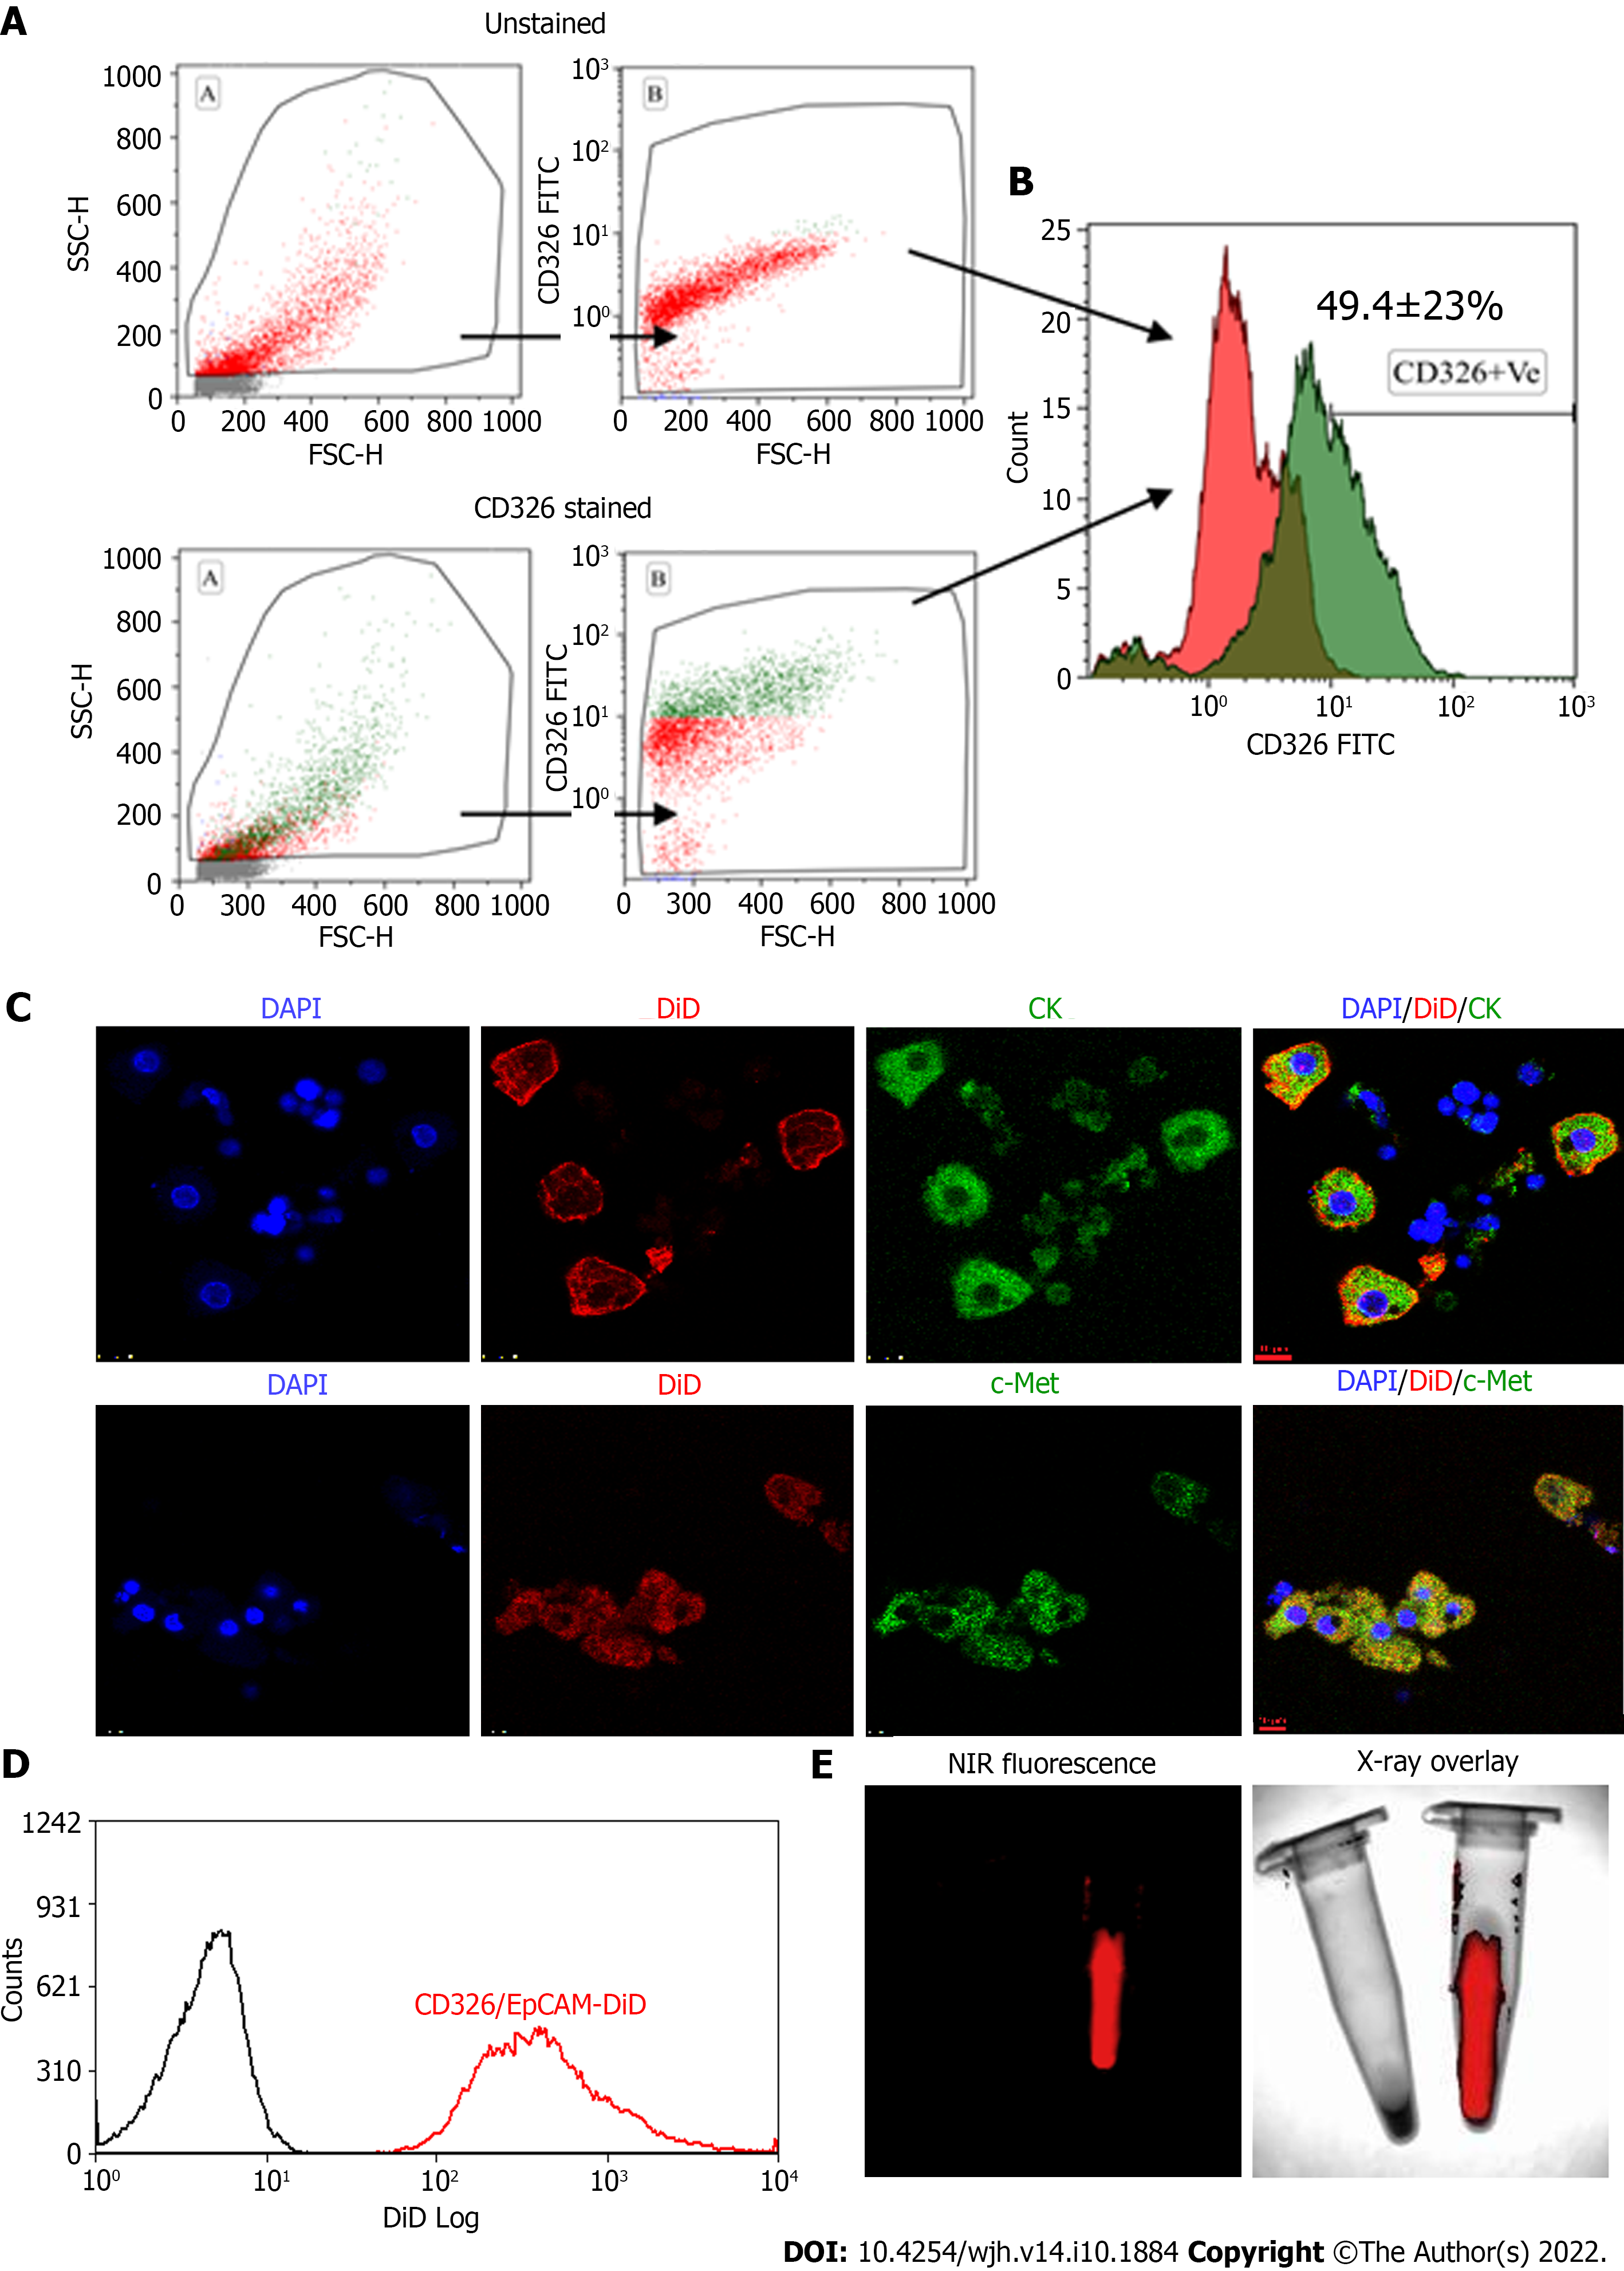
Figure 2 Flow cytometry characterization of epithelial cell adhesion molecule expressing fetal hepatic progenitors, and DiD labeling of magnetically activated cell sorting enriched epithelial cell adhesion molecule-positive cells.
A and B: Total fetal liver progenitors were stained with epithelial cell adhesion molecule (EpCAM)-fluorescein isothiocyanate (FITC) antibody and the representative dot plots of (A) unstained and EpCAM (CD326) stained cells and (B) overlay histogram; C: Colocalization of pan CK and c-Met with EpCAM-FITC expression (Scale bar = 10 μm); D: Overlay histogram of magnetically sorted EpCAM-positive cells labeled with DiD; E: Near-infrared fluorescence imaging and X-ray overlay image of DiD-labeled and unlabeled EpCAM-positive cells in the tube. EpCAM: Epithelial cell adhesion molecule; NIR: Near-infrared; DAPI: 4',6-diamidino-2-phenylindole; MACS: Magneticallyactivated cell sorting.
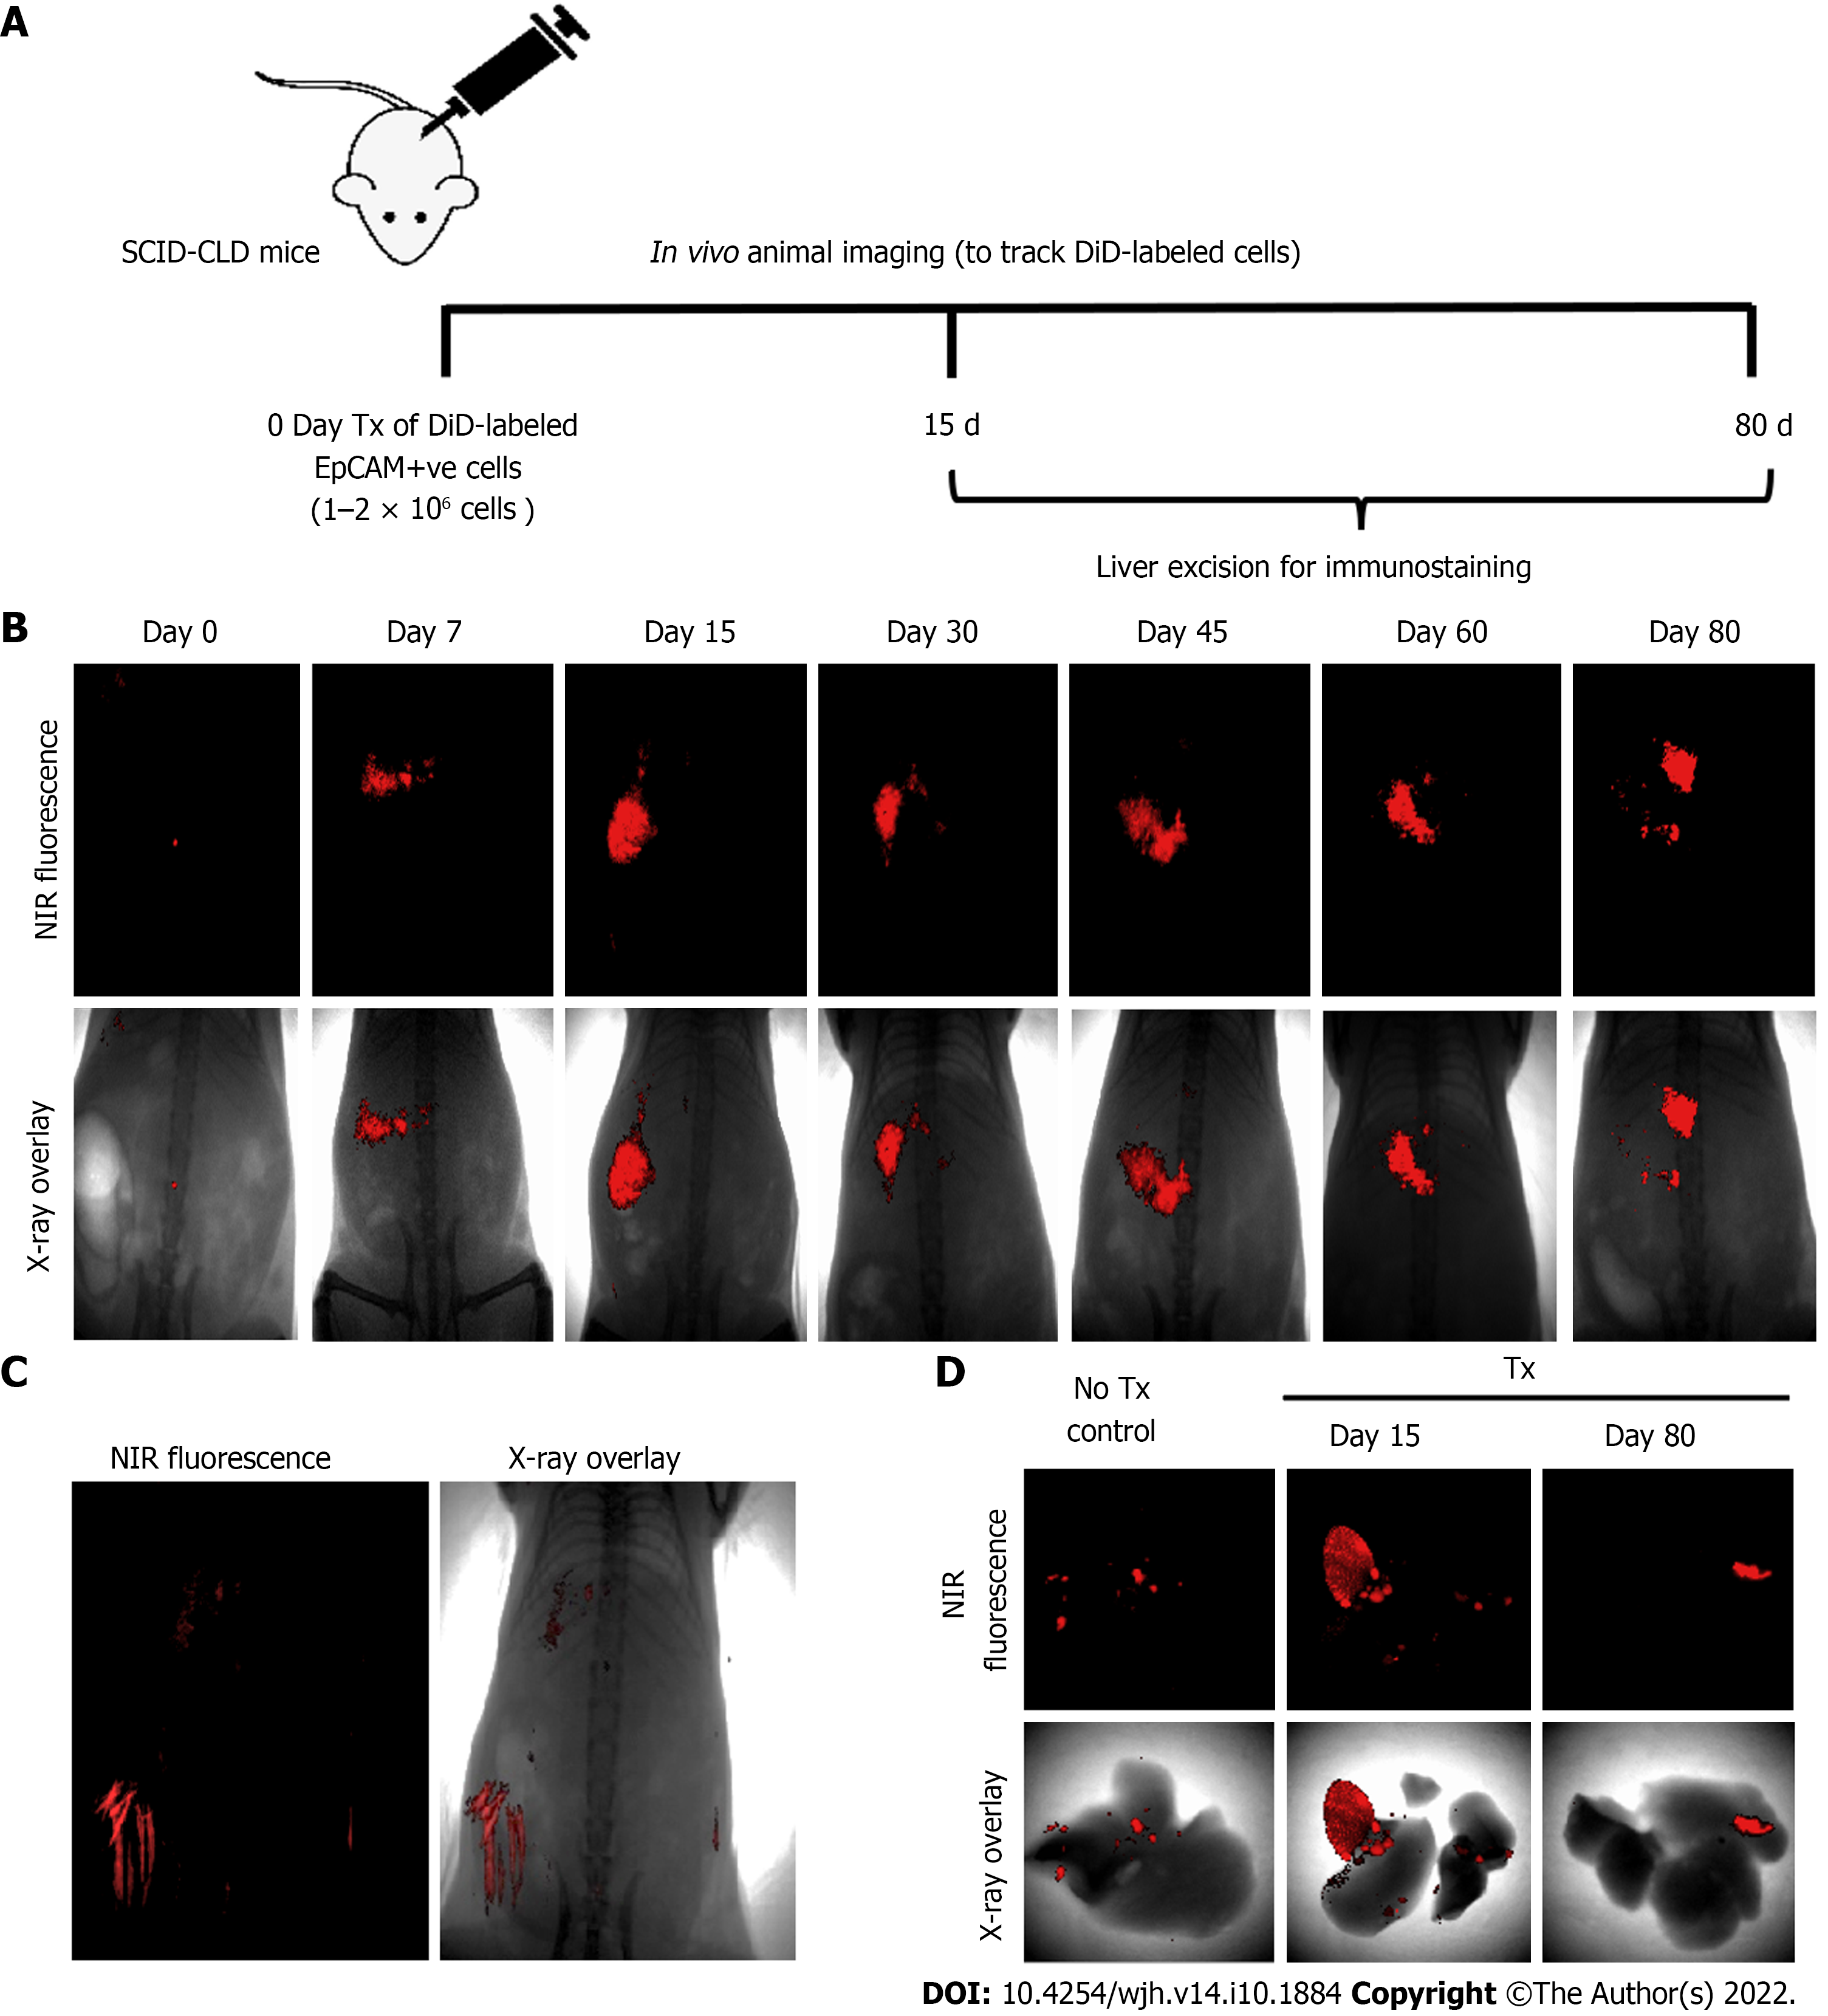
Figure 3 Long-term in vivo tracking of transplanted cells.
A: Schematic representation showing the timeline for cell transplantation in mice with chronic liver diseases, imaging, and animal sacrifice; B: In vivo near-infrared (NIR)-fluorescence images (top panel) overlay with X-ray images (lower panel) of mice post-transplantation at indicated time periods; C: NIR-fluorescence image overlay with X-ray image of non-transplanted control mice (hair autofluorescence can be seen); D: Ex vivo imaging of excised livers of non-transplant control mice and transplanted mice at 15 and 80 d post-transplantation.
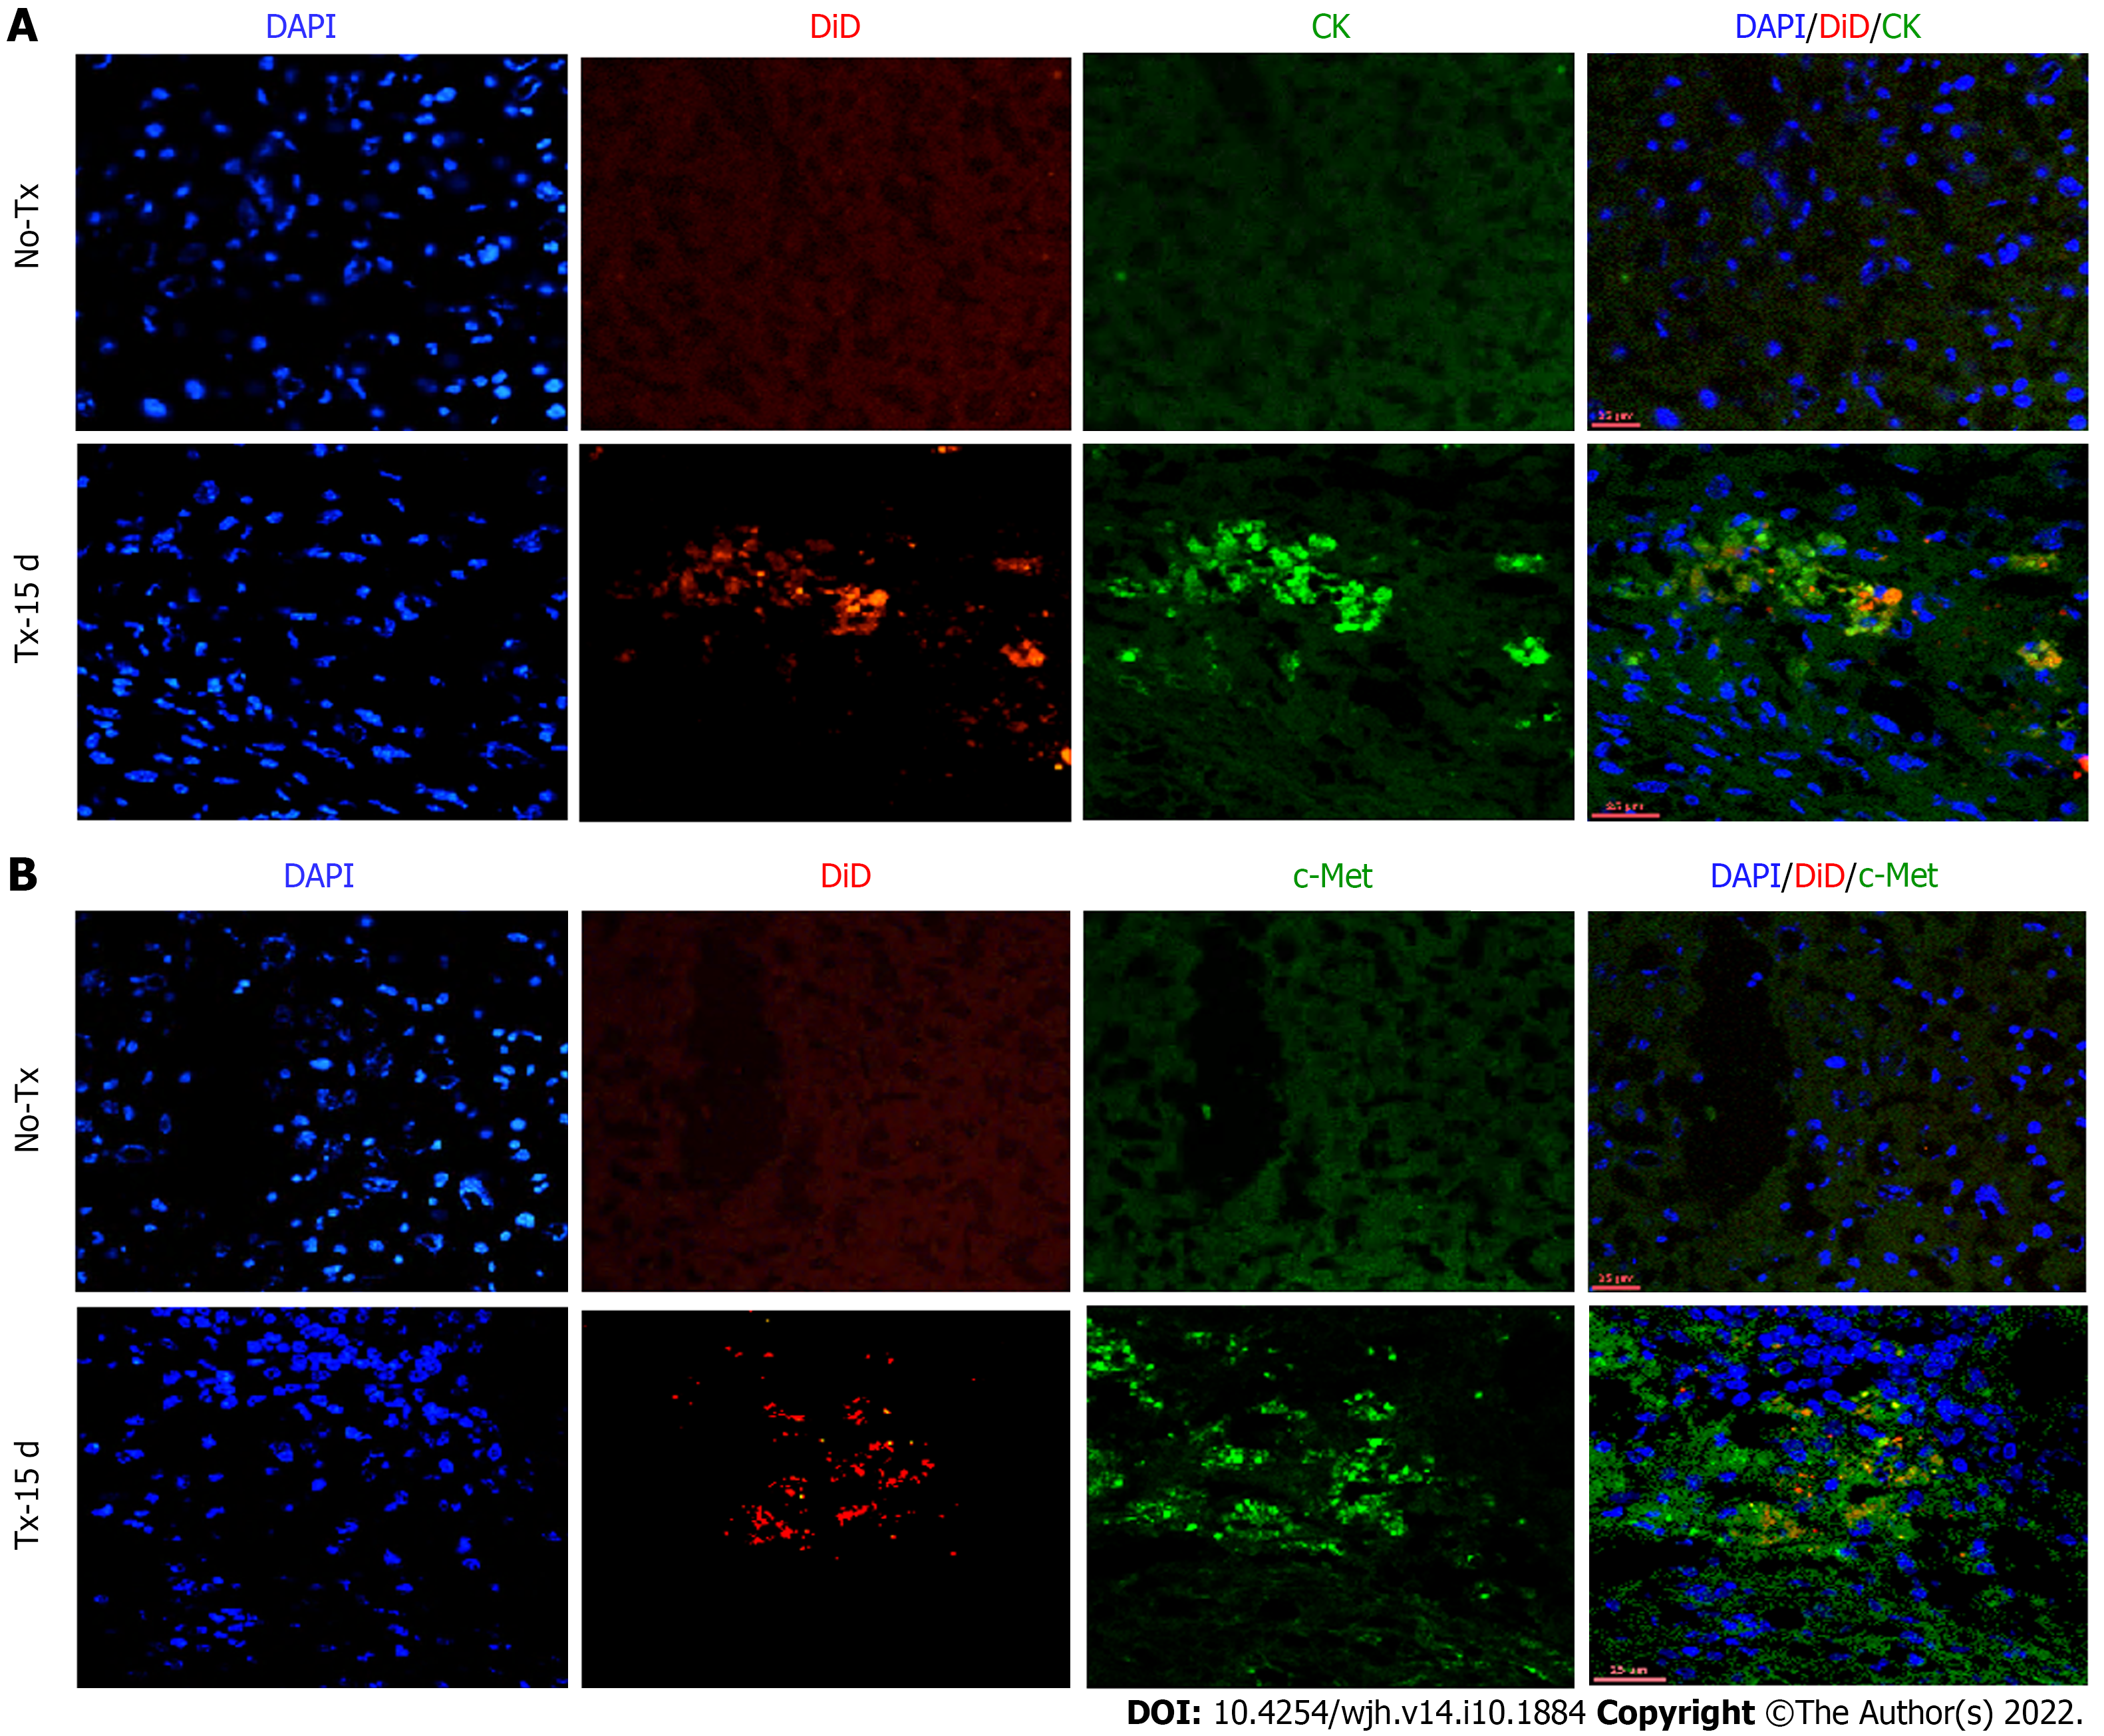
Figure 4 Co-expression of hepatic markers in the transplanted livers 15 d post-transplantation.
Confocal images of liver tissue cryosections of transplanted (TX-15 d) and non-transplanted (No-TX) mice showing expression of CK and c-Met colocalization with DiD-labeling only in the transplanted mice. The non-transplanted mouse livers were negative for CK, c-Met and DiD (Scale bar = 25 μm). A: CK: cytokeratin; B: c-Met; DAPI: 4',6-diamidino-2-phenylindole.
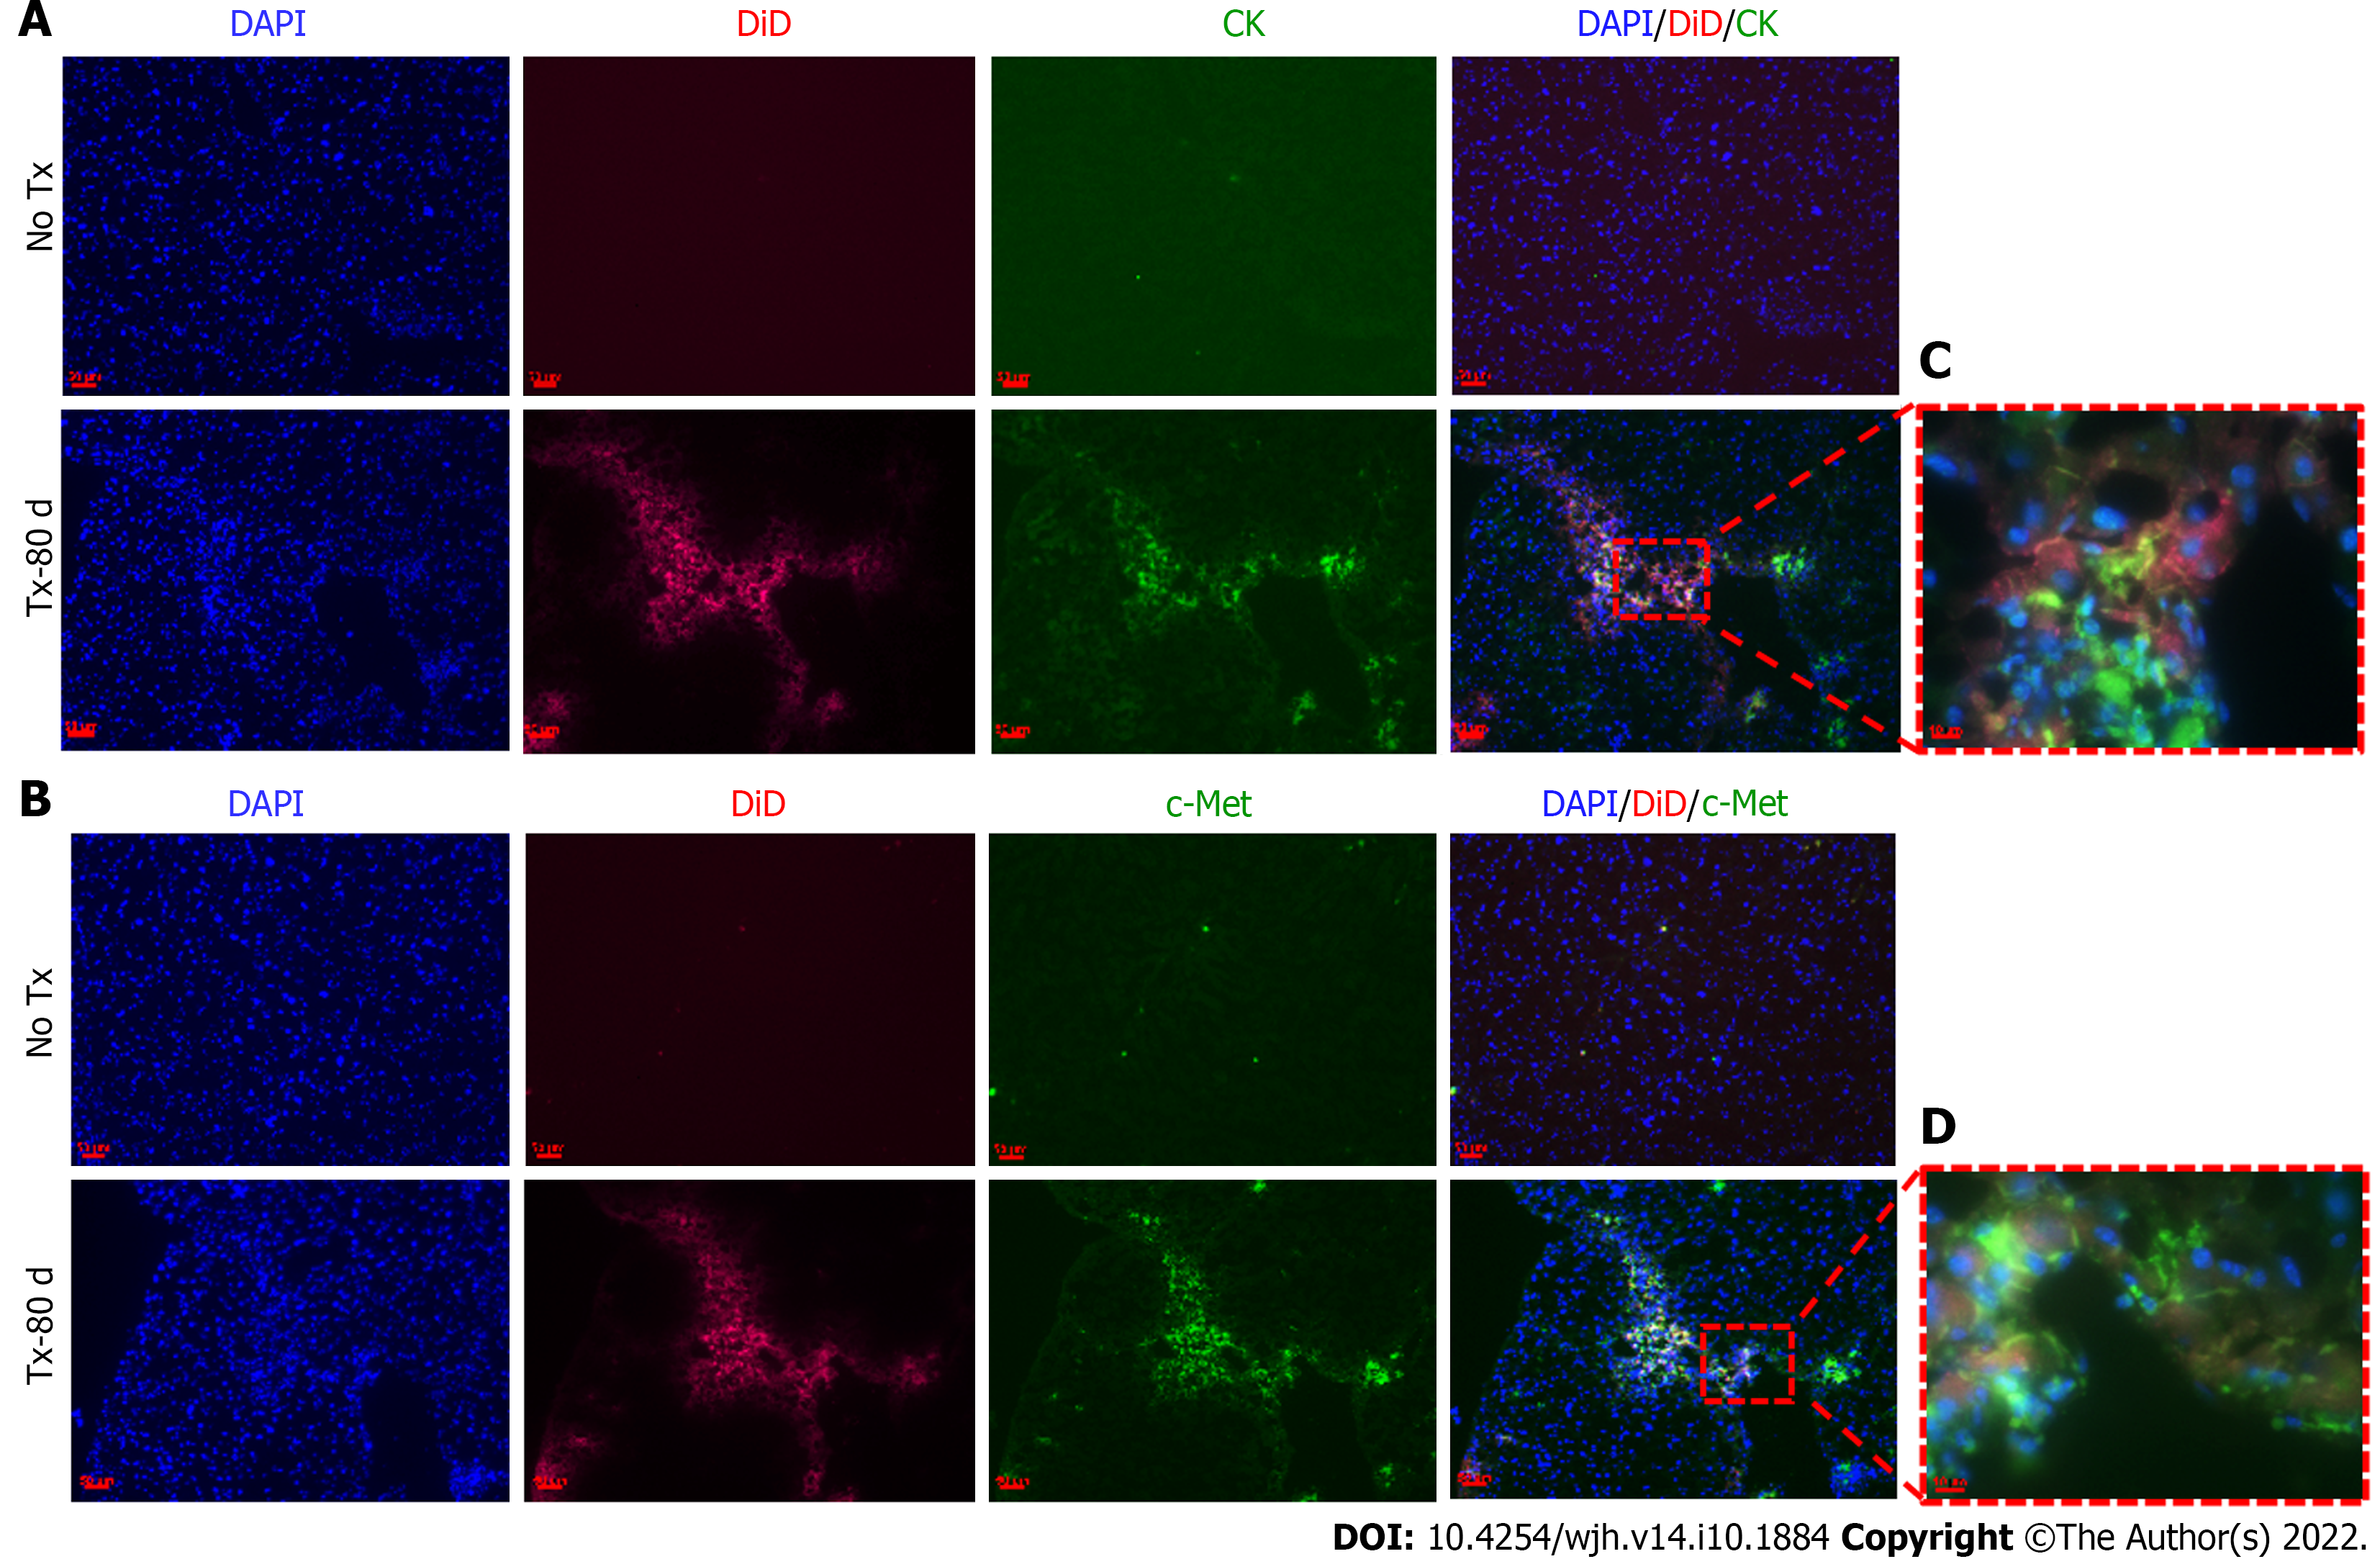
Figure 5 Detection of hepatic markers in transplanted mouse livers 80 d post-transplantation.
A and B: Fluorescent microscopic images of mouse liver tissue cryosections that continue to show DiD signals 80 d post-transplantation and show co-expression of CK and c-Met only in the transplanted (TX-80 d) mouse livers, but not in the non-transplanted (No-TX) livers (scale bar = 50 μm); C and D: 63 × images showing the colocalization of CK and c-Met staining with DiD labeling, respectively (Scale bar = 50 μm and 10 μm). CK: cytokeratin; DAPI: 4',6-diamidino-2-phenylindole.
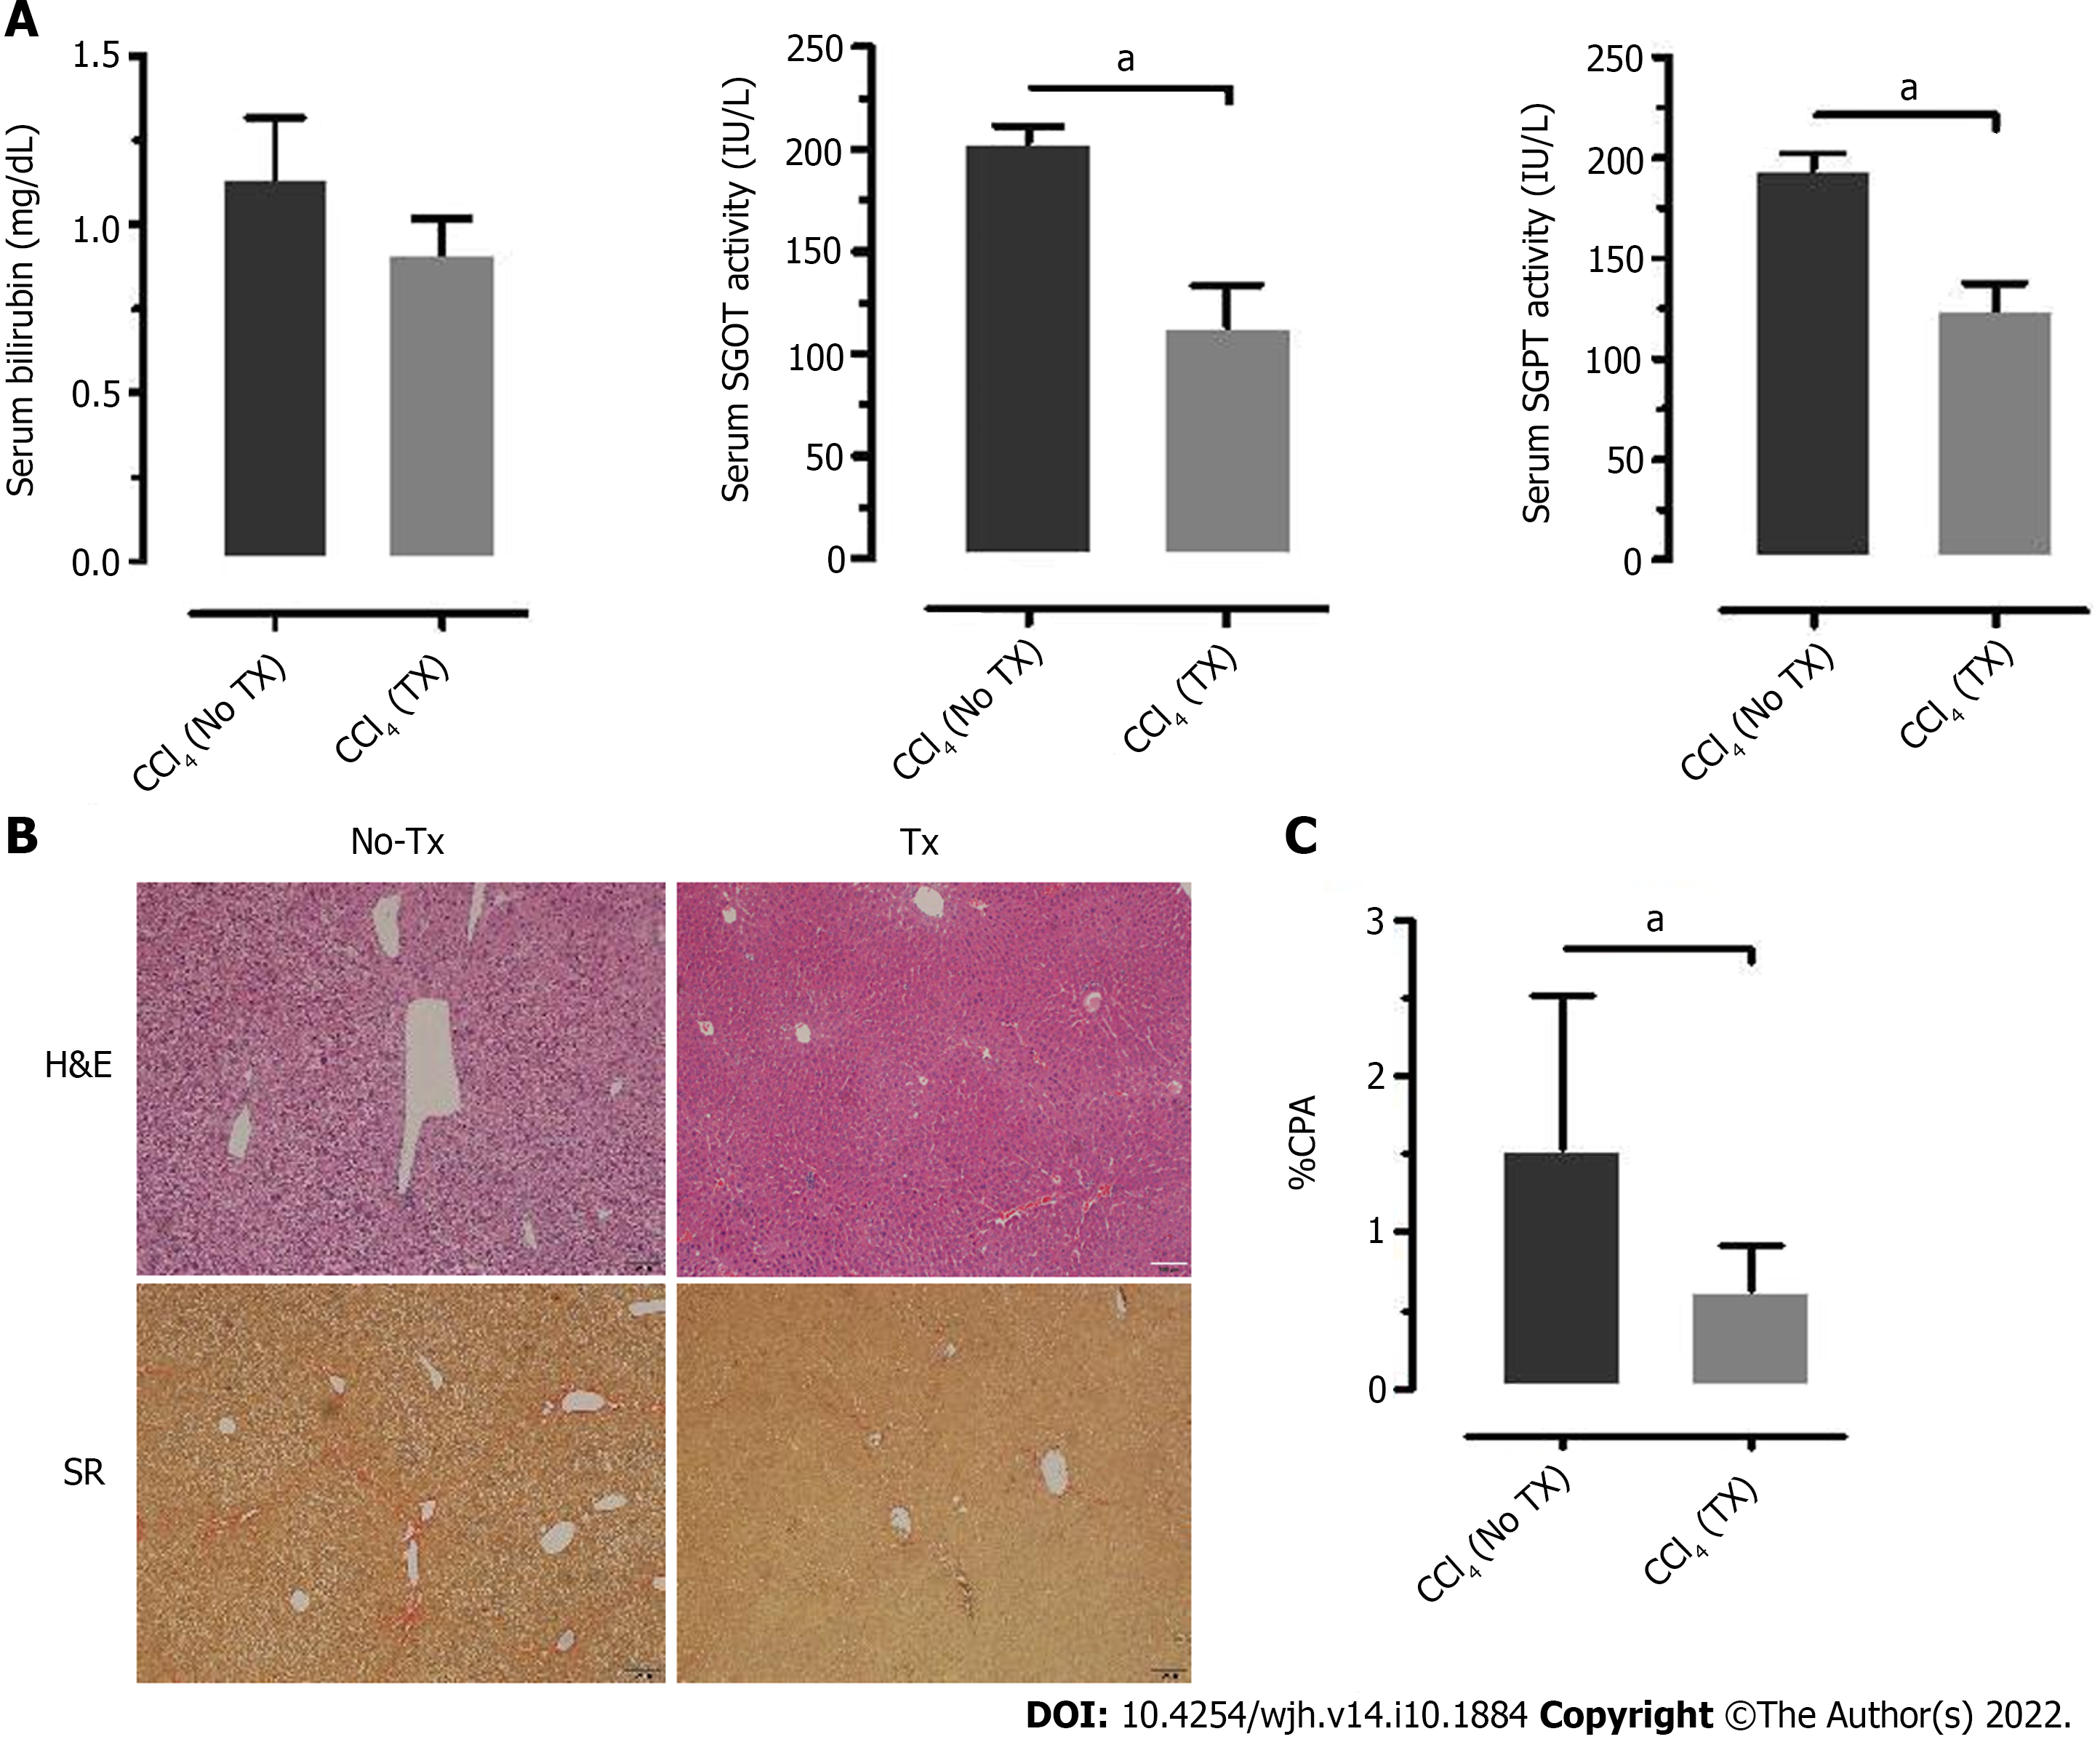
Figure 6 Liver enzyme and histology assessment of improved liver function parameters.
A: Analysis of serum bilirubin, serum glutamic-oxaloacetic transaminase, (SGOT) and serum glutamate-pyruvate transaminase (SGPT) measured 15 d post-transplantation (TX) and compared to the non-transplanted (No-TX) mice (n = 4); B and C: Hematoxylin and Eosin (H&E) and Sirius Red staining of liver tissue sections of non-transplanted and transplanted mouse liver tissue at 30 d post-transplantation showed a significant decrease in collagen percent area in the transplanted mouse livers as compared to the non-transplanted mouse livers (aP < 0.001). H&E: Hematoxylin and Eosin; SR: Sirius Red.
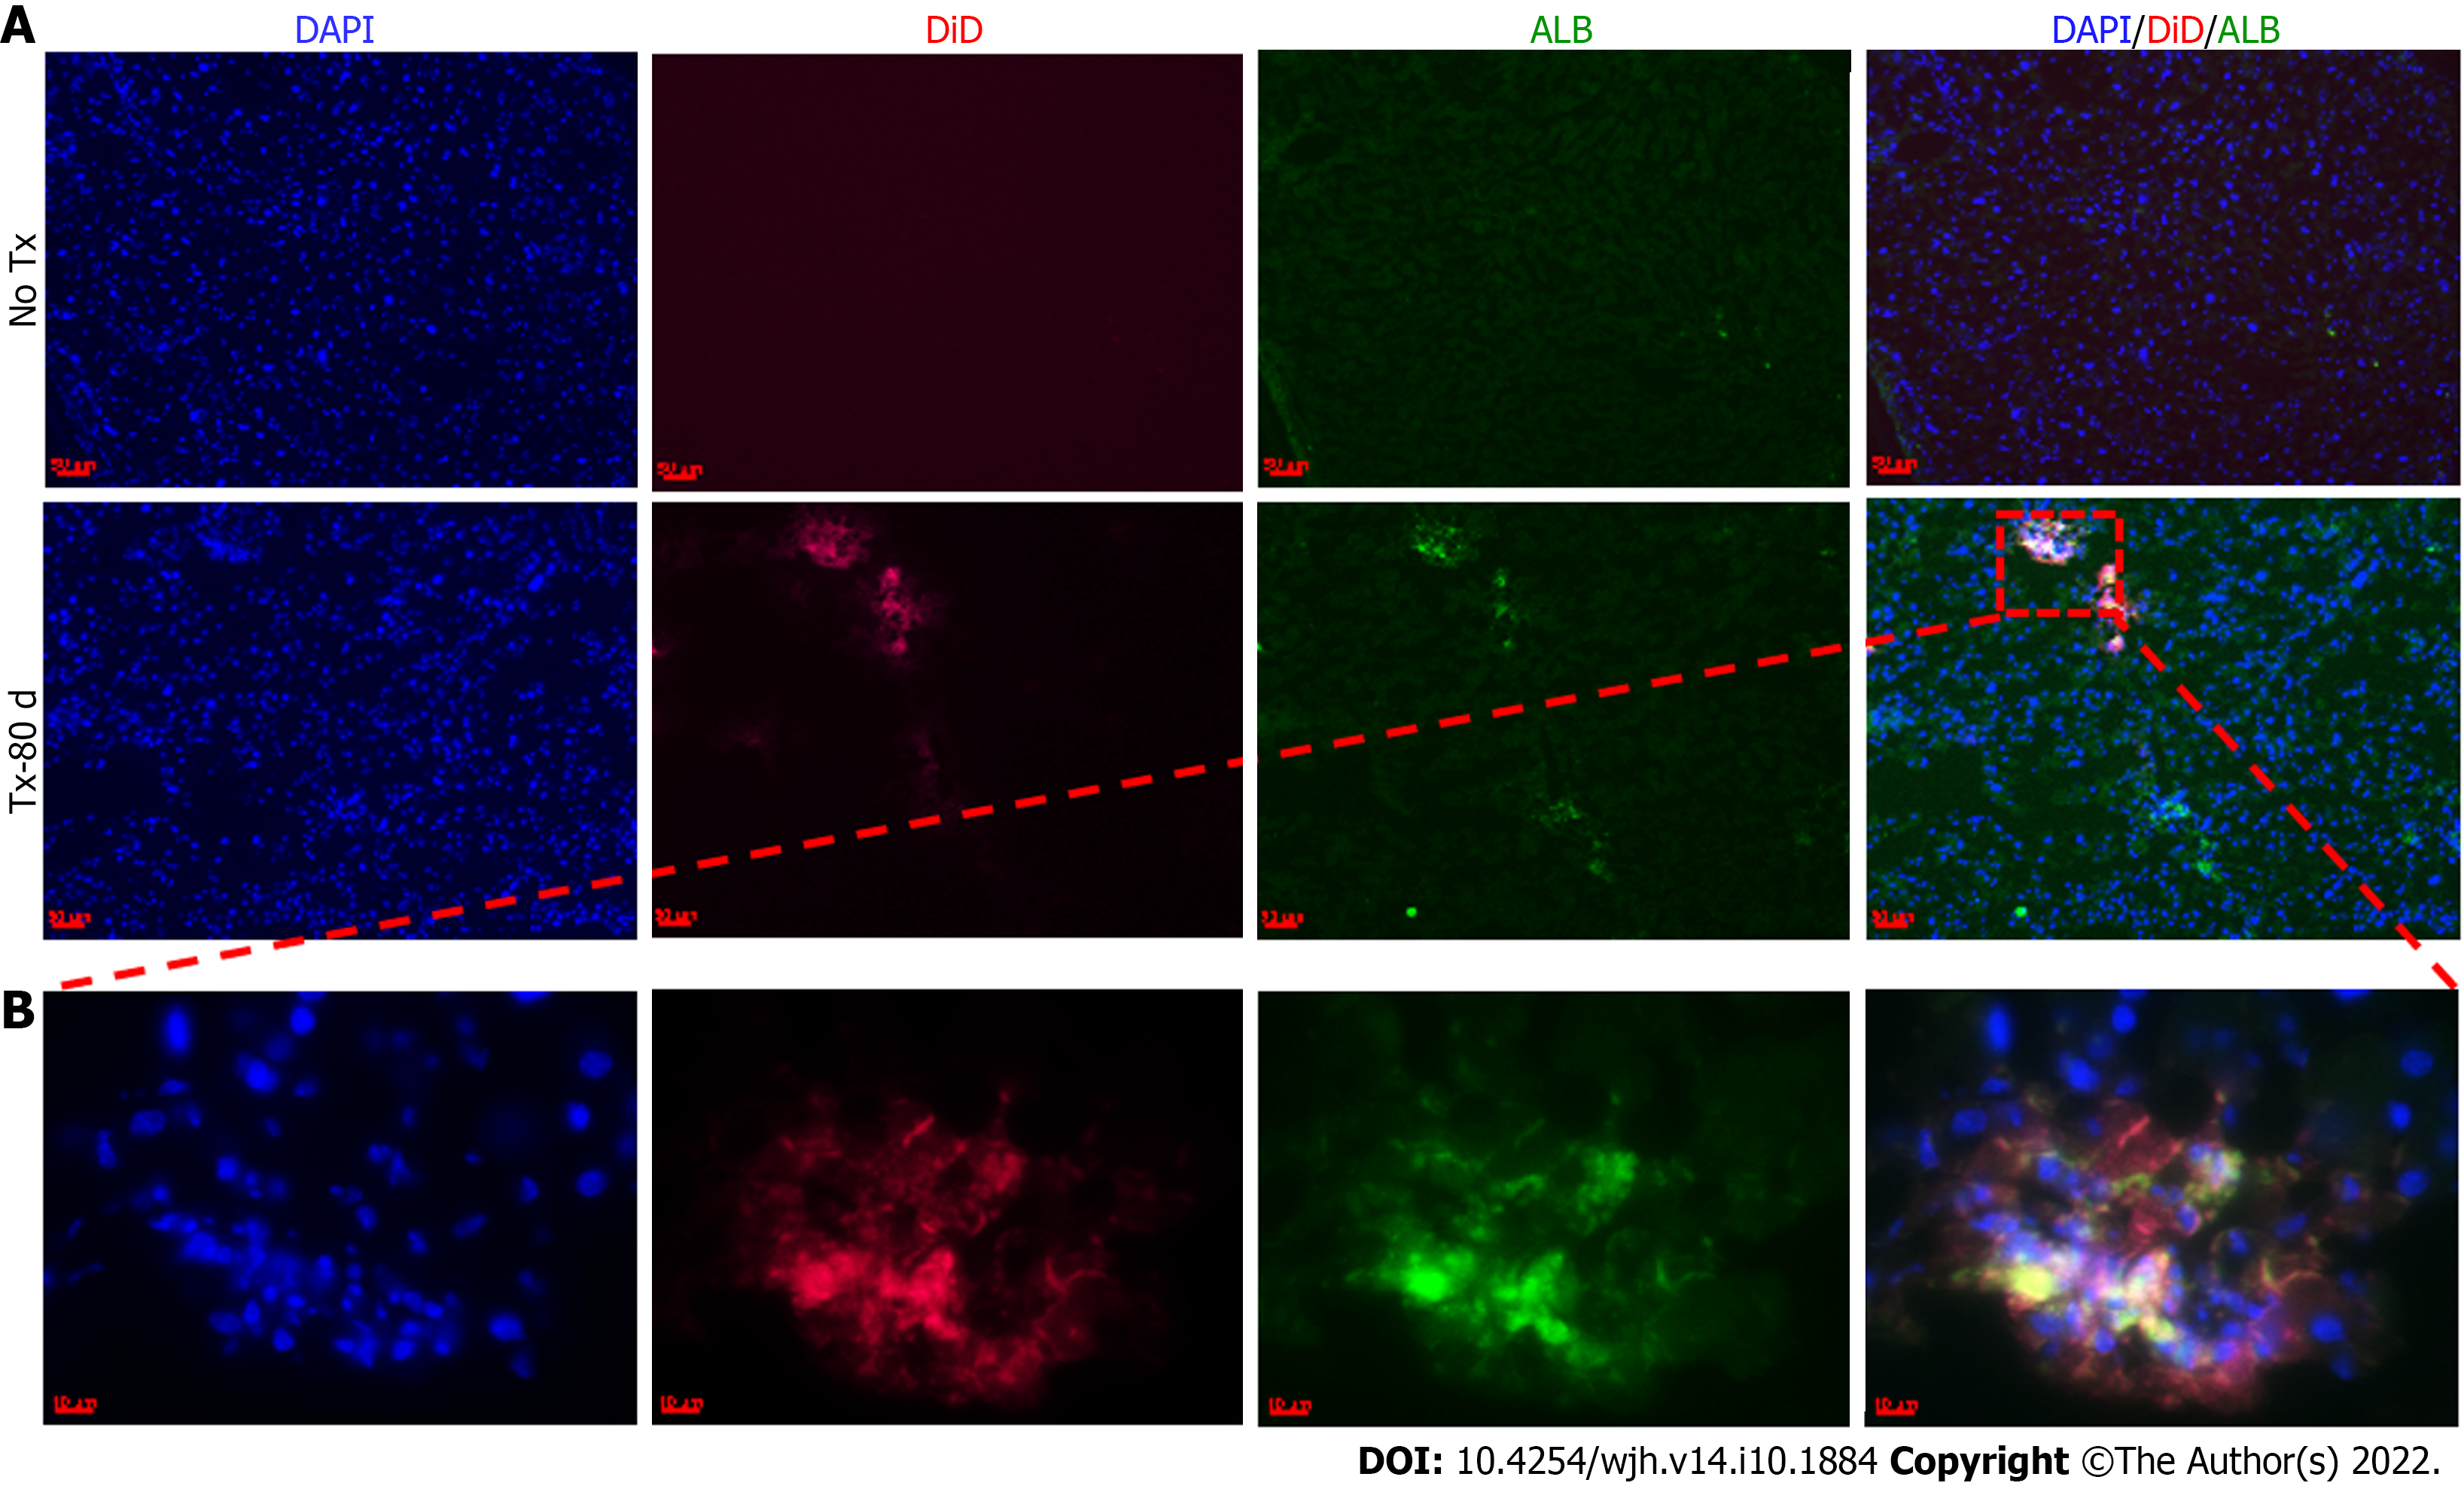
Figure 7 Expression of hu-ALB in the transplanted mouse livers.
Fluorescent microscopic images of mouse liver tissues expressing hu-ALB colocalized with DiD, 80 d post-transplantation. The non-transplanted mouse livers (No-TX) are devoid of any expression (10 ×), while the transplanted livers (TX-80 d) show specific zones of expression (10 × and 63 ×) (Scale bar = 50 μm and 10 μm). A: 10 ×, B: 63 ×. ALB: albumin; DAPI: 4',6-diamidino-2-phenylindole.
- Citation: Tripura C, Gunda S, Vishwakarma SK, Thatipalli AR, Jose J, Jerald MK, Khan AA, Pande G. Long-term and non-invasive in vivo tracking of DiD dye-labeled human hepatic progenitors in chronic liver disease models. World J Hepatol 2022; 14(10): 1884-1898
- URL: https://www.wjgnet.com/1948-5182/full/v14/i10/1884.htm
- DOI: https://dx.doi.org/10.4254/wjh.v14.i10.1884


