Copyright
©The Author(s) 2021.
World J Hepatol. Jul 27, 2021; 13(7): 815-829
Published online Jul 27, 2021. doi: 10.4254/wjh.v13.i7.815
Published online Jul 27, 2021. doi: 10.4254/wjh.v13.i7.815
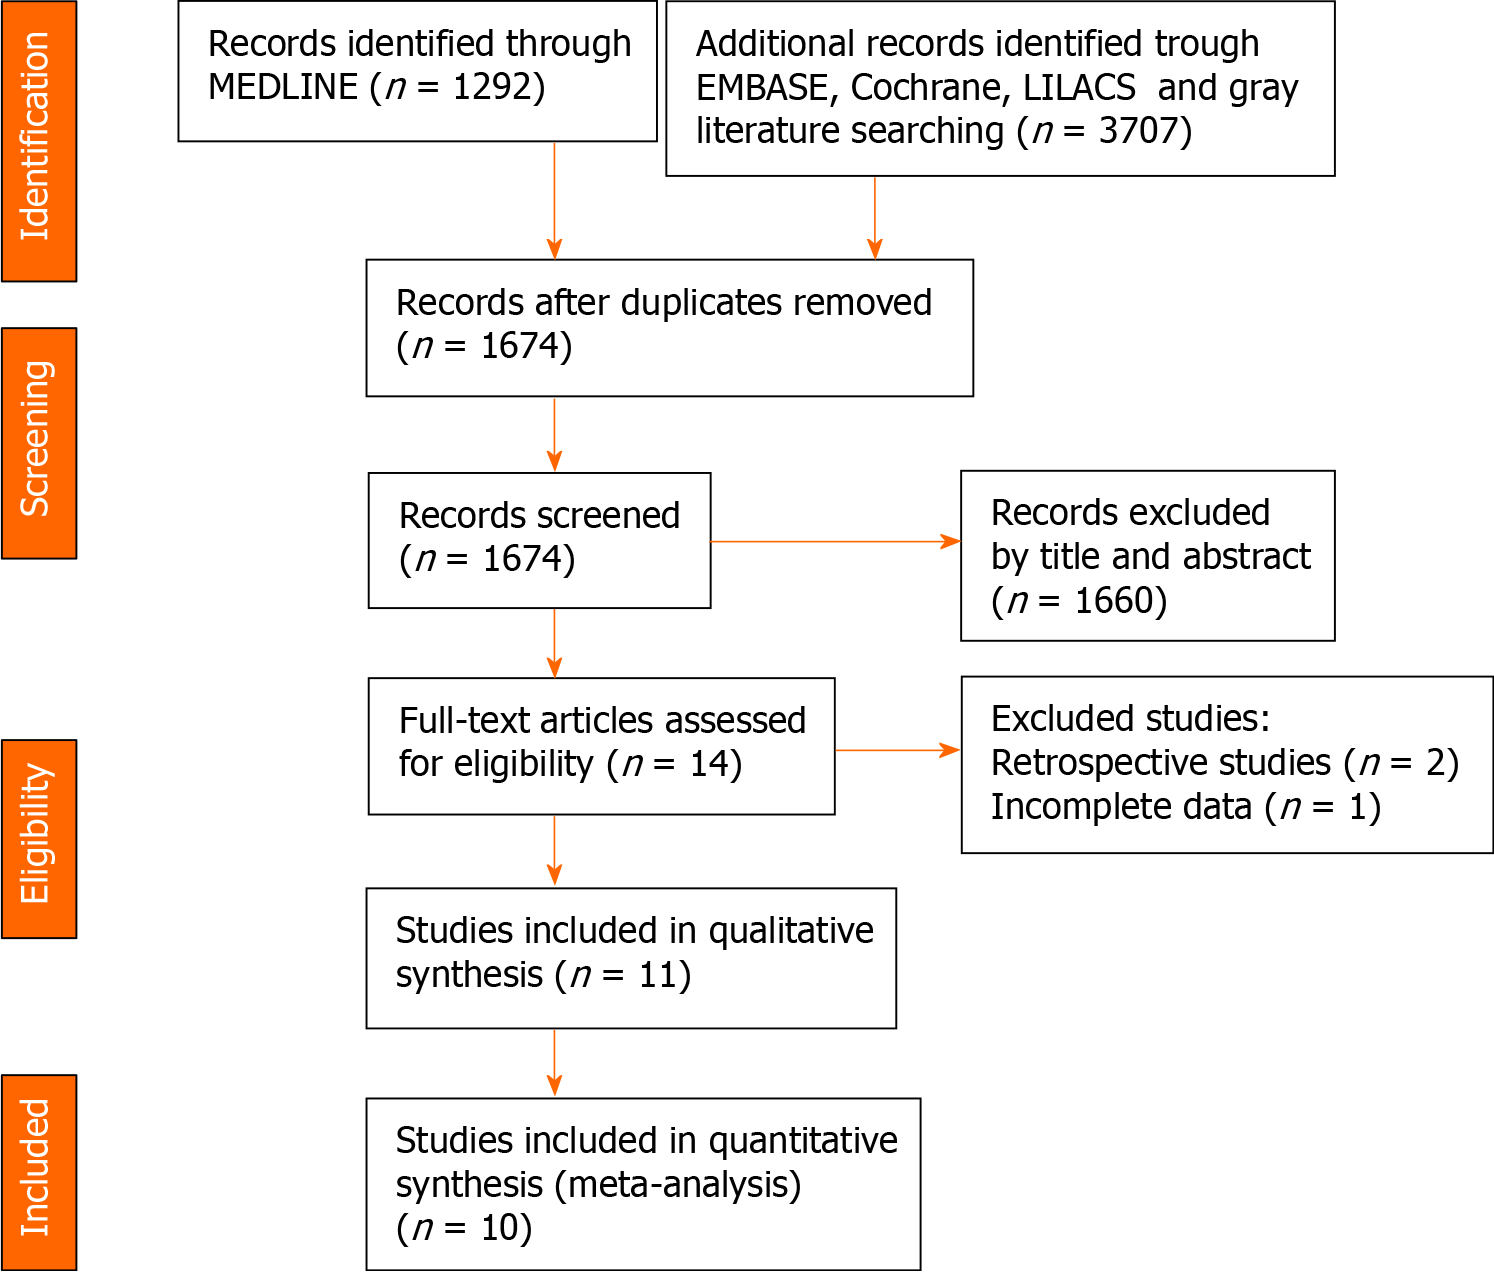
Figure 1 PRISMA flow diagram.
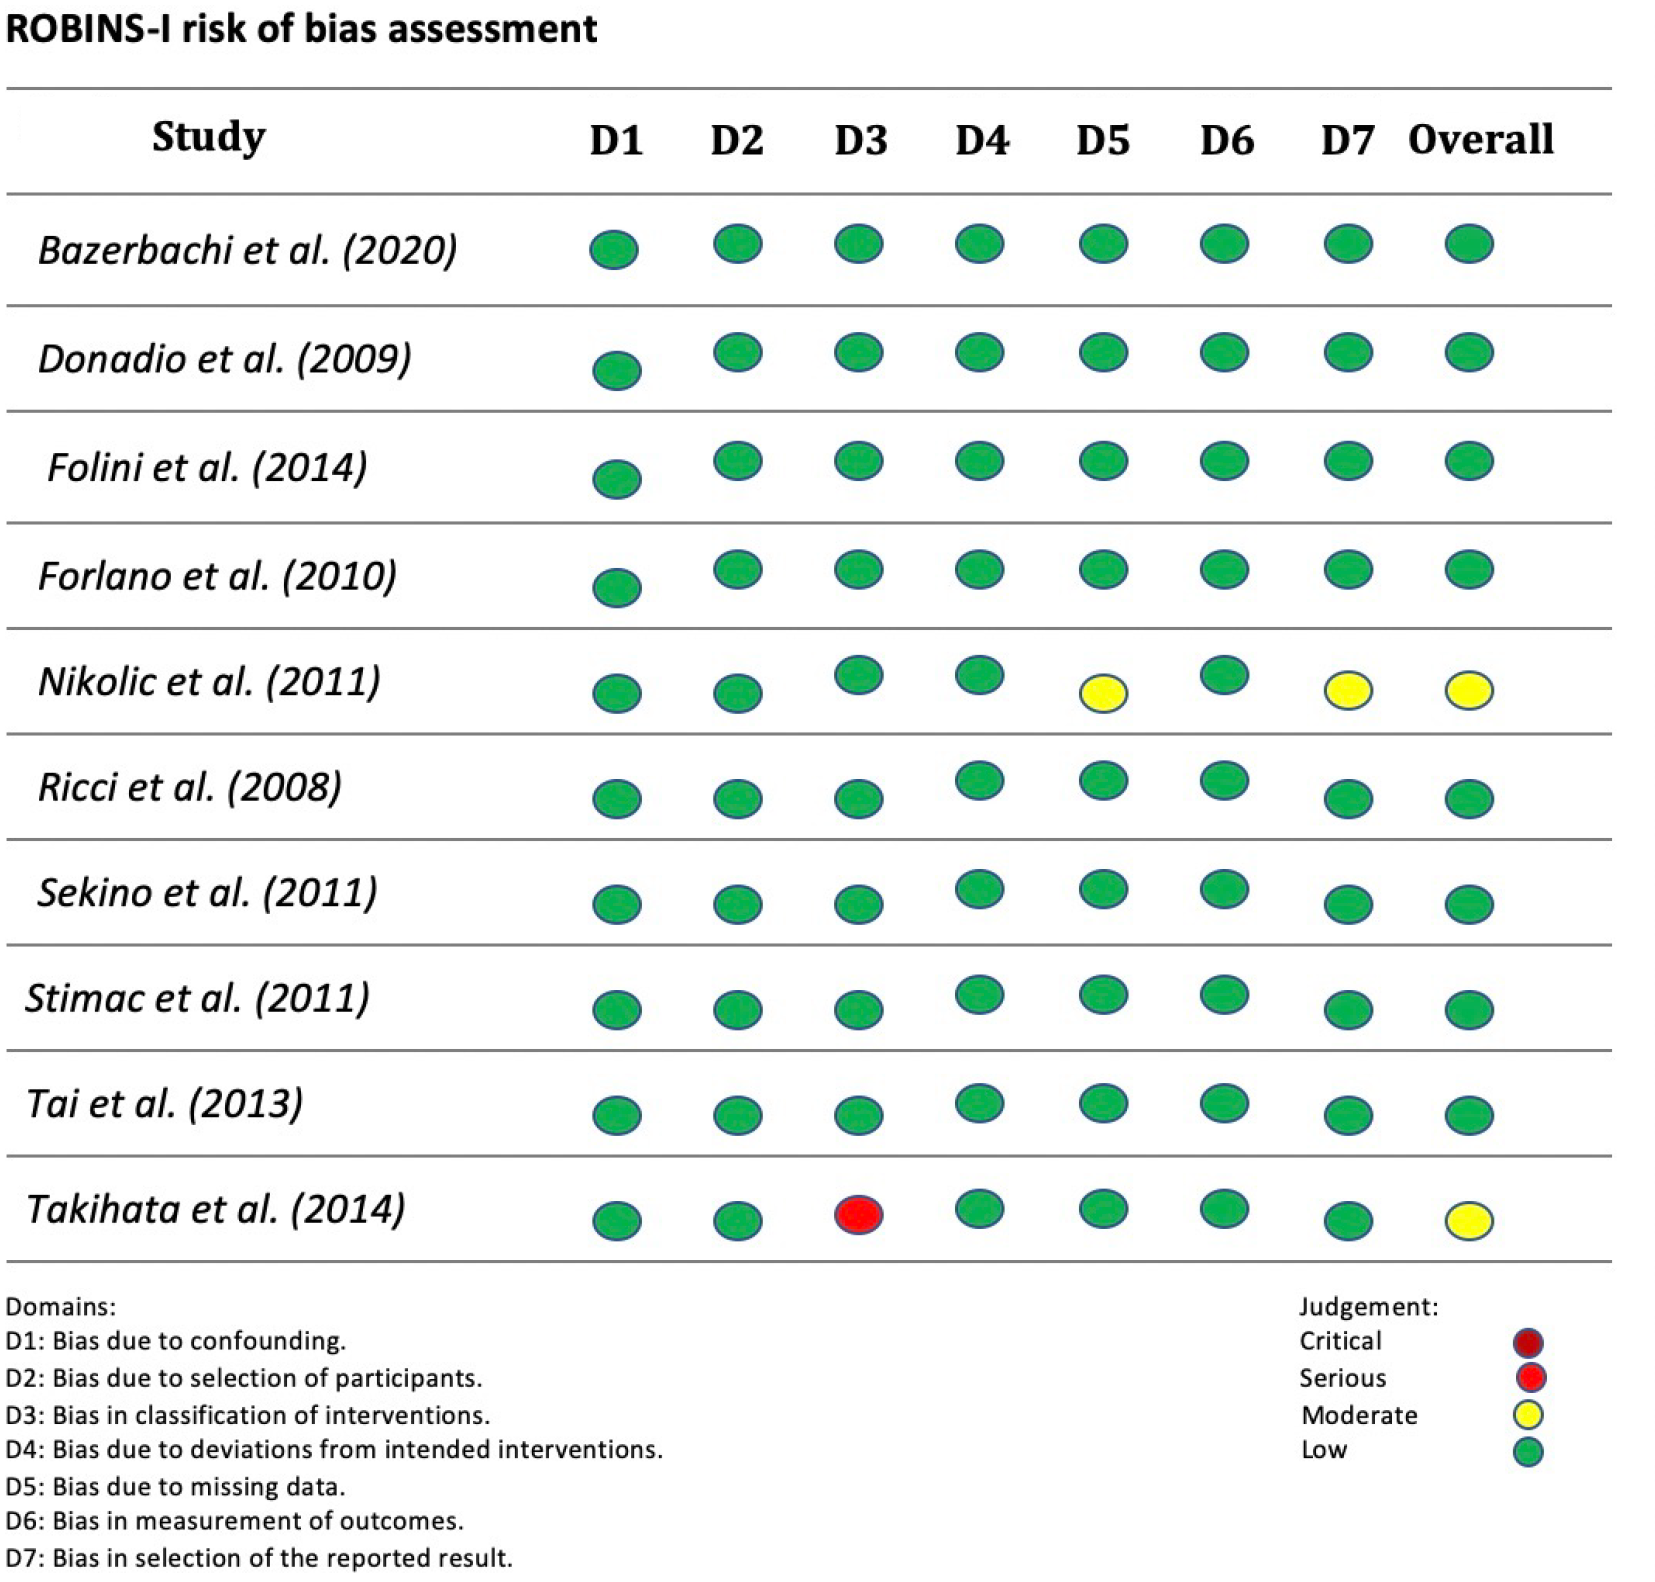
Figure 2 Risk of bias assessment (risk of bias in non-randomized studies-of interventions).
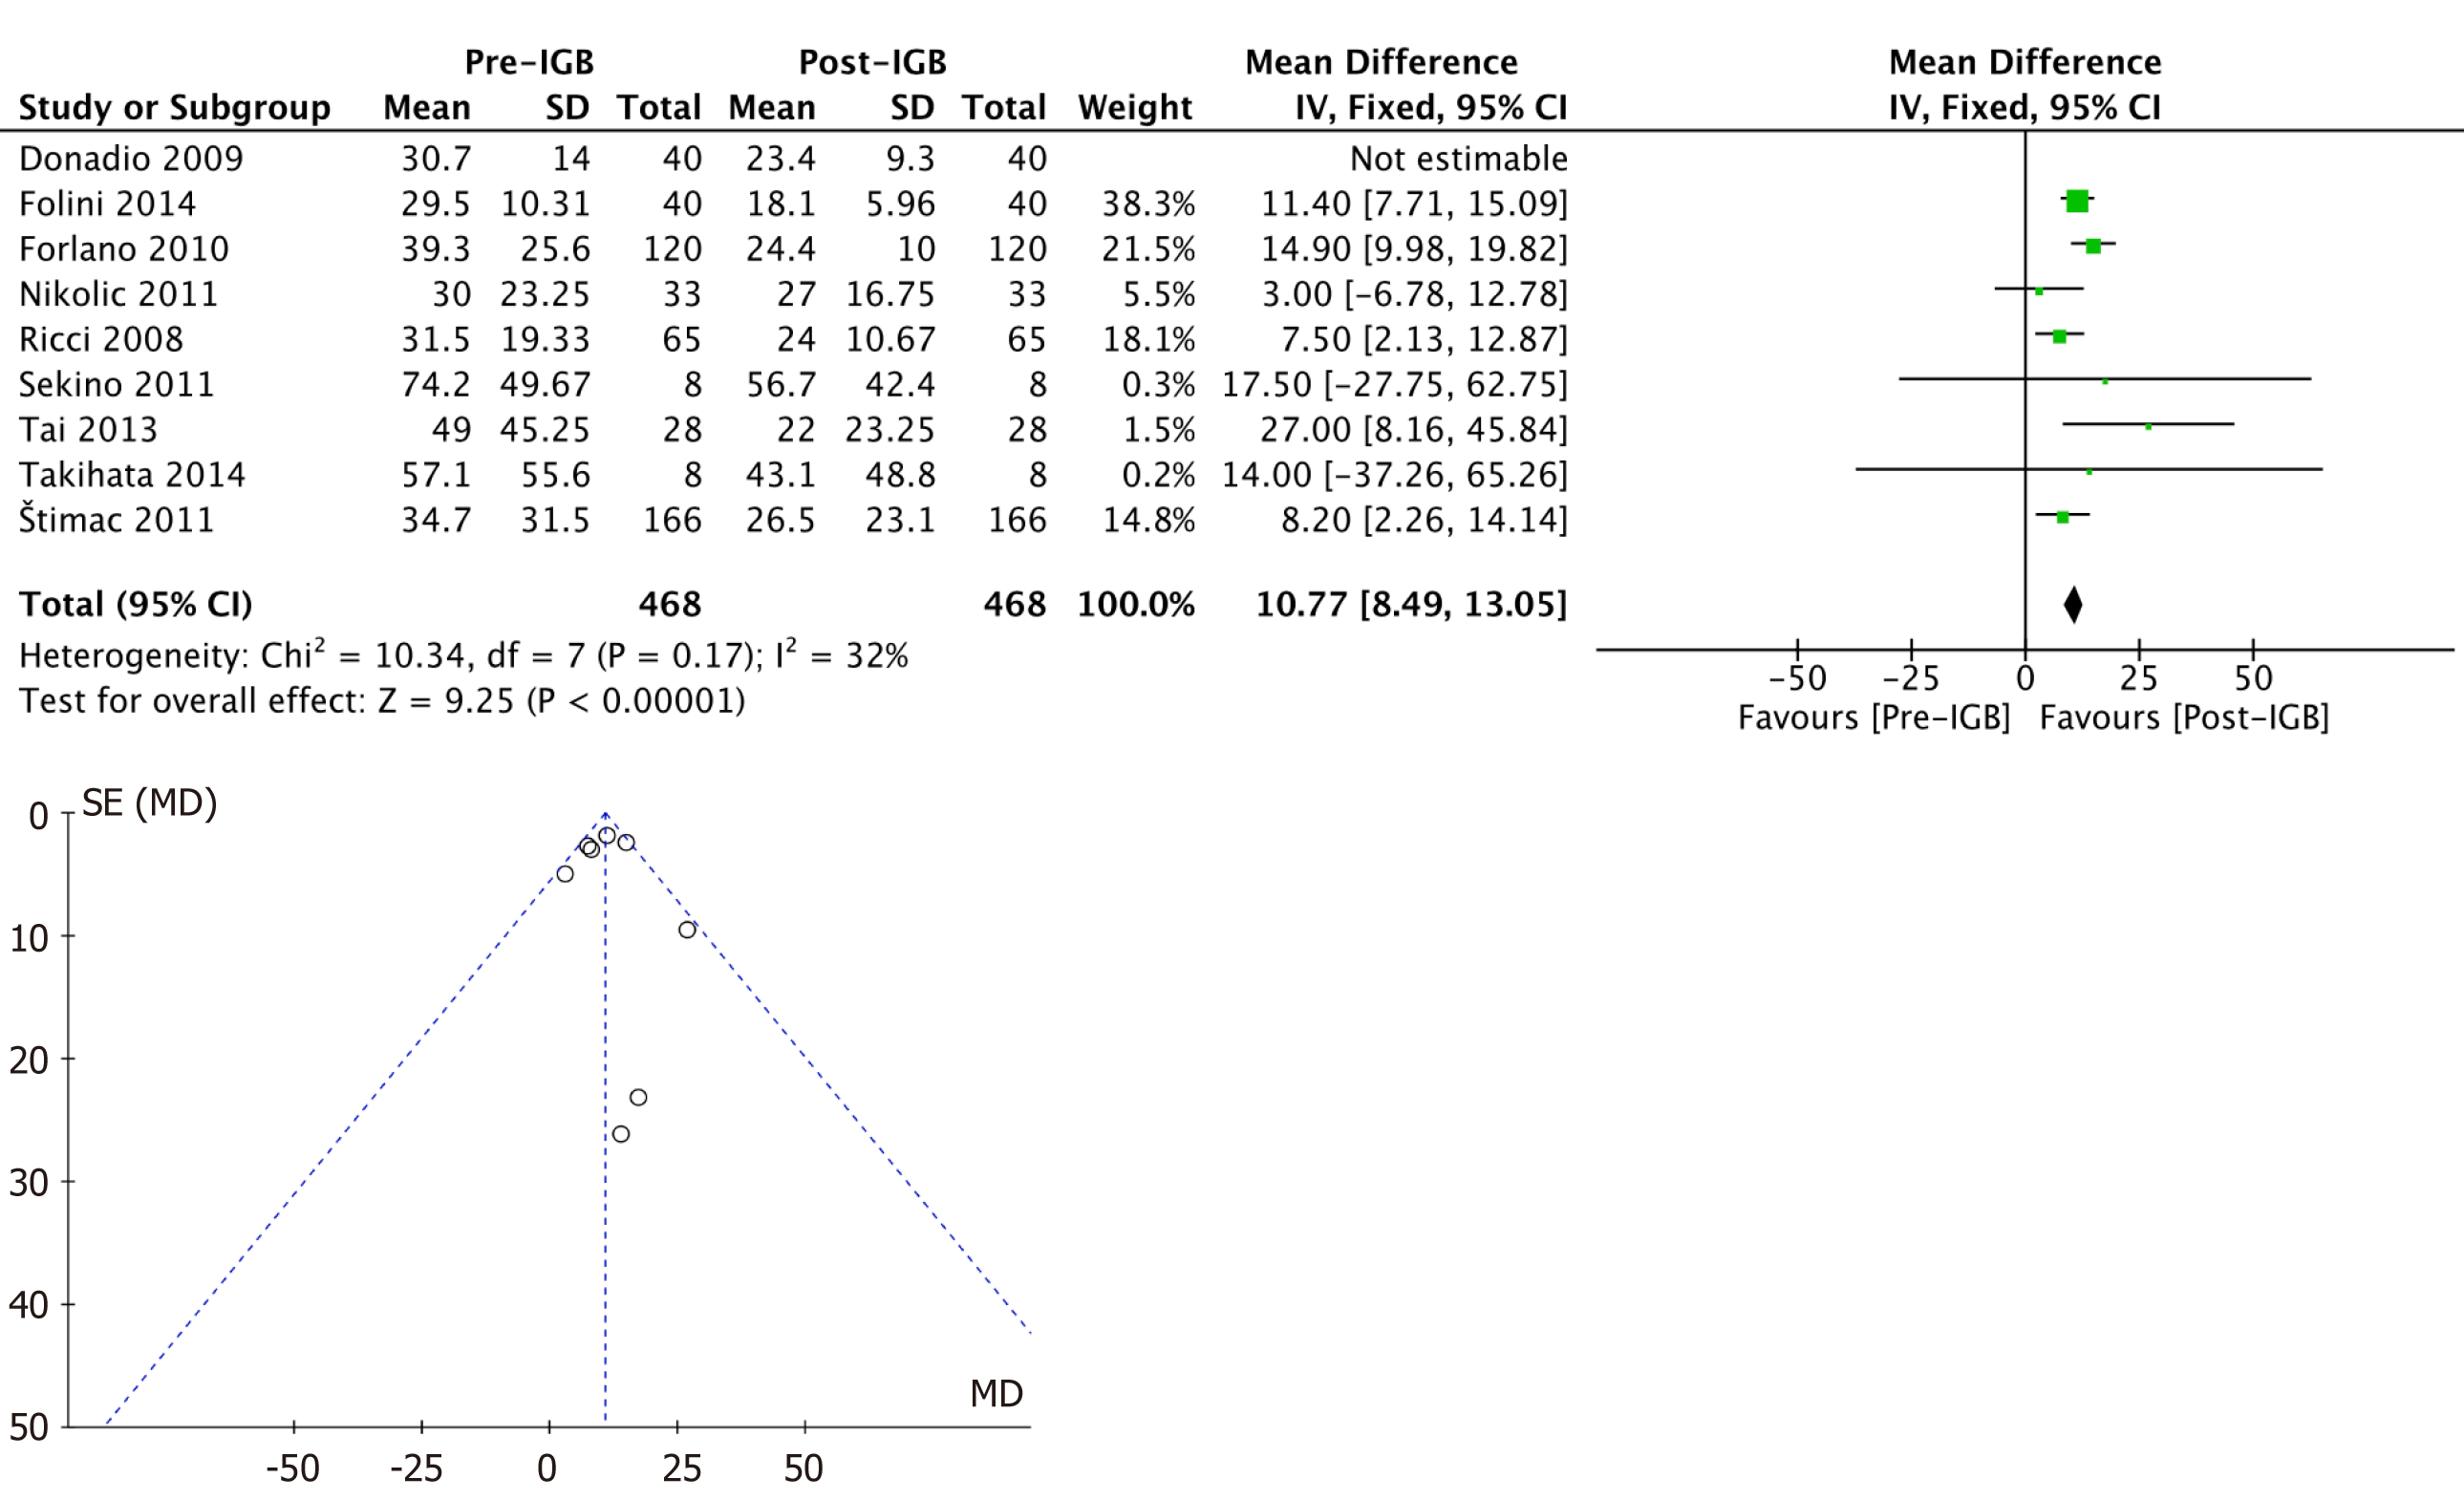
Figure 3 Forest plot of alanine aminotransferase and funnel plot without outlier.
CI: Confidence interval; IGB: Intragastric balloon.
Figure 4 Forest plot of gamma-glutamyltransferase.
CI: Confidence interval; IGB: Intragastric balloon.
Figure 5 Forest plot of glycated hemoglobin.
CI: Confidence interval; IGB: Intragastric balloon.
Figure 6 Forest plot of triglycerides.
CI: Confidence interval; IGB: Intragastric balloon.
Figure 7 Forest plot of systolic blood pressure.
CI: Confidence interval; IGB: Intragastric balloon.
Figure 8 Forest plot of homeostatic model assessment.
CI: Confidence interval; IGB: Intragastric balloon.
Figure 9 Forest plot of waist circumference.
CI: Confidence interval; IGB: Intragastric balloon.
Figure 10 Forest plot of body mass index.
CI: Confidence interval; IGB: Intragastric balloon.
Figure 11 Forest plot of liver volume.
CI: Confidence interval; IGB: Intragastric balloon.
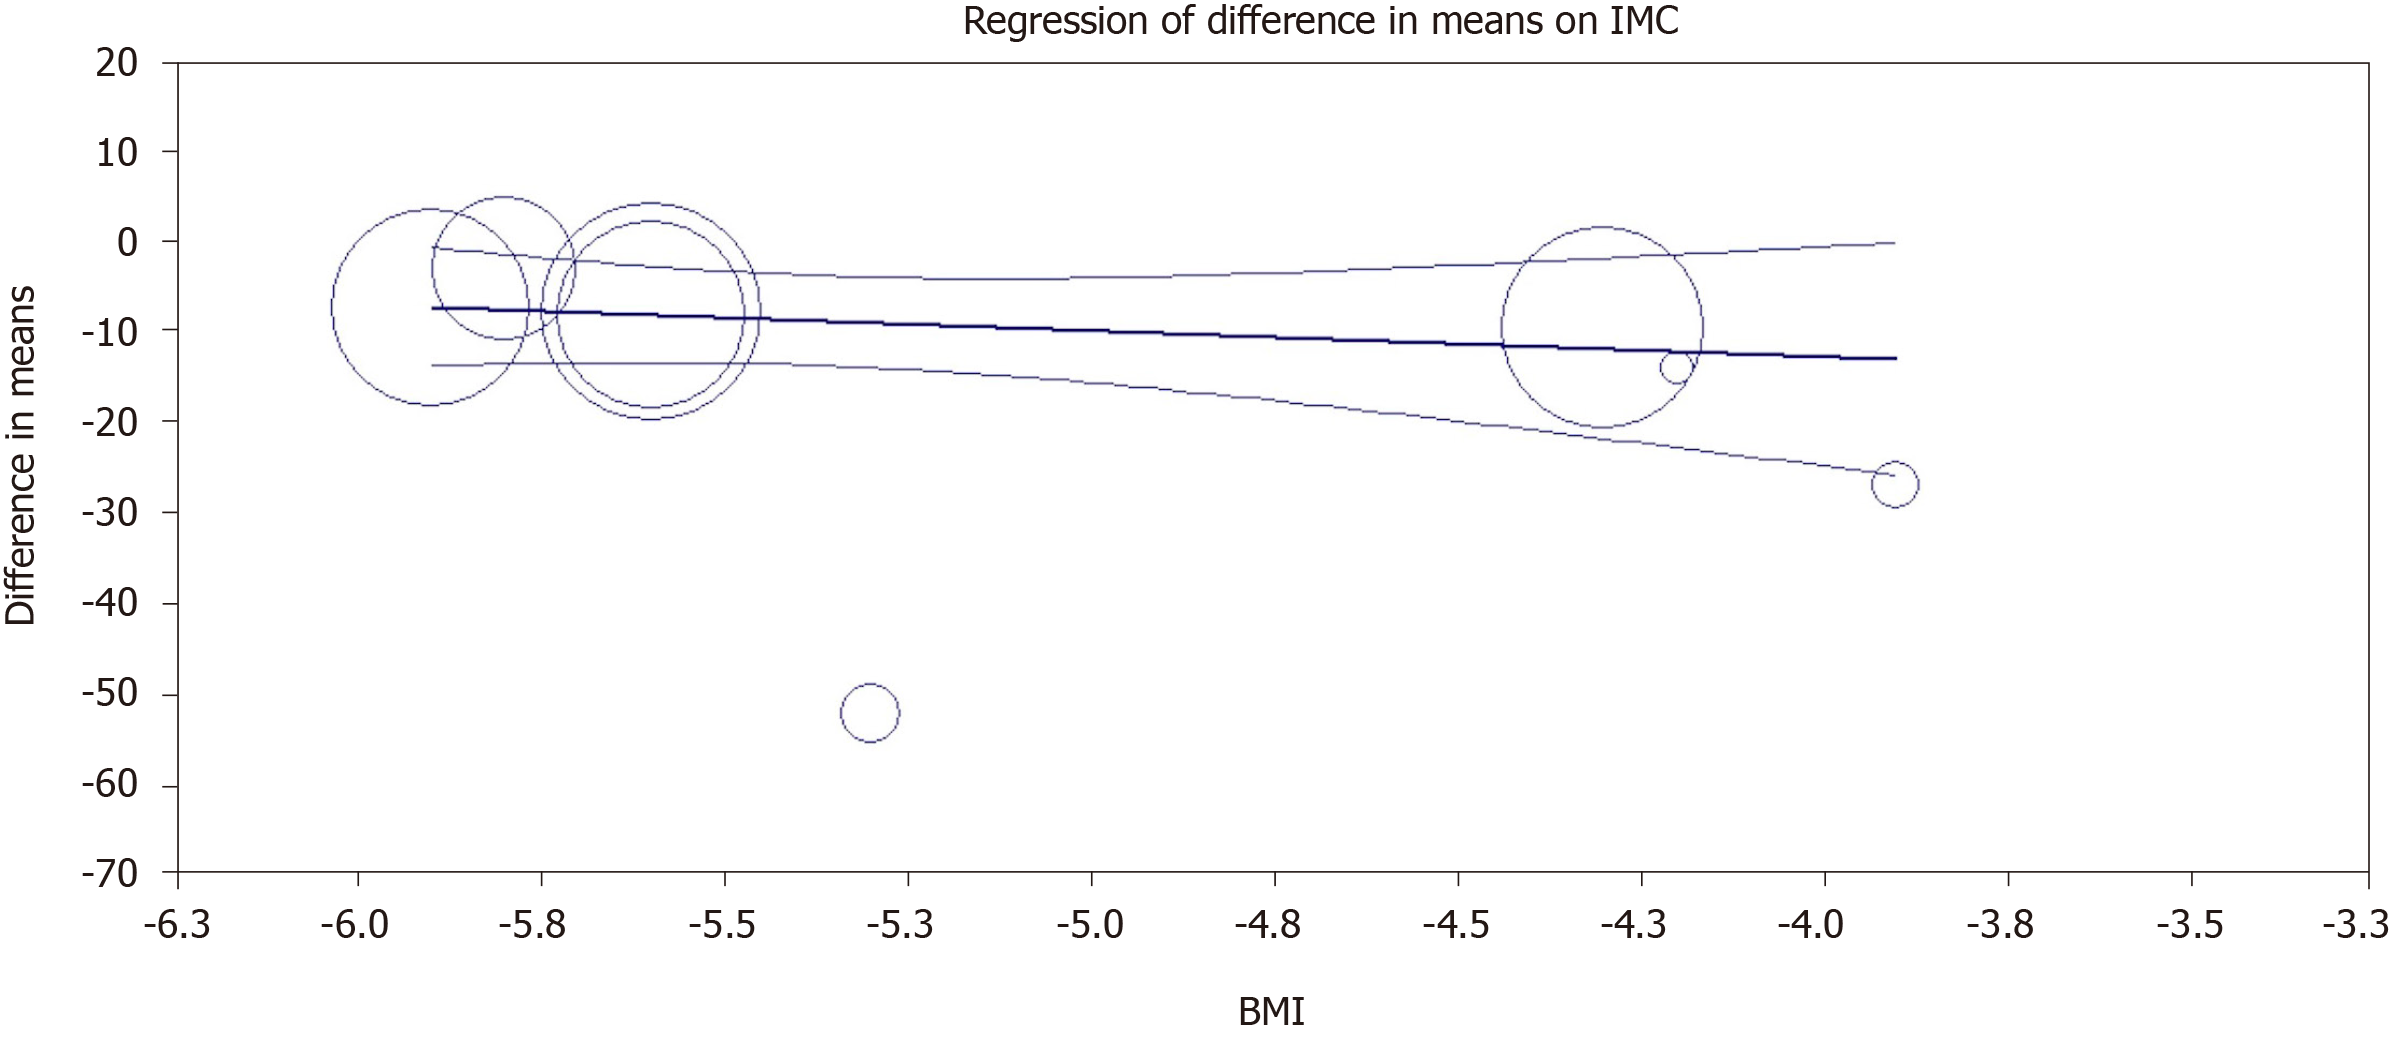
Figure 12 Meta-regression and the correlation between alanine aminotransferase and body mass index.
BMI: Body mass index.
- Citation: de Freitas Júnior JR, Ribeiro IB, de Moura DTH, Sagae VMT, de Souza GMV, de Oliveira GHP, Sánchez-Luna SA, de Souza TF, de Moura ETH, de Oliveira CPMS, Bernardo WM, de Moura EGH. Effects of intragastric balloon placement in metabolic dysfunction-associated fatty liver disease: A systematic review and meta-analysis. World J Hepatol 2021; 13(7): 815-829
- URL: https://www.wjgnet.com/1948-5182/full/v13/i7/815.htm
- DOI: https://dx.doi.org/10.4254/wjh.v13.i7.815


