Copyright
©The Author(s) 2021.
World J Hepatol. Jun 27, 2021; 13(6): 673-685
Published online Jun 27, 2021. doi: 10.4254/wjh.v13.i6.673
Published online Jun 27, 2021. doi: 10.4254/wjh.v13.i6.673
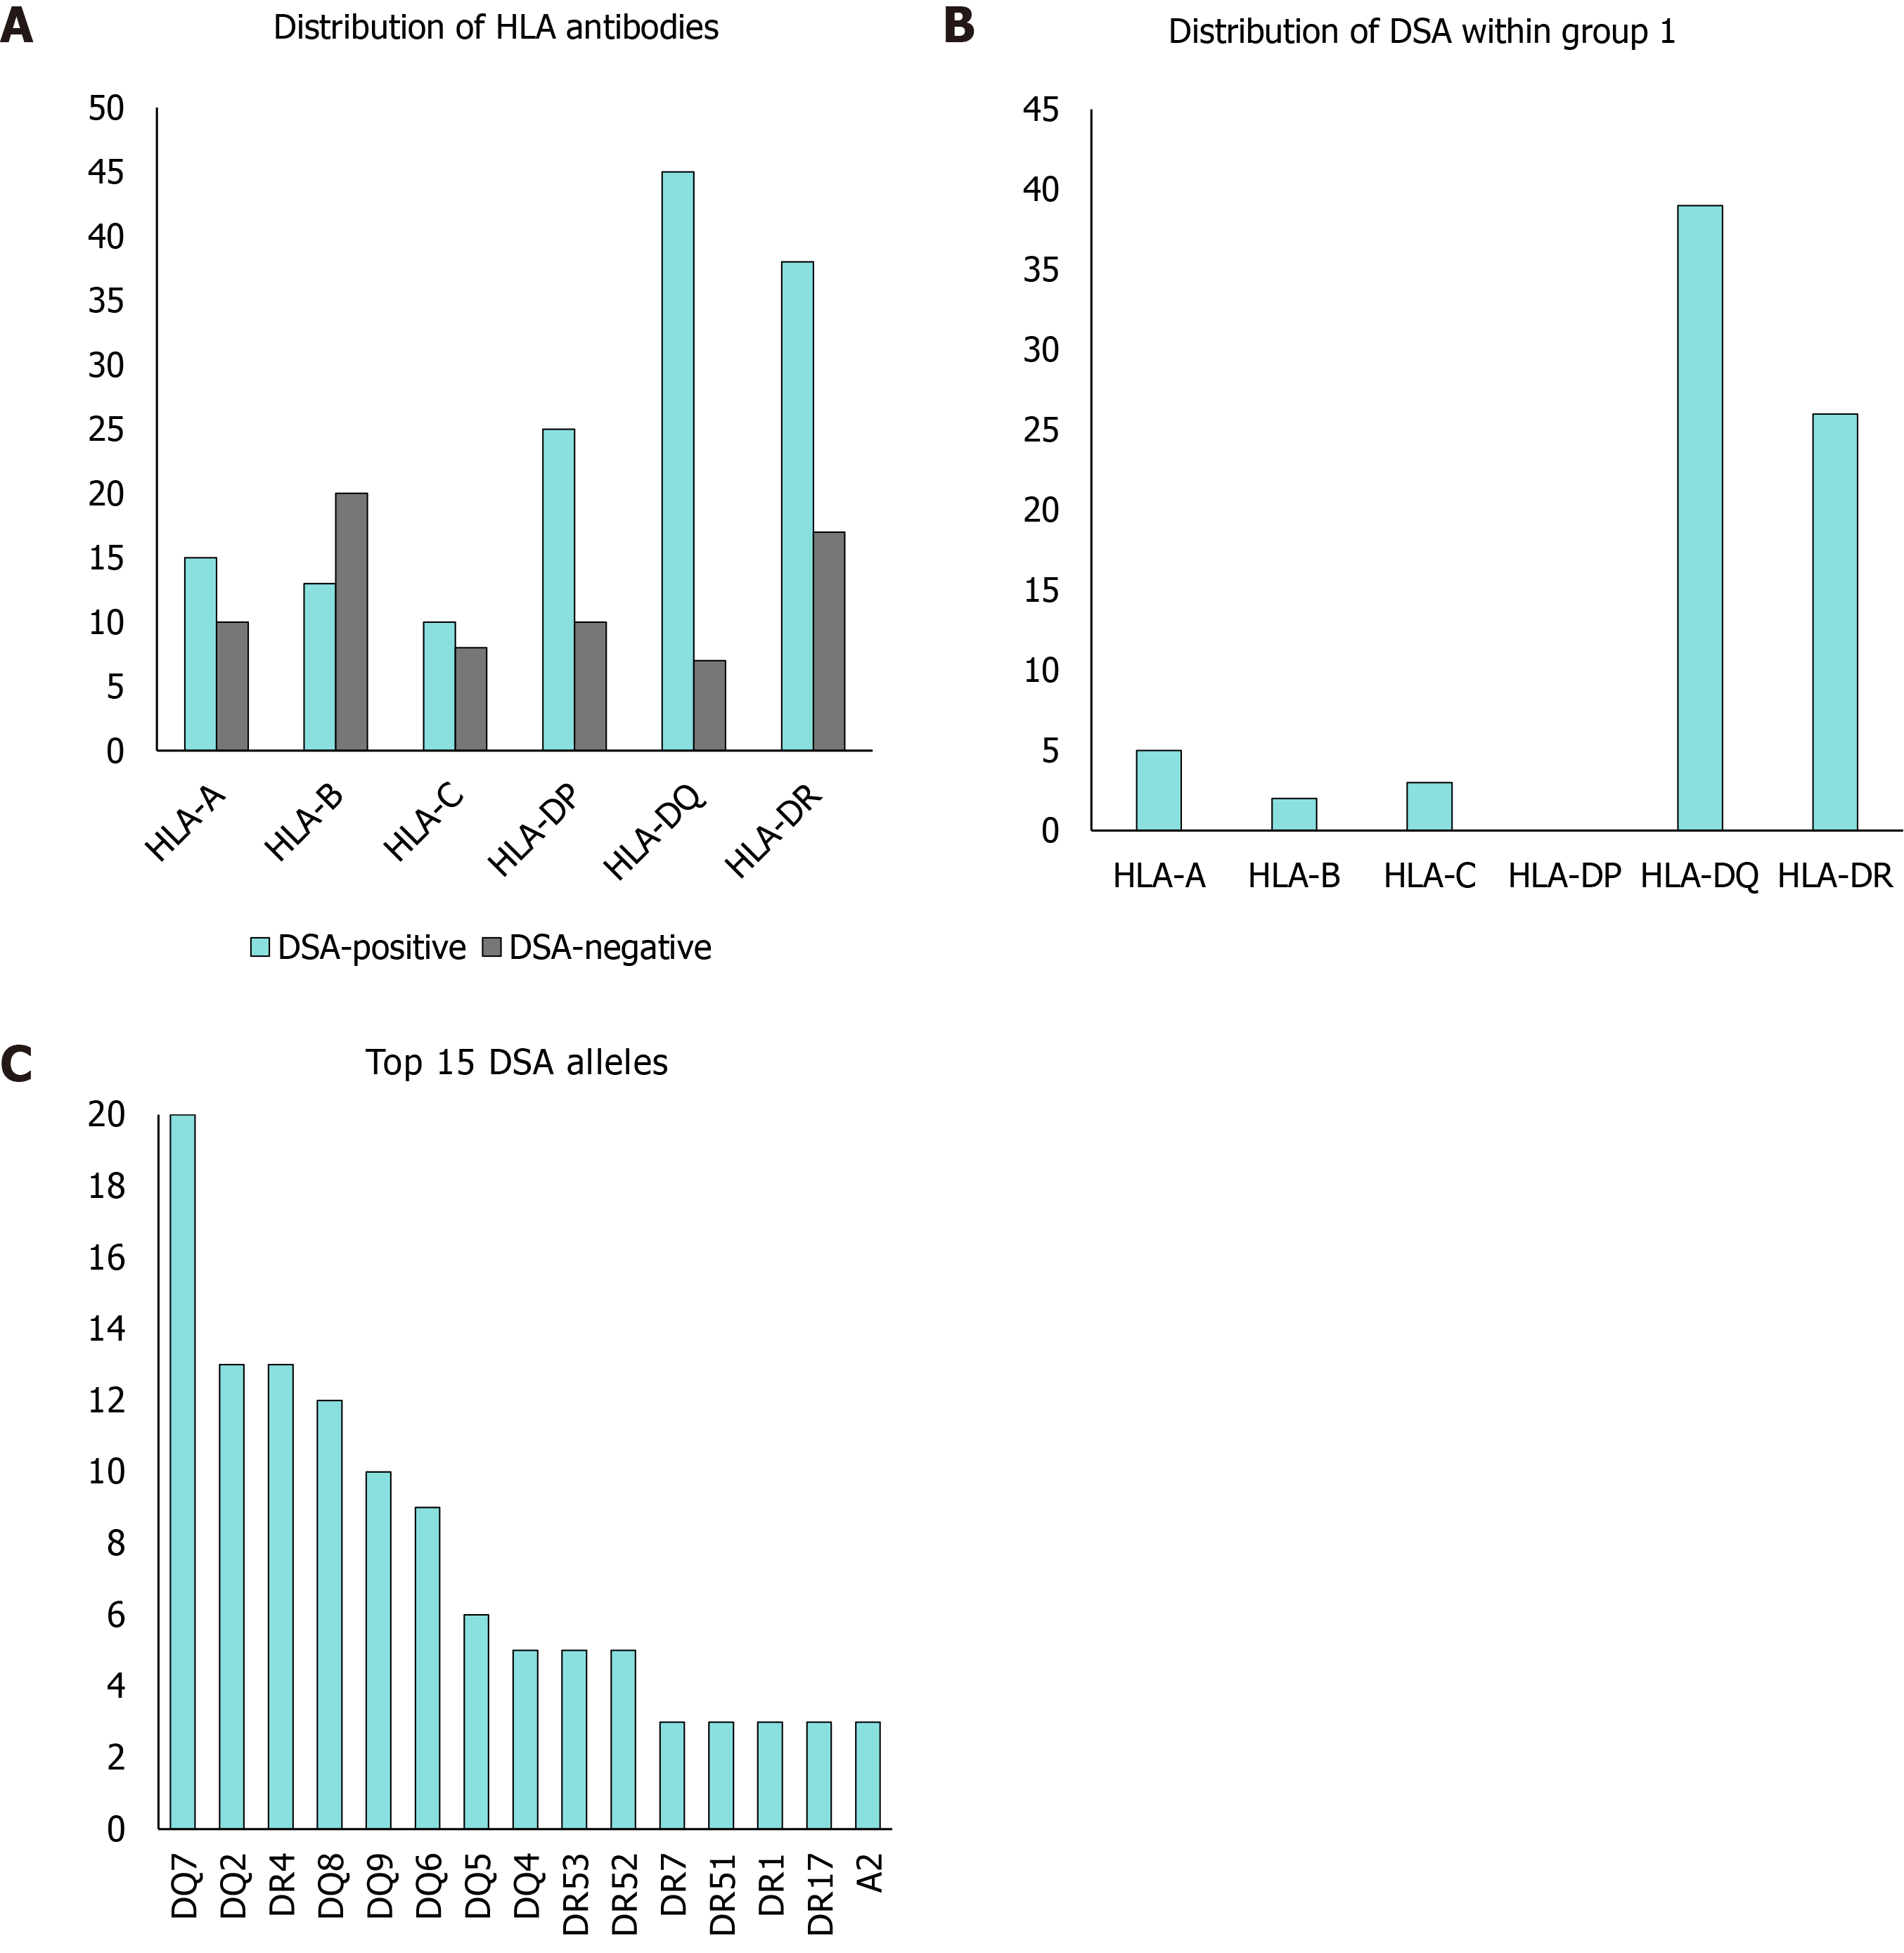
Figure 1 Allele distribution.
A: Distribution of human leucocyte antigen (HLA) antibodies; B: Distribution of donor-specific antibodies (DSAs) within group 1; C: Top 15 DSA alleles. Vertical axis: numbers, quantitative; horizontal axis: categories of anti-HLA antibodies and subcategories of DSAs; columns: DSA-positive patients shown in green, DSA-negative patients shown in light grey. HLA: Human leucocyte antigen; DSA: Donor-specific antibody.
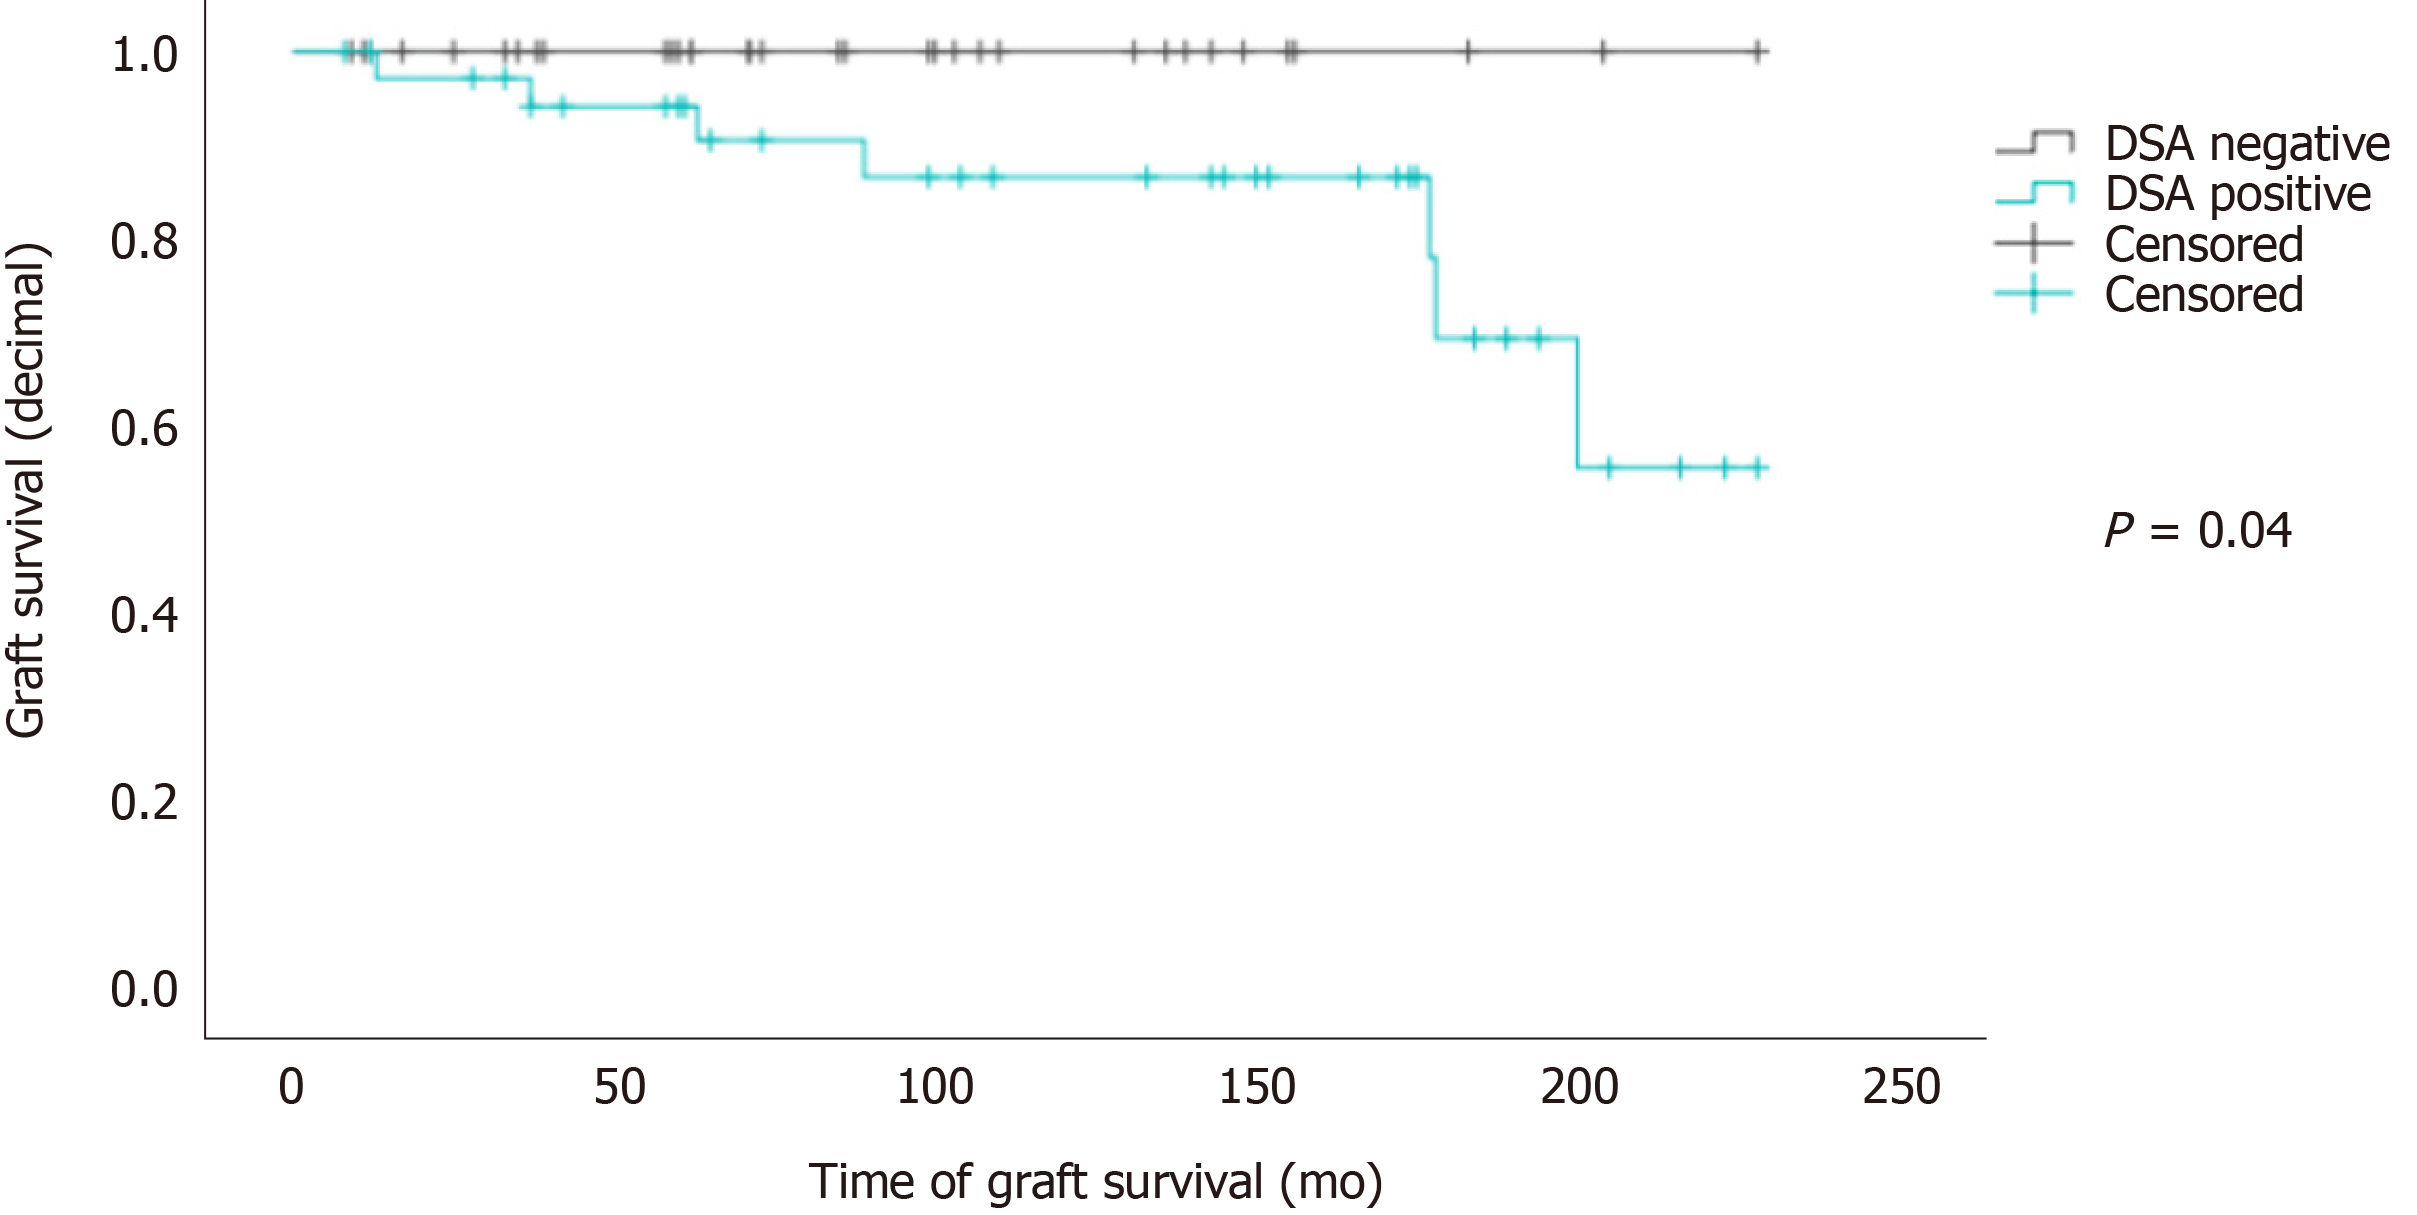
Figure 2 Donor-specific antibody presences on graft survival.
Kaplan-Meyer survival plot; vertical axis: Graft survival (decimal); horizontal axis: Time of graft survival (months); graphs: Donor-specific antibody (DSA)-negative patients are shown in dark grey, numbers at risk n = 34; DSA-positive patients are shown in green, numbers at risk n = 38. DSA: Donor-specific antibody.
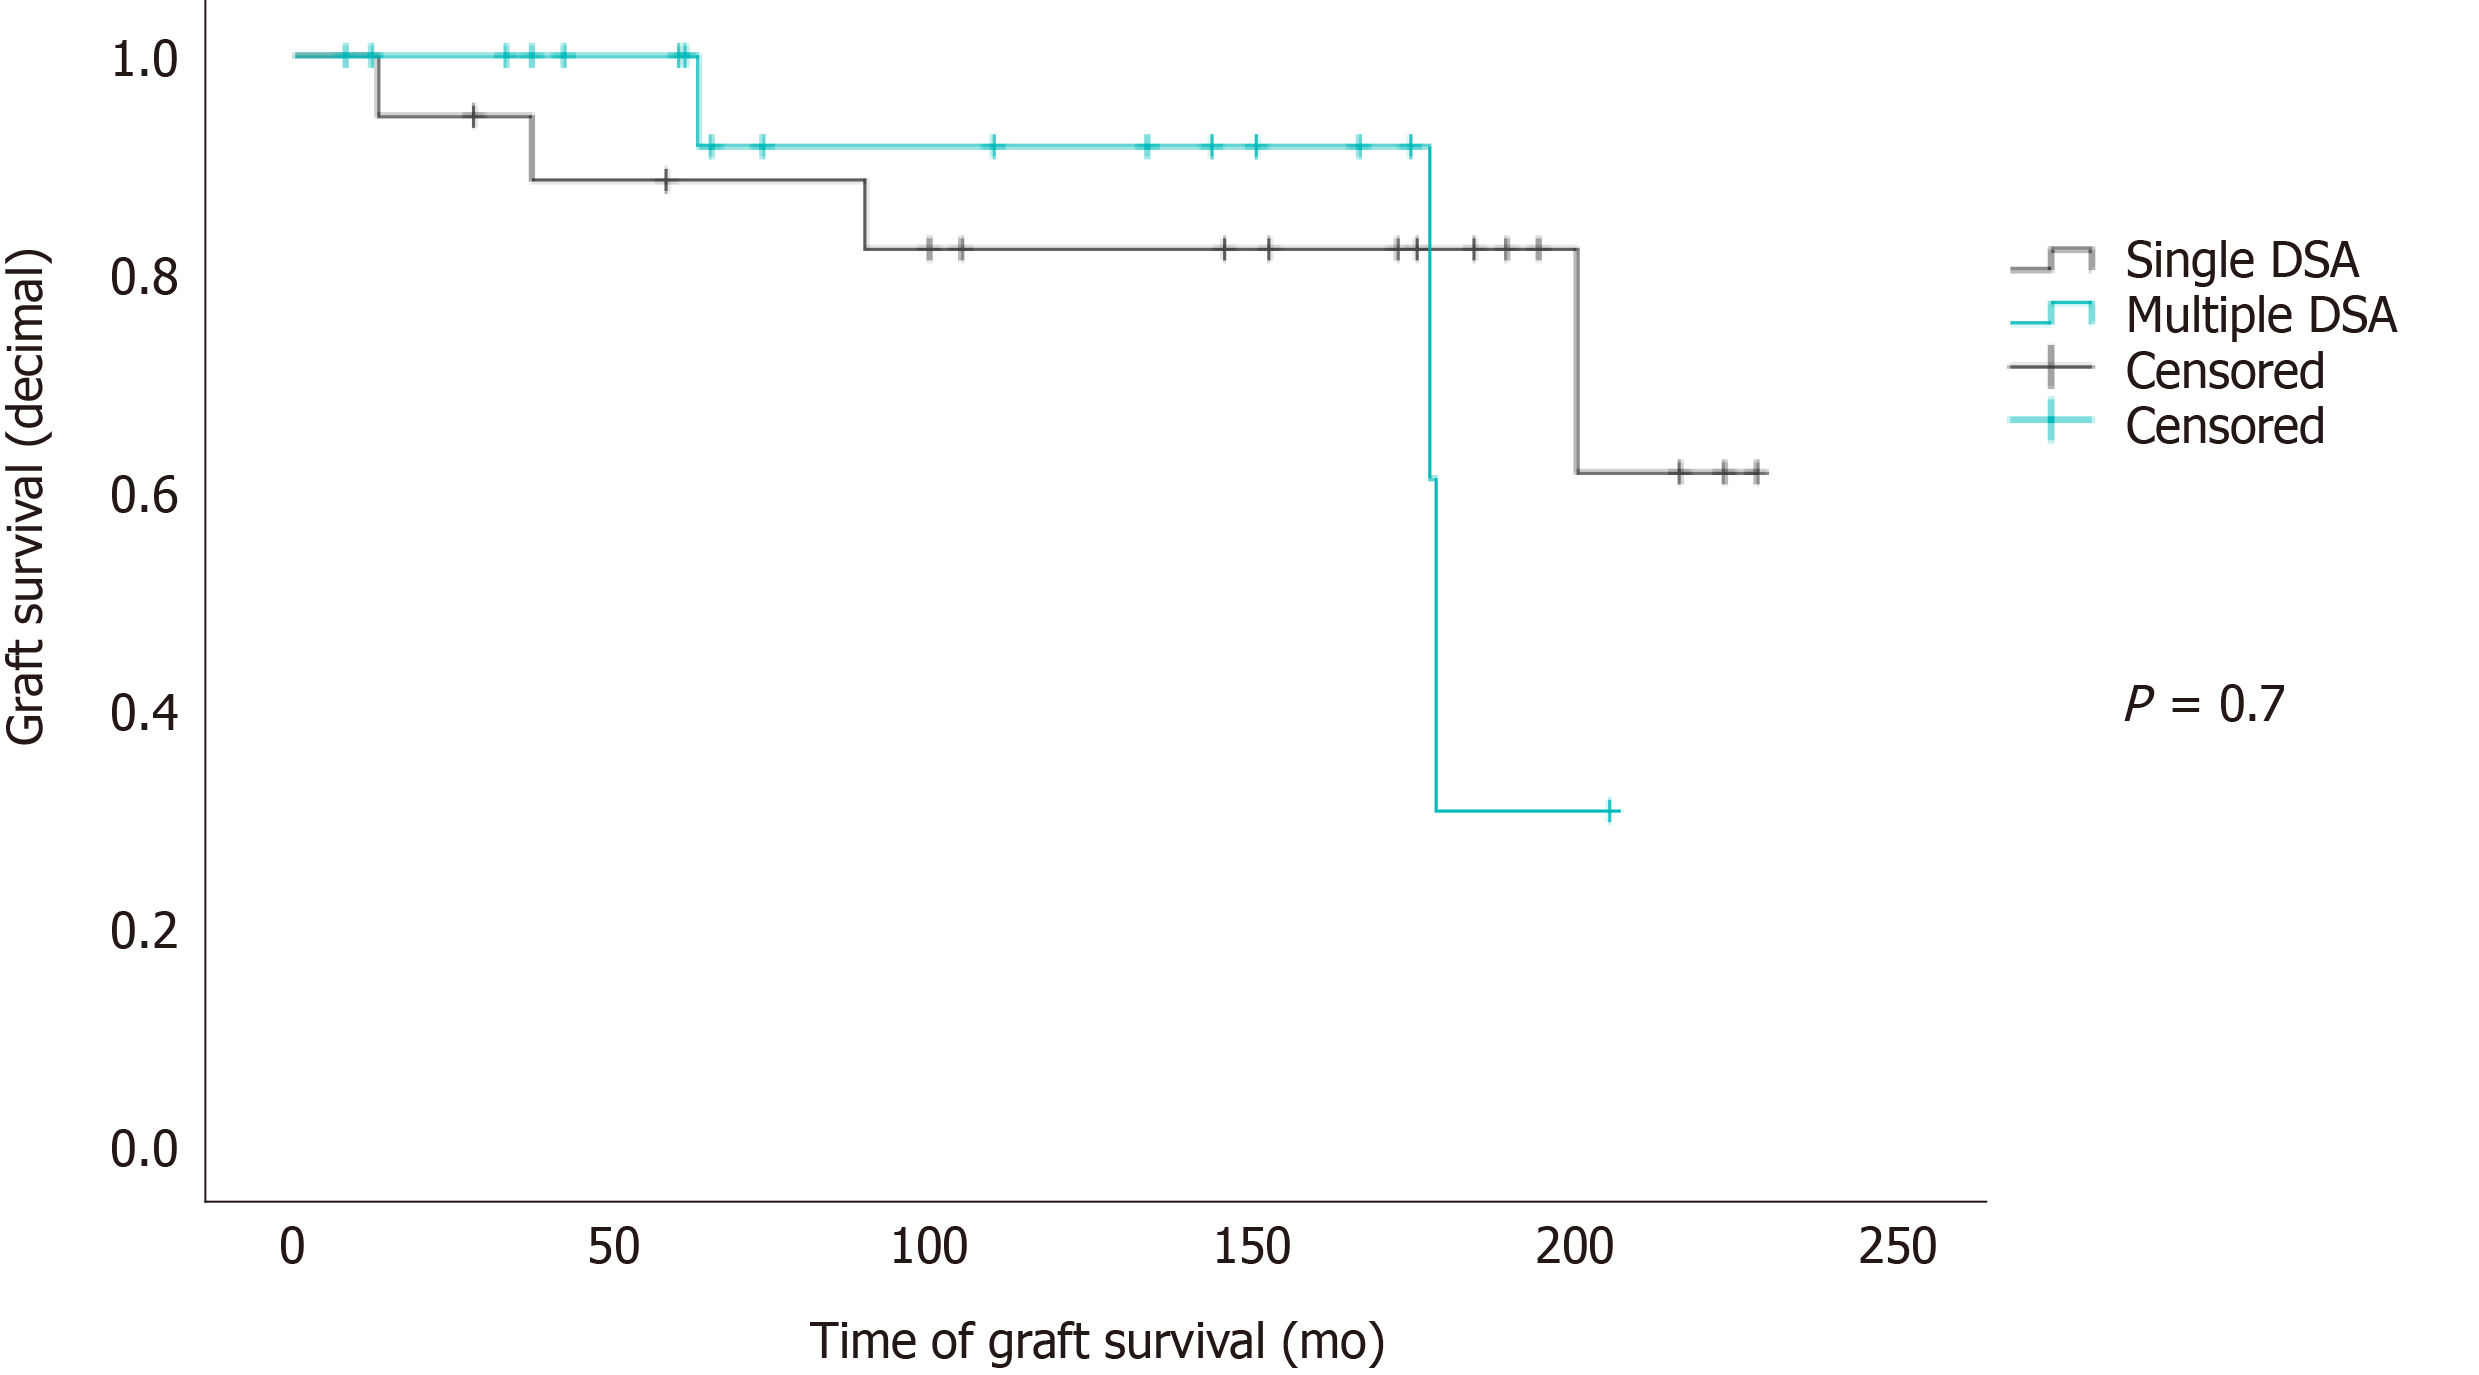
Figure 3 Number of donor-specific antibodies on graft survival.
Kaplan-Meyer survival plot; vertical axis: Graft survival (decimal); horizontal axis: Time of graft survival (months); graphs: Patients with single donor-specific antibody (DSA) are shown in a dark grey, numbers at risk n = 19; patients with multiple DSAs are shown in green, numbers at risk n = 19. DSA: Donor-specific antibody.
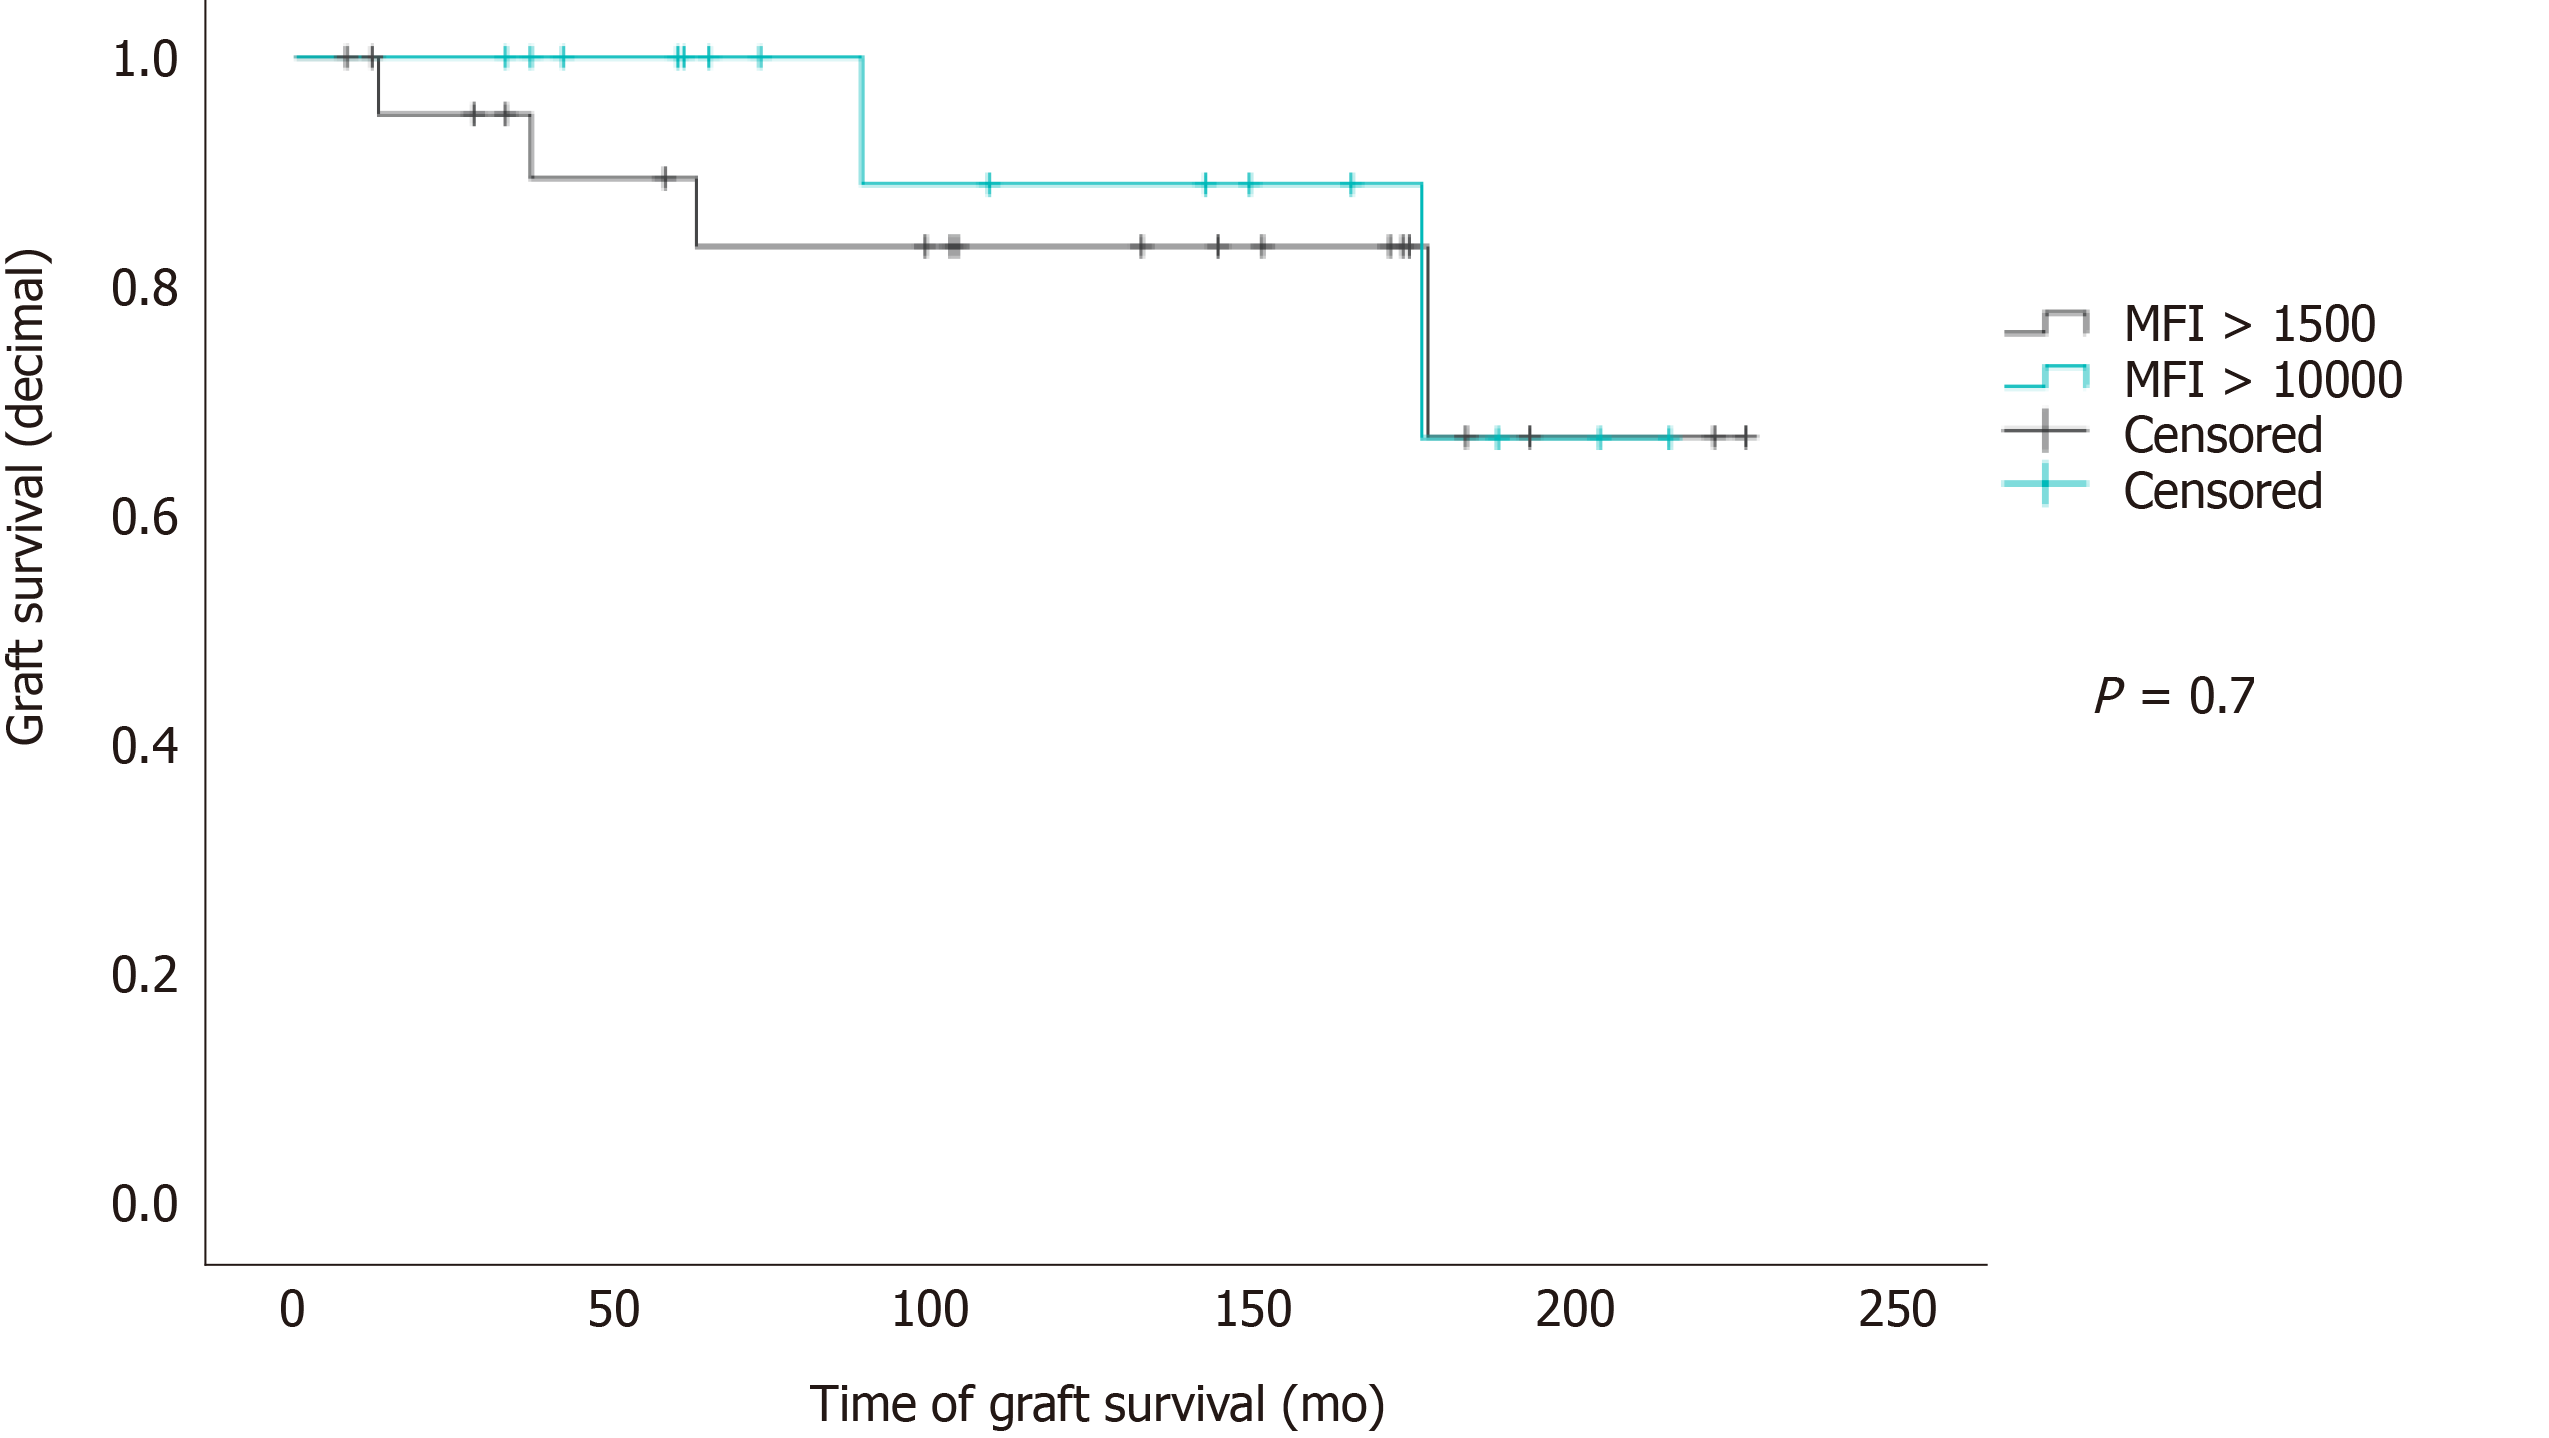
Figure 4 Mean fluorescence intensity levels on graft survival.
Kaplan-Meyer survival plot; vertical axis: Graft survival (decimal); horizontal axis: Duration of graft survival (months); graphs: Patients who have donor-specific antibodies (DSAs) with mean fluorescence intensity (MFI) above 1500 are shown in dark grey; numbers at risk n = 22; patients who have DSAs with MFI above 10000 are shown in green; numbers at risk n = 16. MFI: Mean fluorescence intensity.
- Citation: Schotters FL, Beime J, Briem-Richter A, Binder T, Herden U, Grabhorn EF. Impact of donor-specific antibodies on long-term graft survival with pediatric liver transplantation. World J Hepatol 2021; 13(6): 673-685
- URL: https://www.wjgnet.com/1948-5182/full/v13/i6/673.htm
- DOI: https://dx.doi.org/10.4254/wjh.v13.i6.673


