Copyright
©The Author(s) 2021.
World J Hepatol. May 27, 2021; 13(5): 571-583
Published online May 27, 2021. doi: 10.4254/wjh.v13.i5.571
Published online May 27, 2021. doi: 10.4254/wjh.v13.i5.571
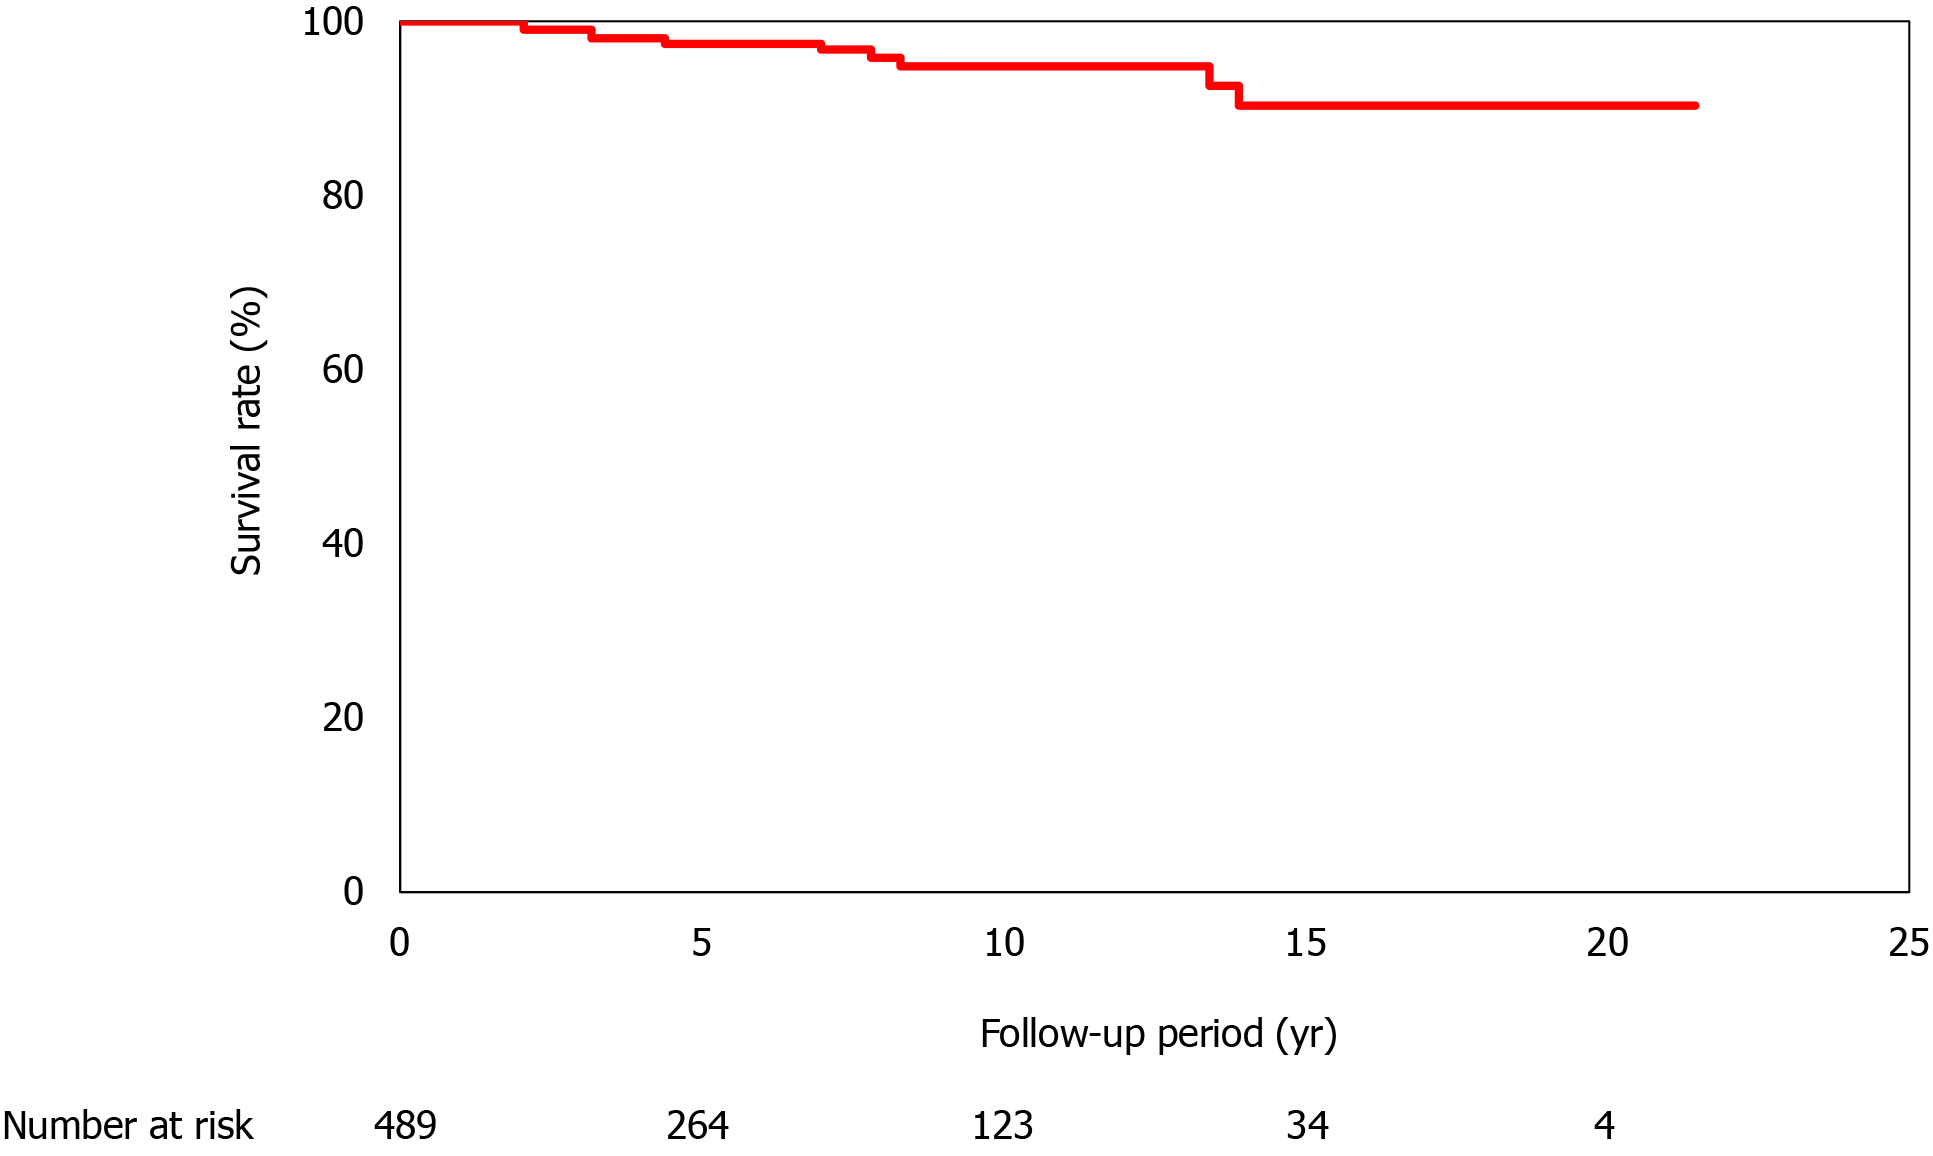
Figure 1 Survival of the 489 patients with non-alcoholic fatty liver disease.
The follow-up period varied between 1 yr and 21.2 yr, and all-cause mortality was considered. The survival rates are 98.5% at 5 yr, 95.4% at 10 yr, 91.9% at 15 yr, and 91.9% at 20 yr.
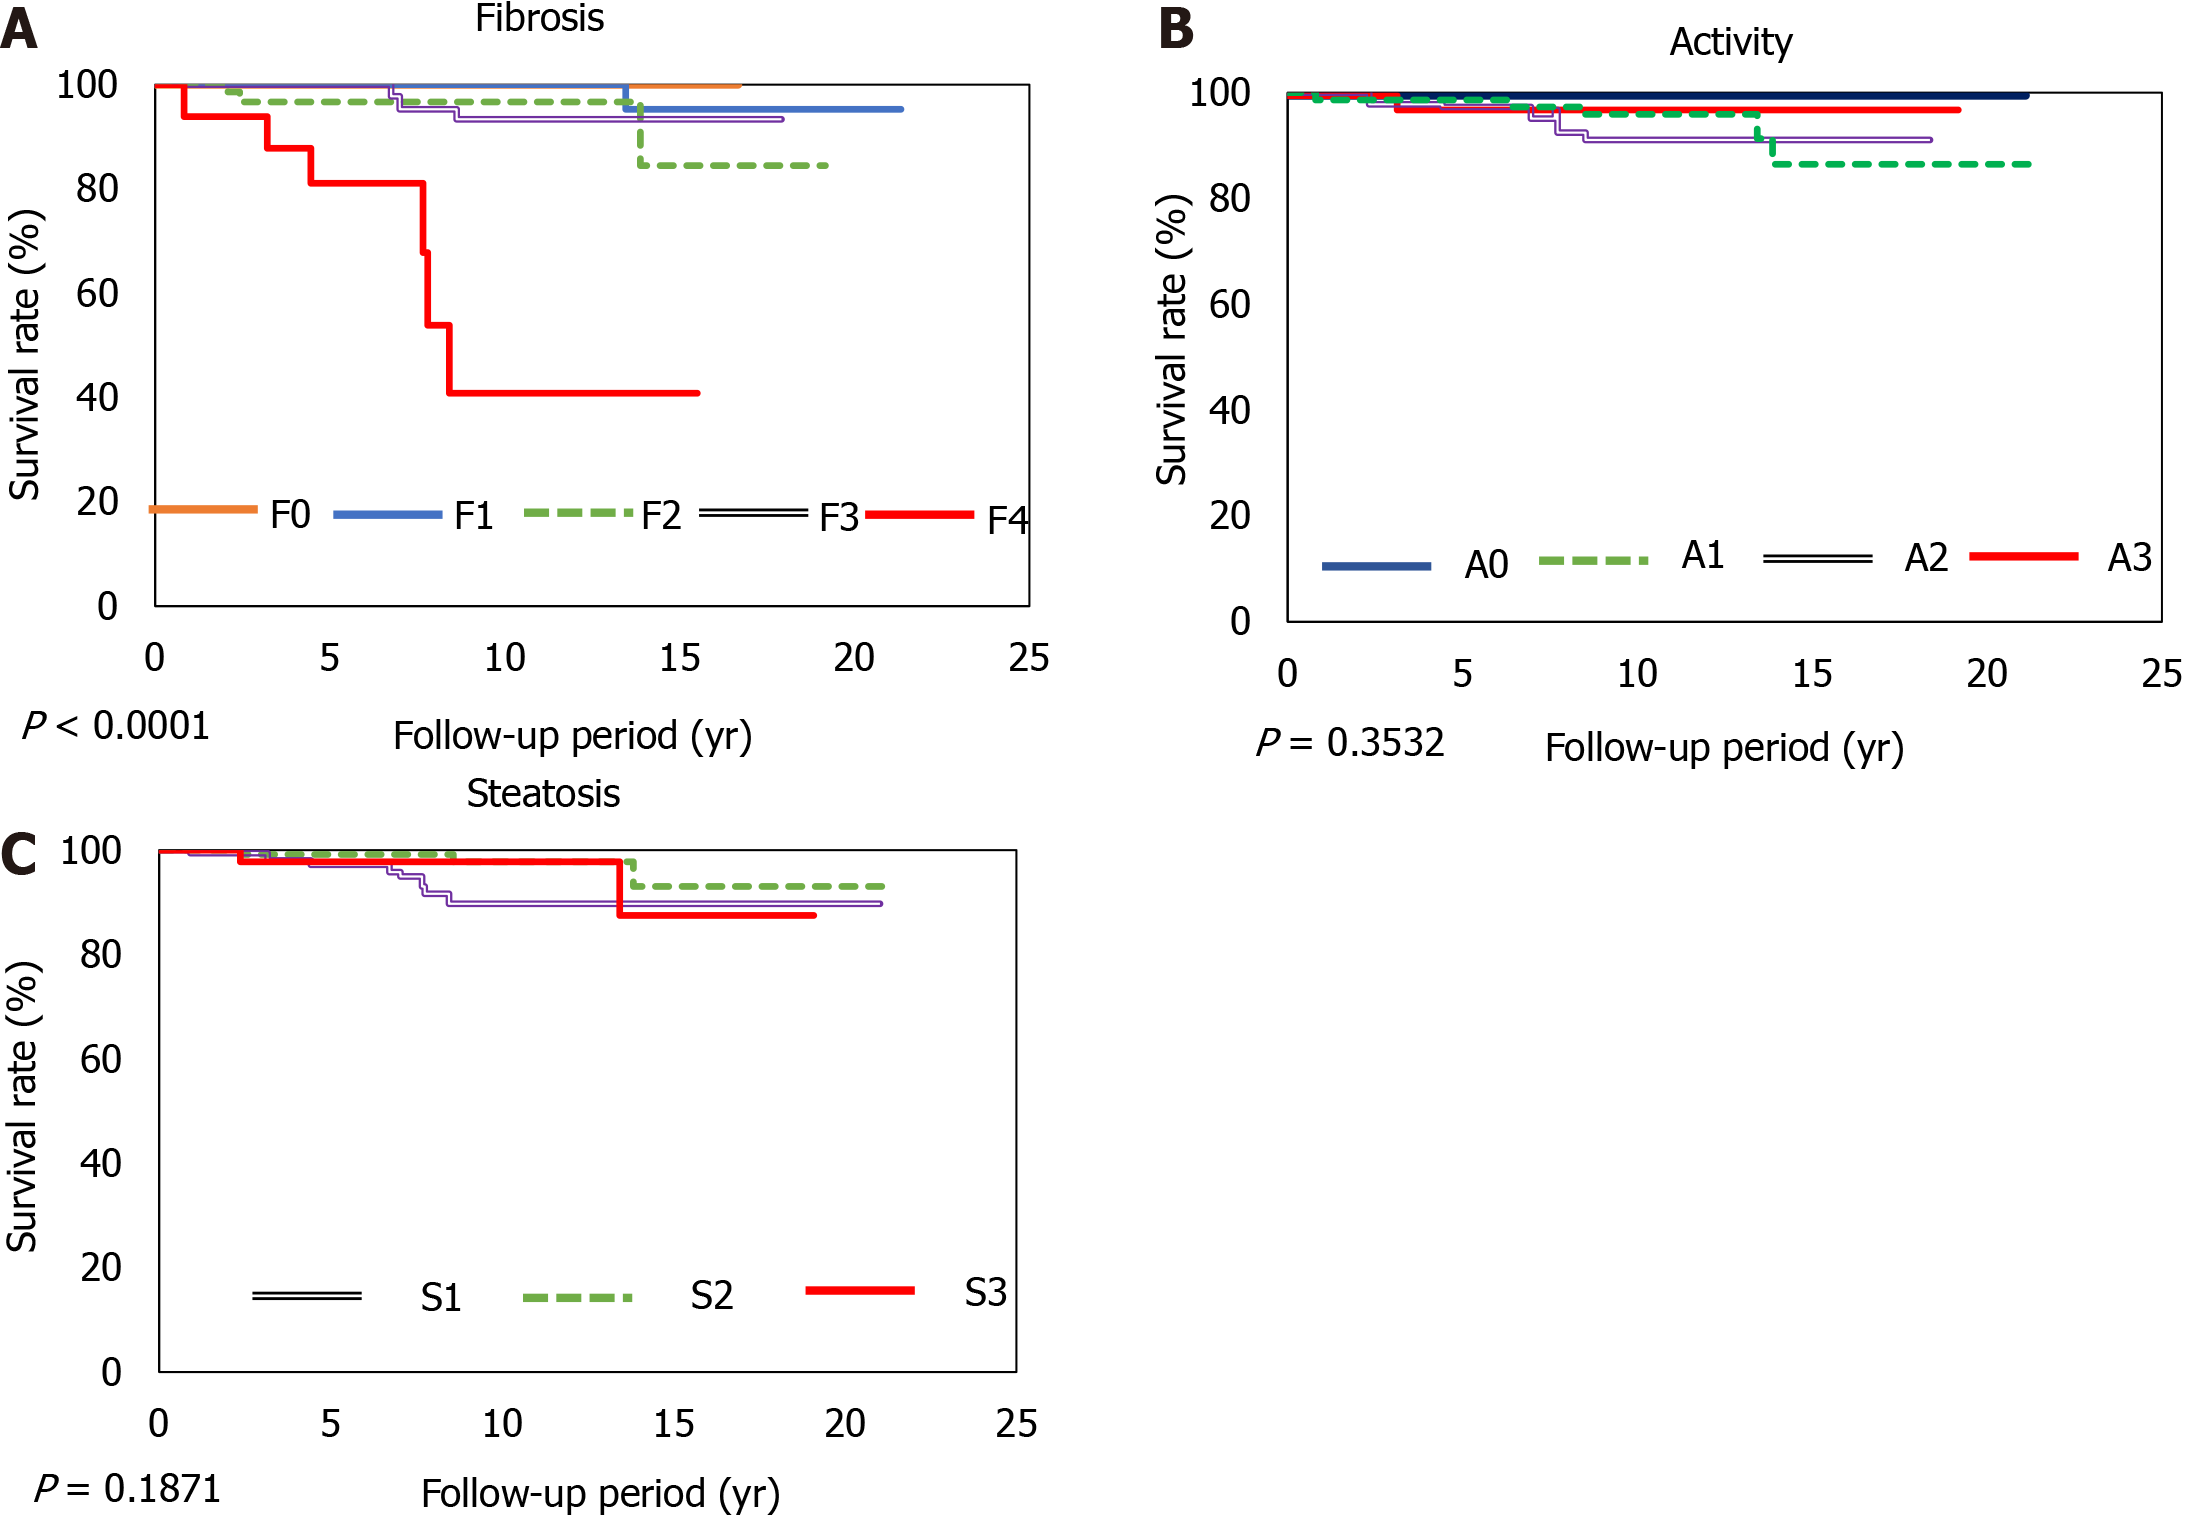
Figure 2 Survival rates according to the grading of fibrosis, inflammation, and steatosis.
The overall survival rates for stage 4 liver fibrosis are 81% at 5 yr and 41% at 10 yr. A: Fibrosis (F0-4); B: Inflammation (A0-3); C: Steatosis (S1-3).
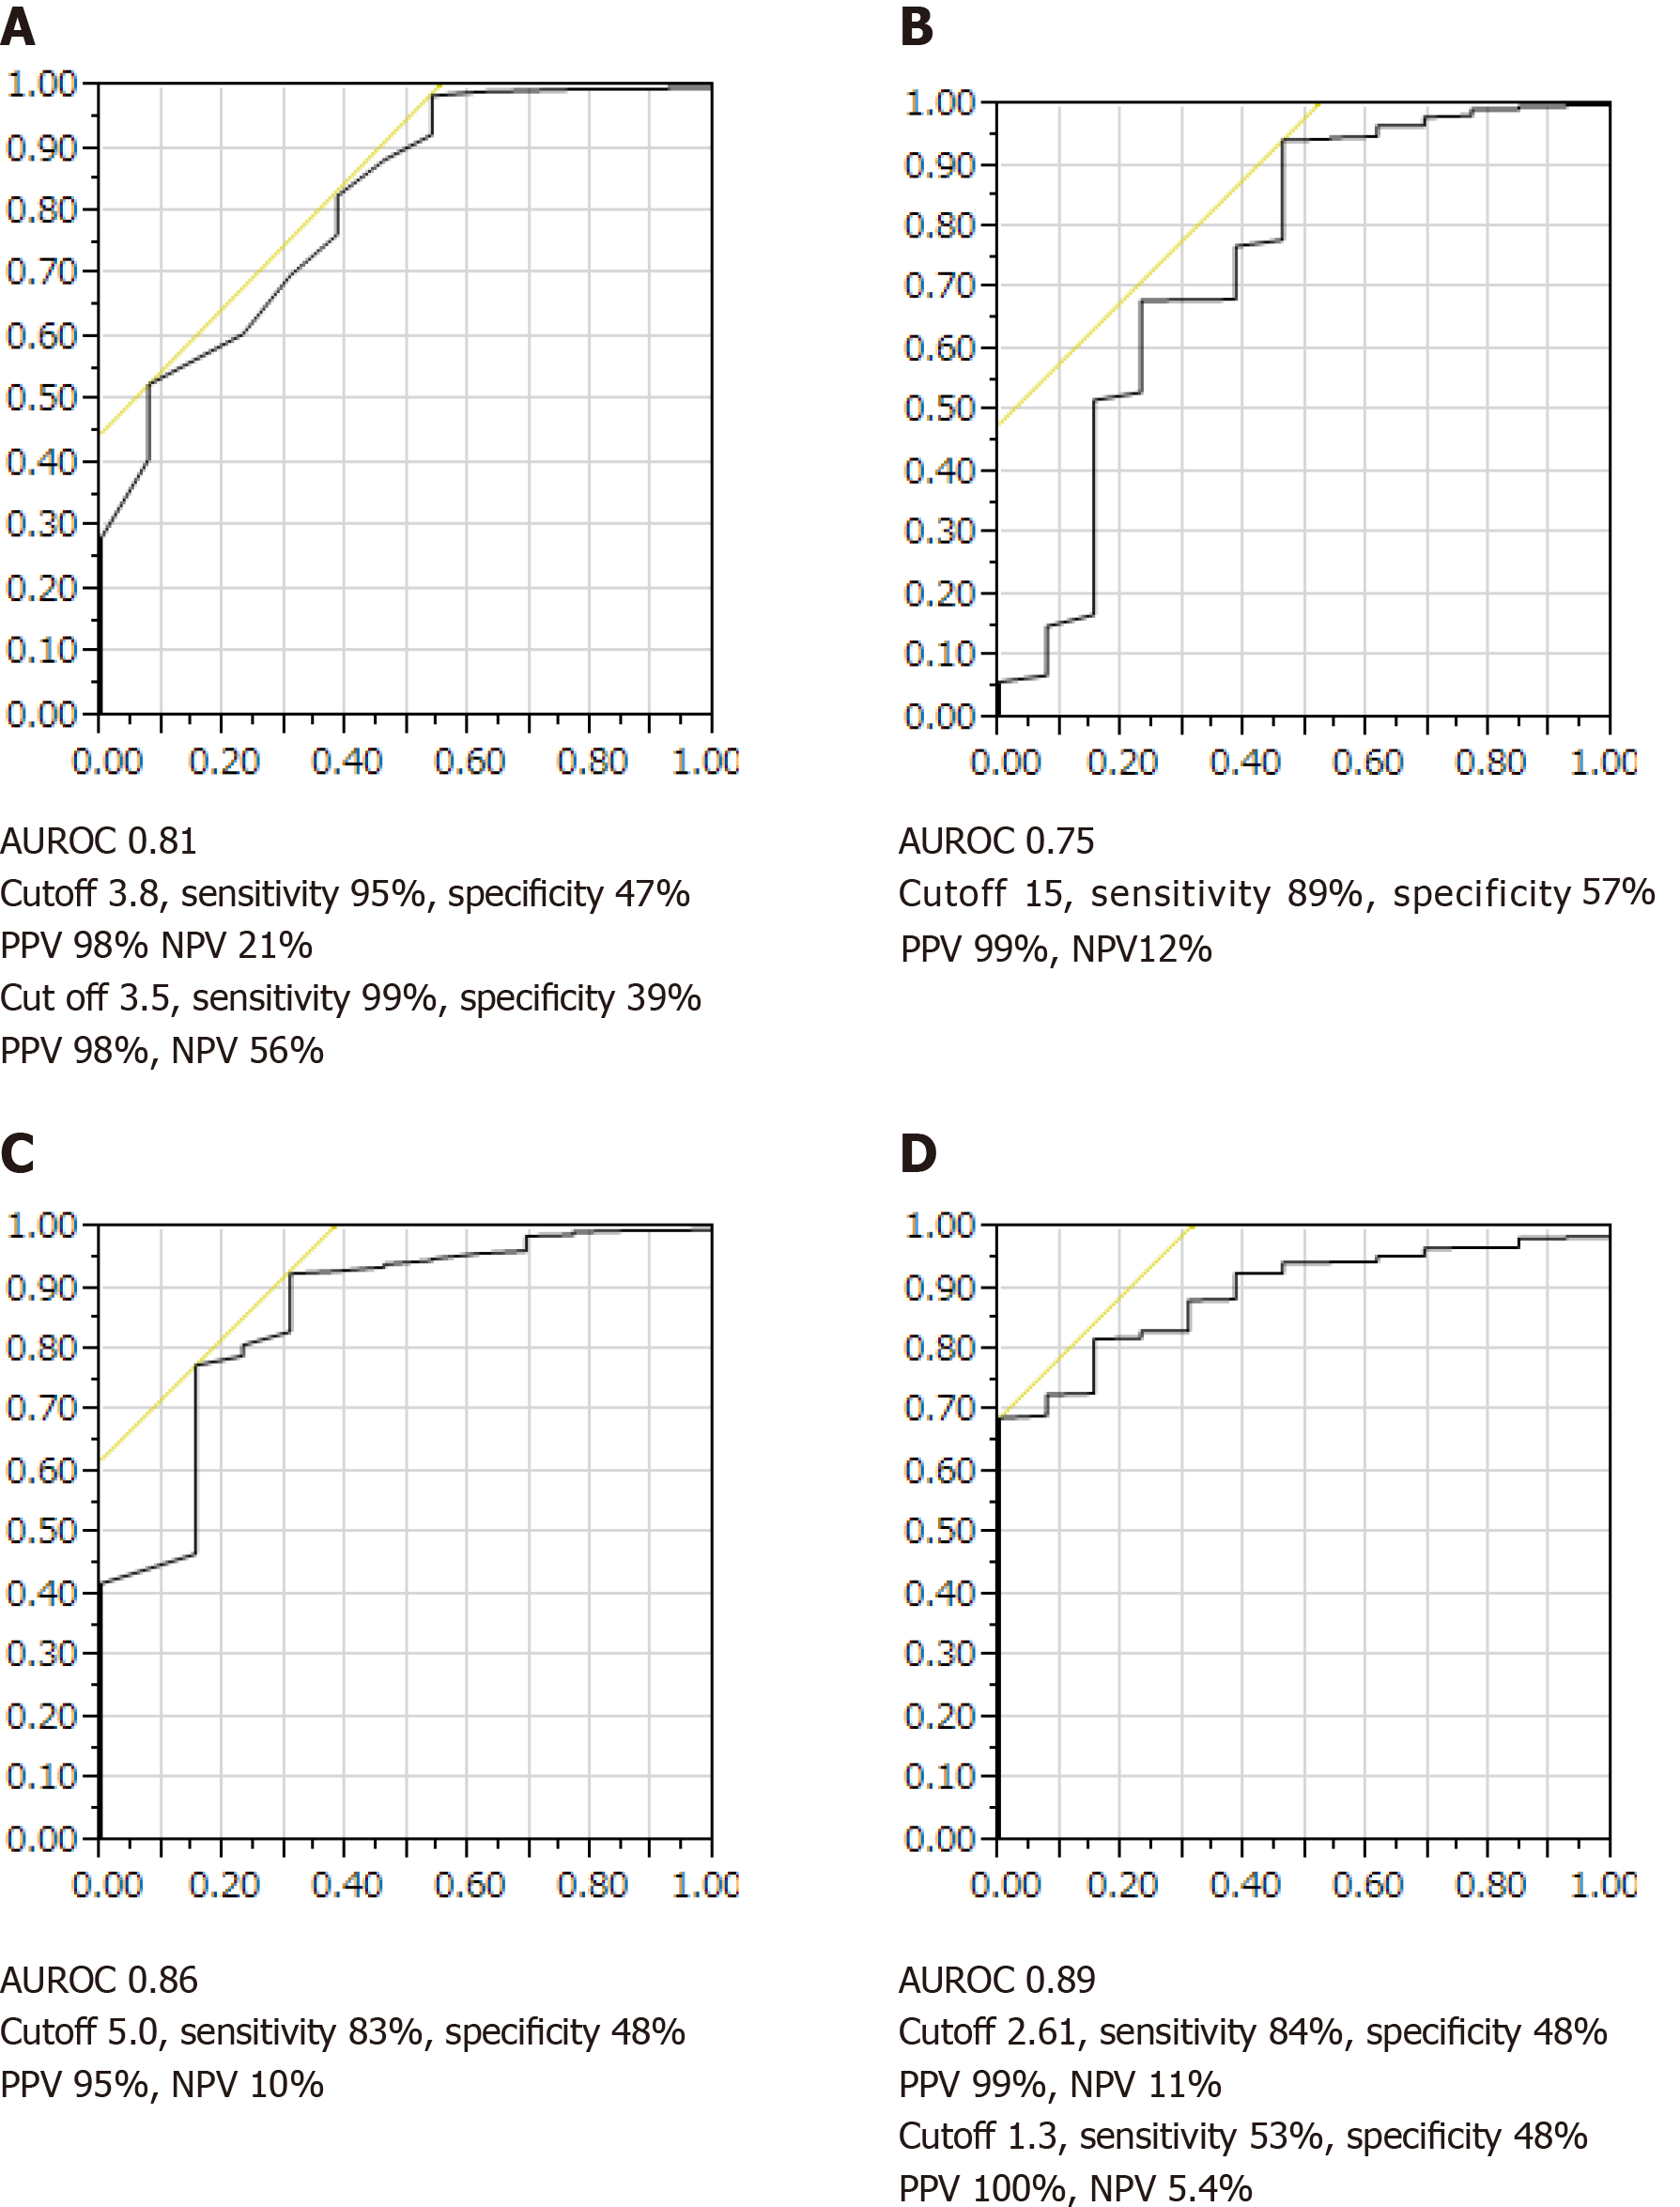
Figure 3 Receiver-operating characteristic curves for survival among patients with non-alcoholic fatty liver disease.
A: Albumin concentration; B: Platelet count; C: Type IV collagen 7S concentration; D: Fibrosis-4 index. AUROC: Area under the receiver operating characteristic curve, PPV: Positive predictive value, NPV: Negative predictive value.
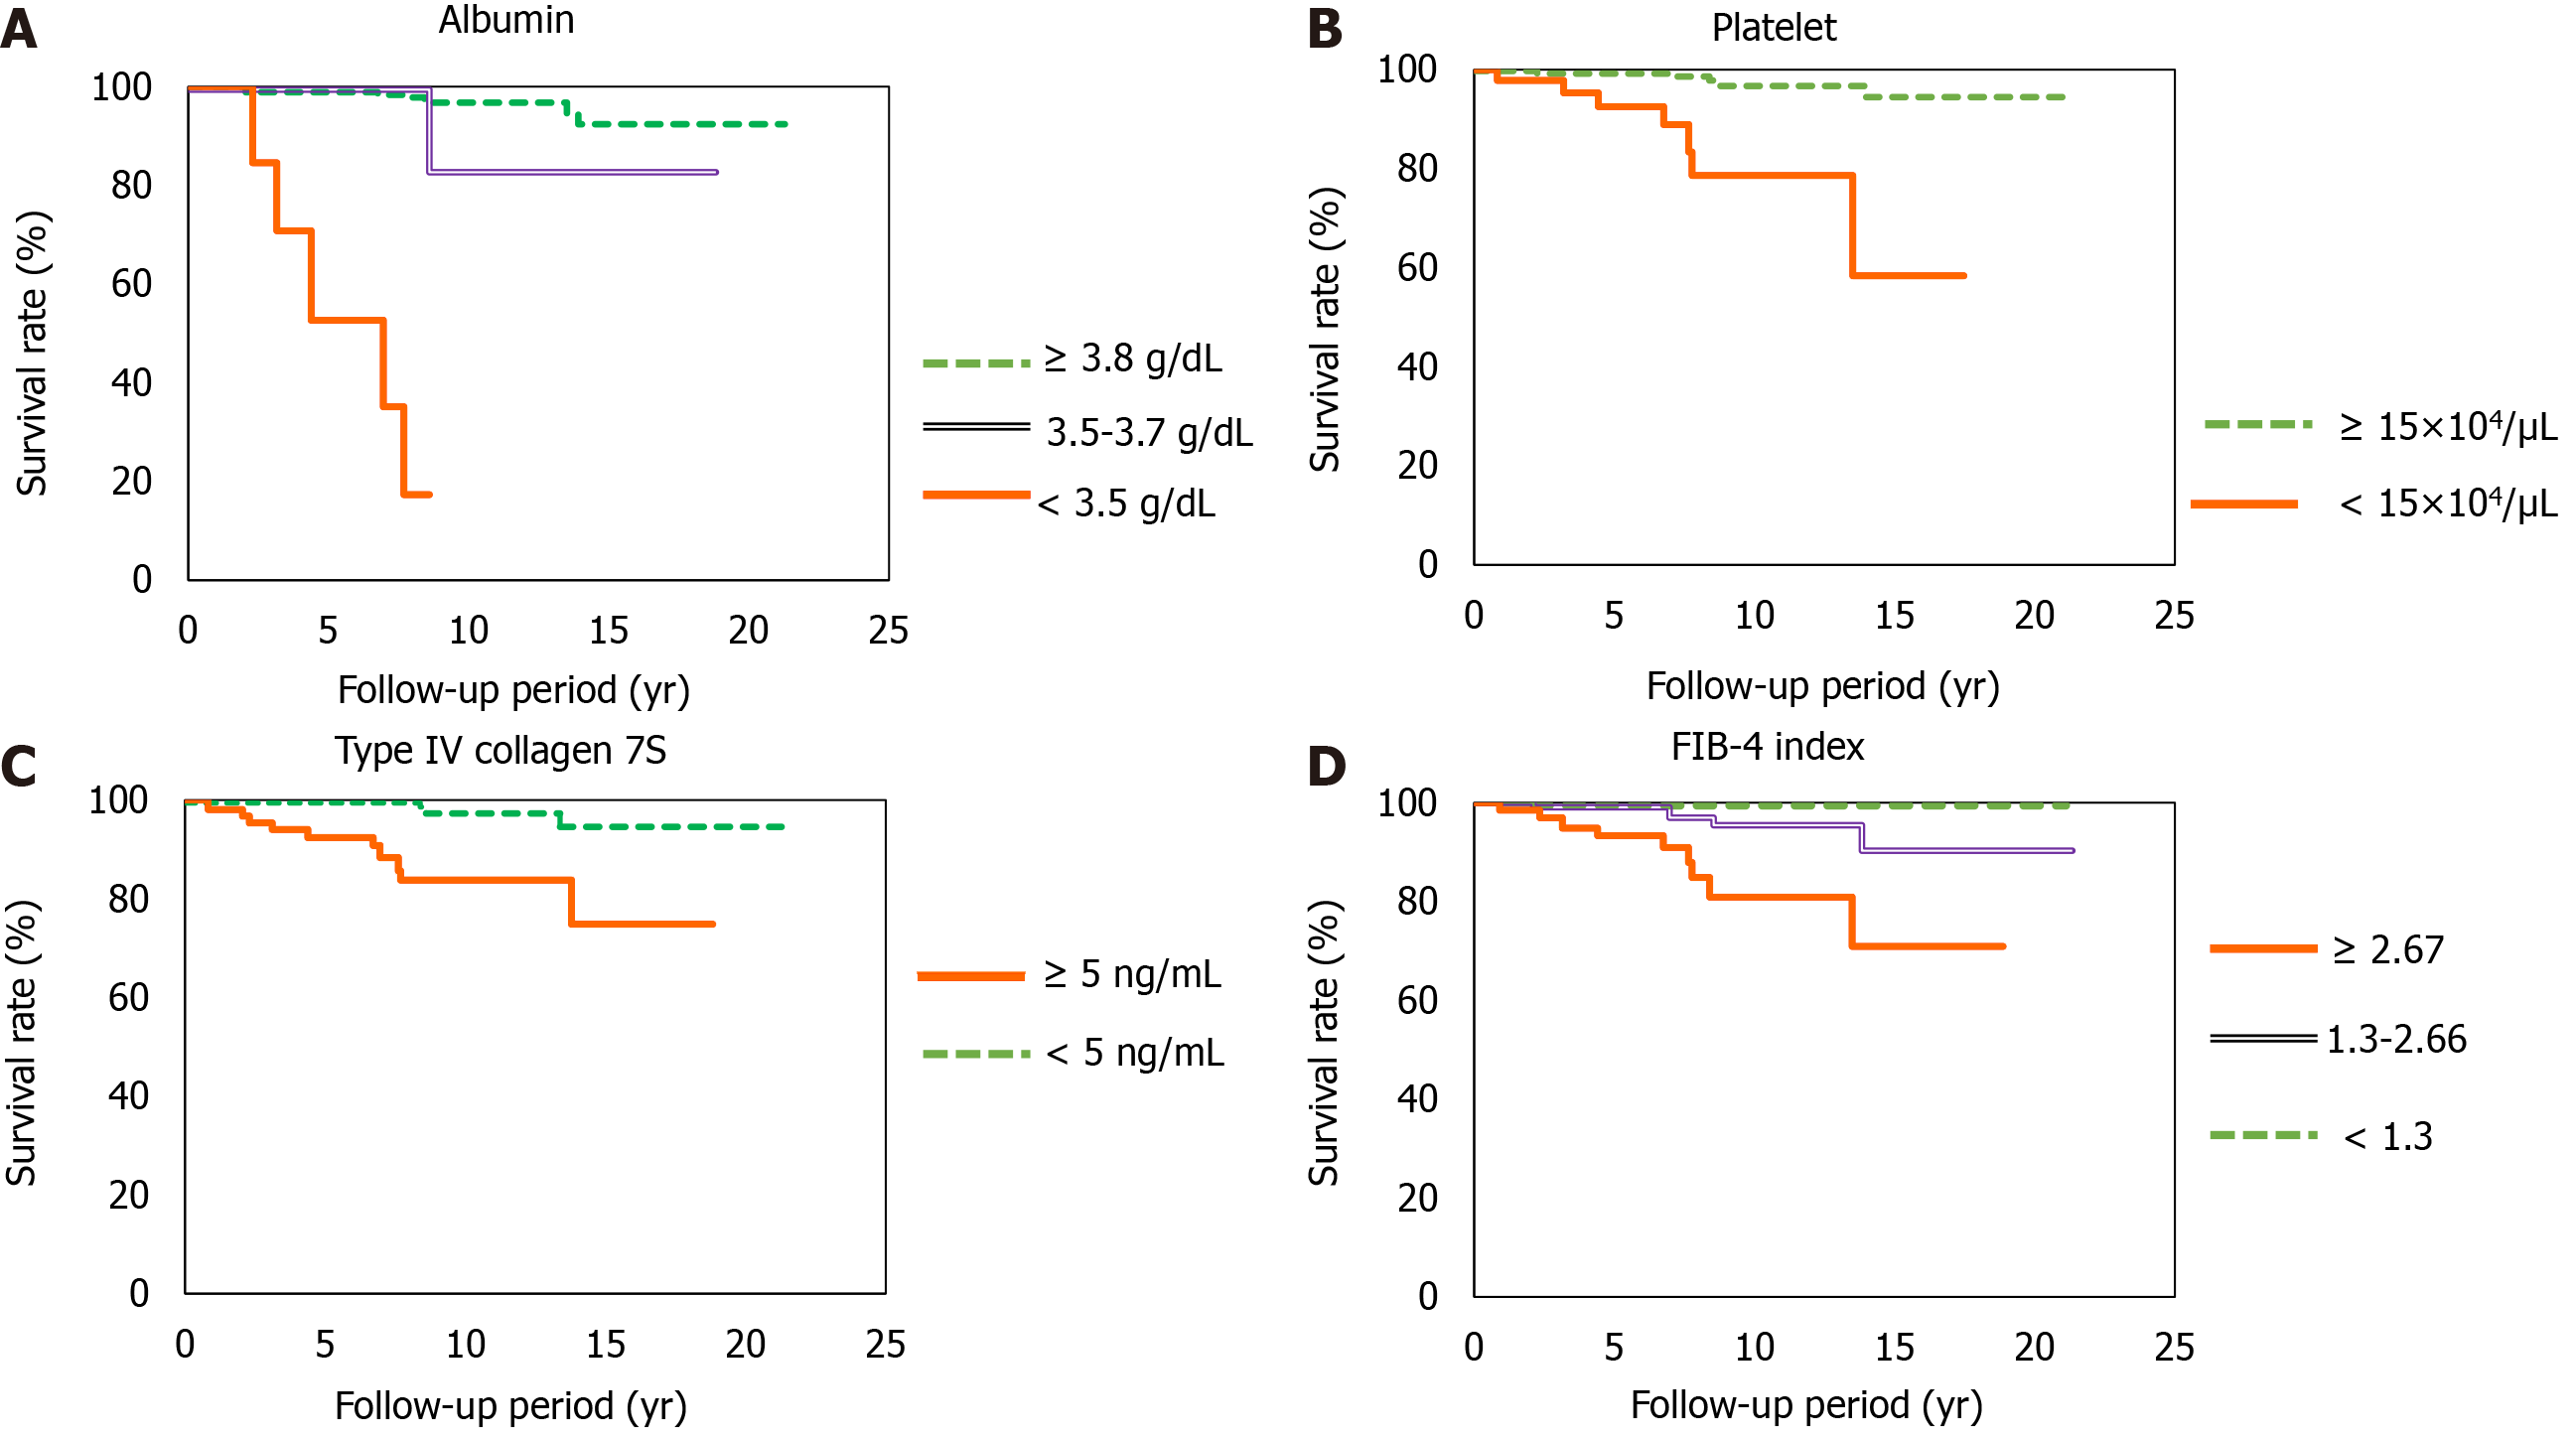
Figure 4 Survival rates.
A: Albumin concentration (albumin ≥ 3.8 g/dL vs 3.5-3.7 g/dL; P < 0.001, albumin ≥ 3.8 g/dL vs < 3.5 g/dL; P < 0.0001, albumin 3.5-3.7 g/dL vs < 3.5; P < 0.0001); B: Platelet count (platelet ≥ 15 × 104/µL vs < 15 × 104/µL; P < 0.0001); C: Type IV collagen 7S concentration (type IV collagen 7S ≥ 5 ng/mL vs < 5 ng/mL; P < 0.0001); D: Fibrosis-4 index (Fibrosis-4 index ≥ 2.67 vs 1.3-2.67; P < 0.001, Fibrosis-4 index C1.3-2.67 vs < 1.3; P < 0.0001, Fibrosis-4 index ≥ 2.67 vs < 2.67; P < 0.0001). FIB: Fibrosis.
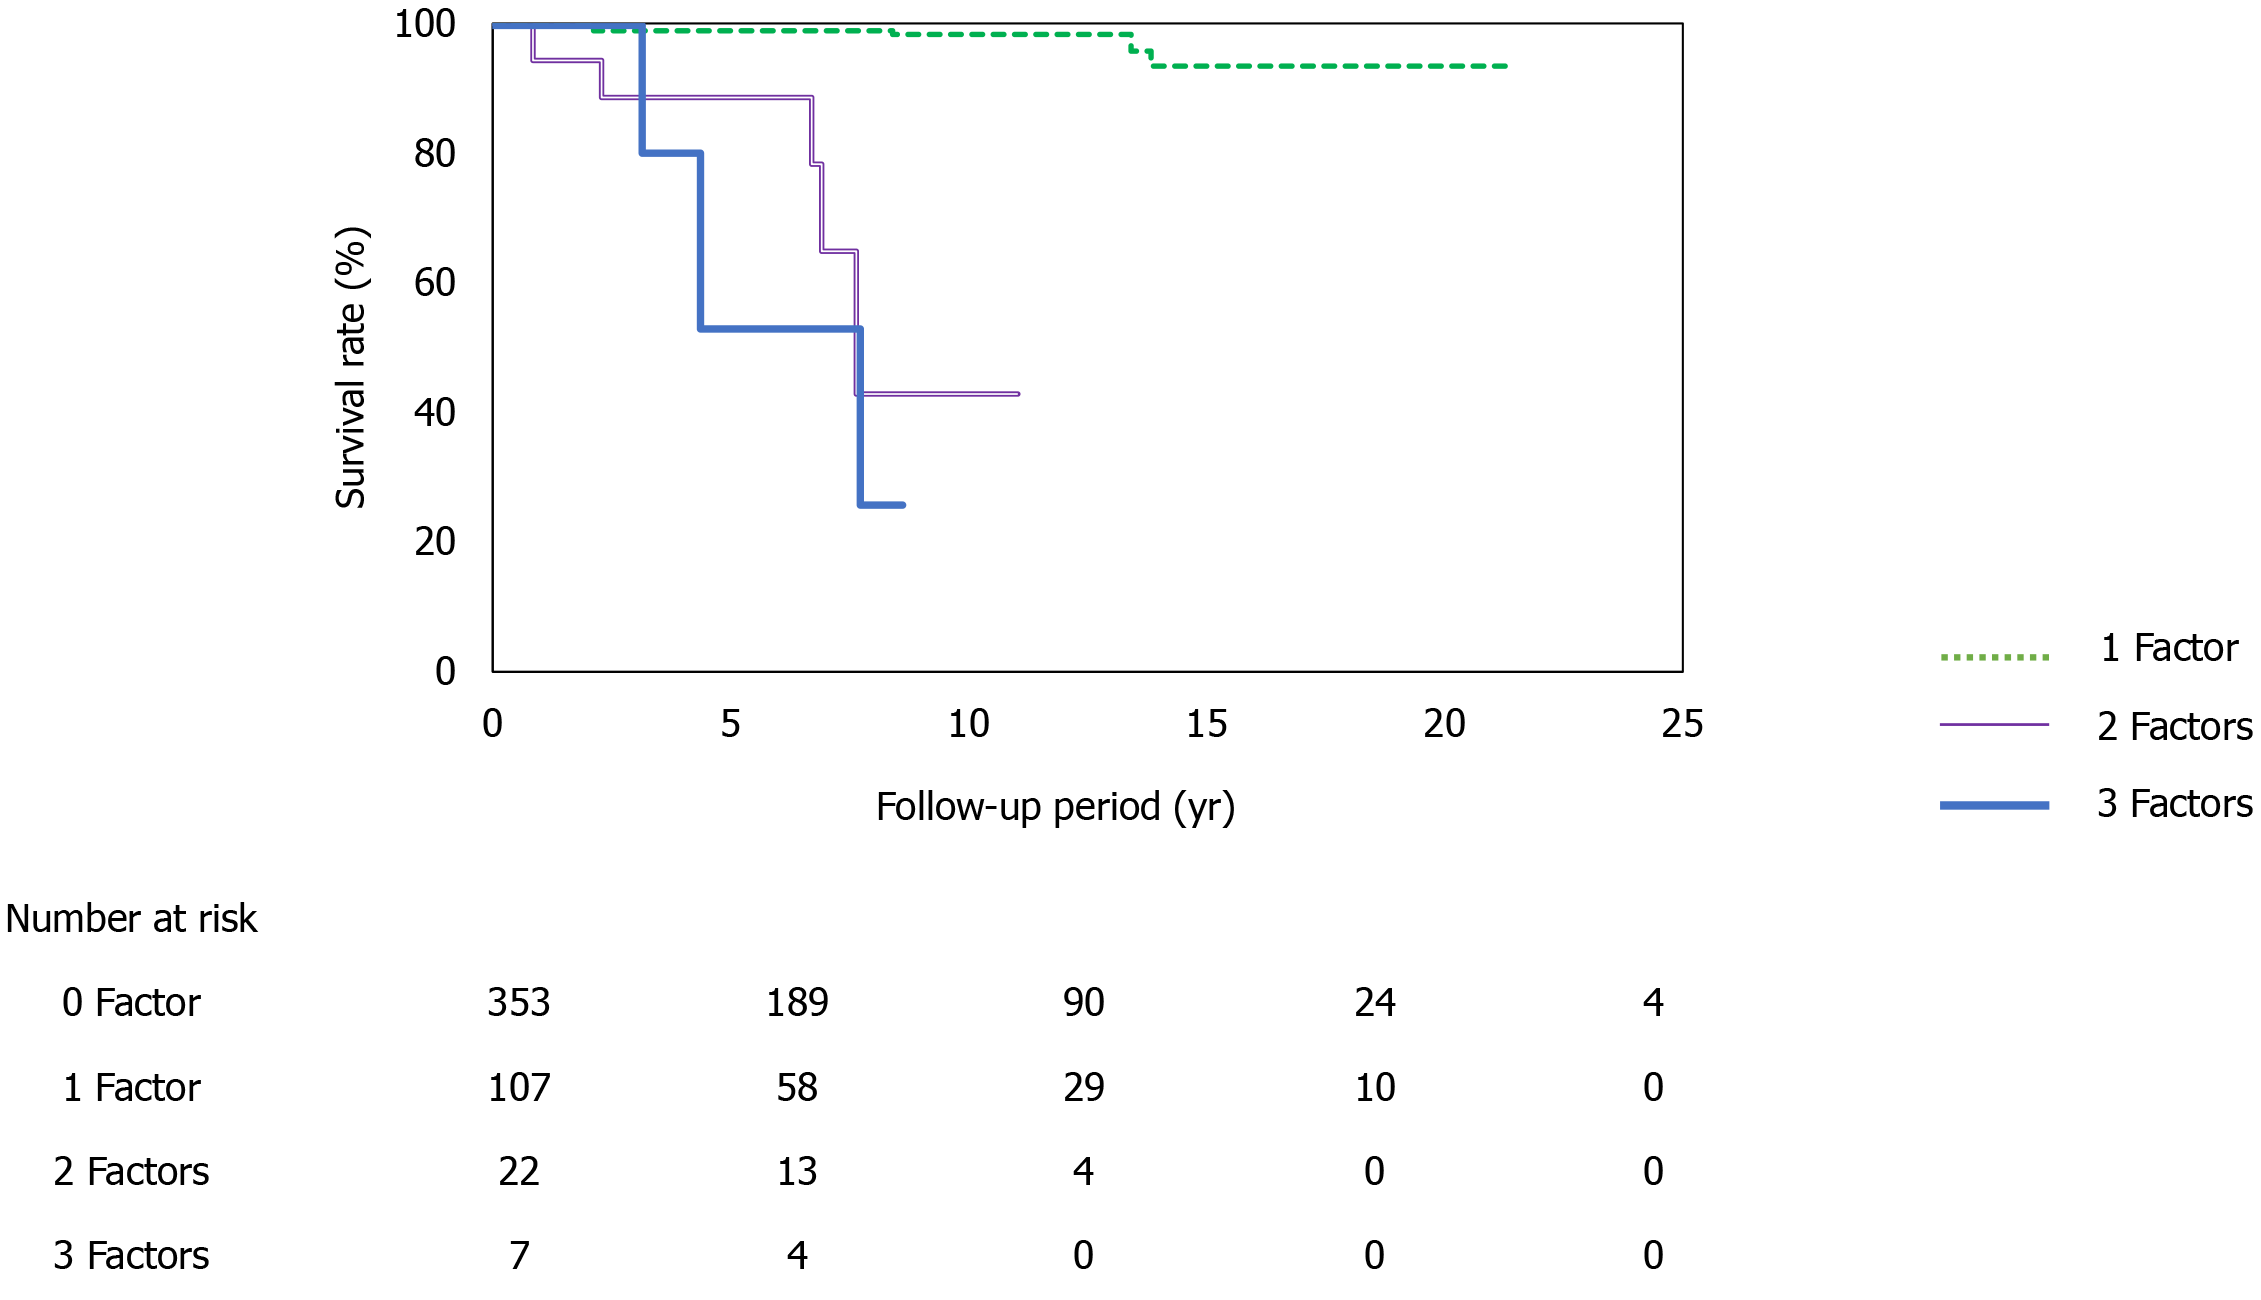
Figure 5 Survival rates according to positivity for the different biomarkers.
Patients with only one risk factor have relatively good survival rates at 5 yr (99.7%), 10 yr (98.3%), and 15 yr (94%). However, patients with two risk factors have lower survival rates at 5 yr (98%) and 10 yr (43%), and patients with all three risk factors have even lower survival rates at 5 yr (53%) and 10 yr (26%) (1 factor vs 2 factors, P < 0.0001; 1 factor vs 3 factors, P < 0.0001; 2 factors vs 3 factors; P < 0.05).
- Citation: Kawanaka M, Nishino K, Ishii K, Tanikawa T, Urata N, Suehiro M, Sasai T, Haruma K, Kawamoto H. Combination of type IV collagen 7S, albumin concentrations, and platelet count predicts prognosis of non-alcoholic fatty liver disease. World J Hepatol 2021; 13(5): 571-583
- URL: https://www.wjgnet.com/1948-5182/full/v13/i5/571.htm
- DOI: https://dx.doi.org/10.4254/wjh.v13.i5.571


