Copyright
©The Author(s) 2021.
World J Hepatol. May 27, 2021; 13(5): 557-570
Published online May 27, 2021. doi: 10.4254/wjh.v13.i5.557
Published online May 27, 2021. doi: 10.4254/wjh.v13.i5.557
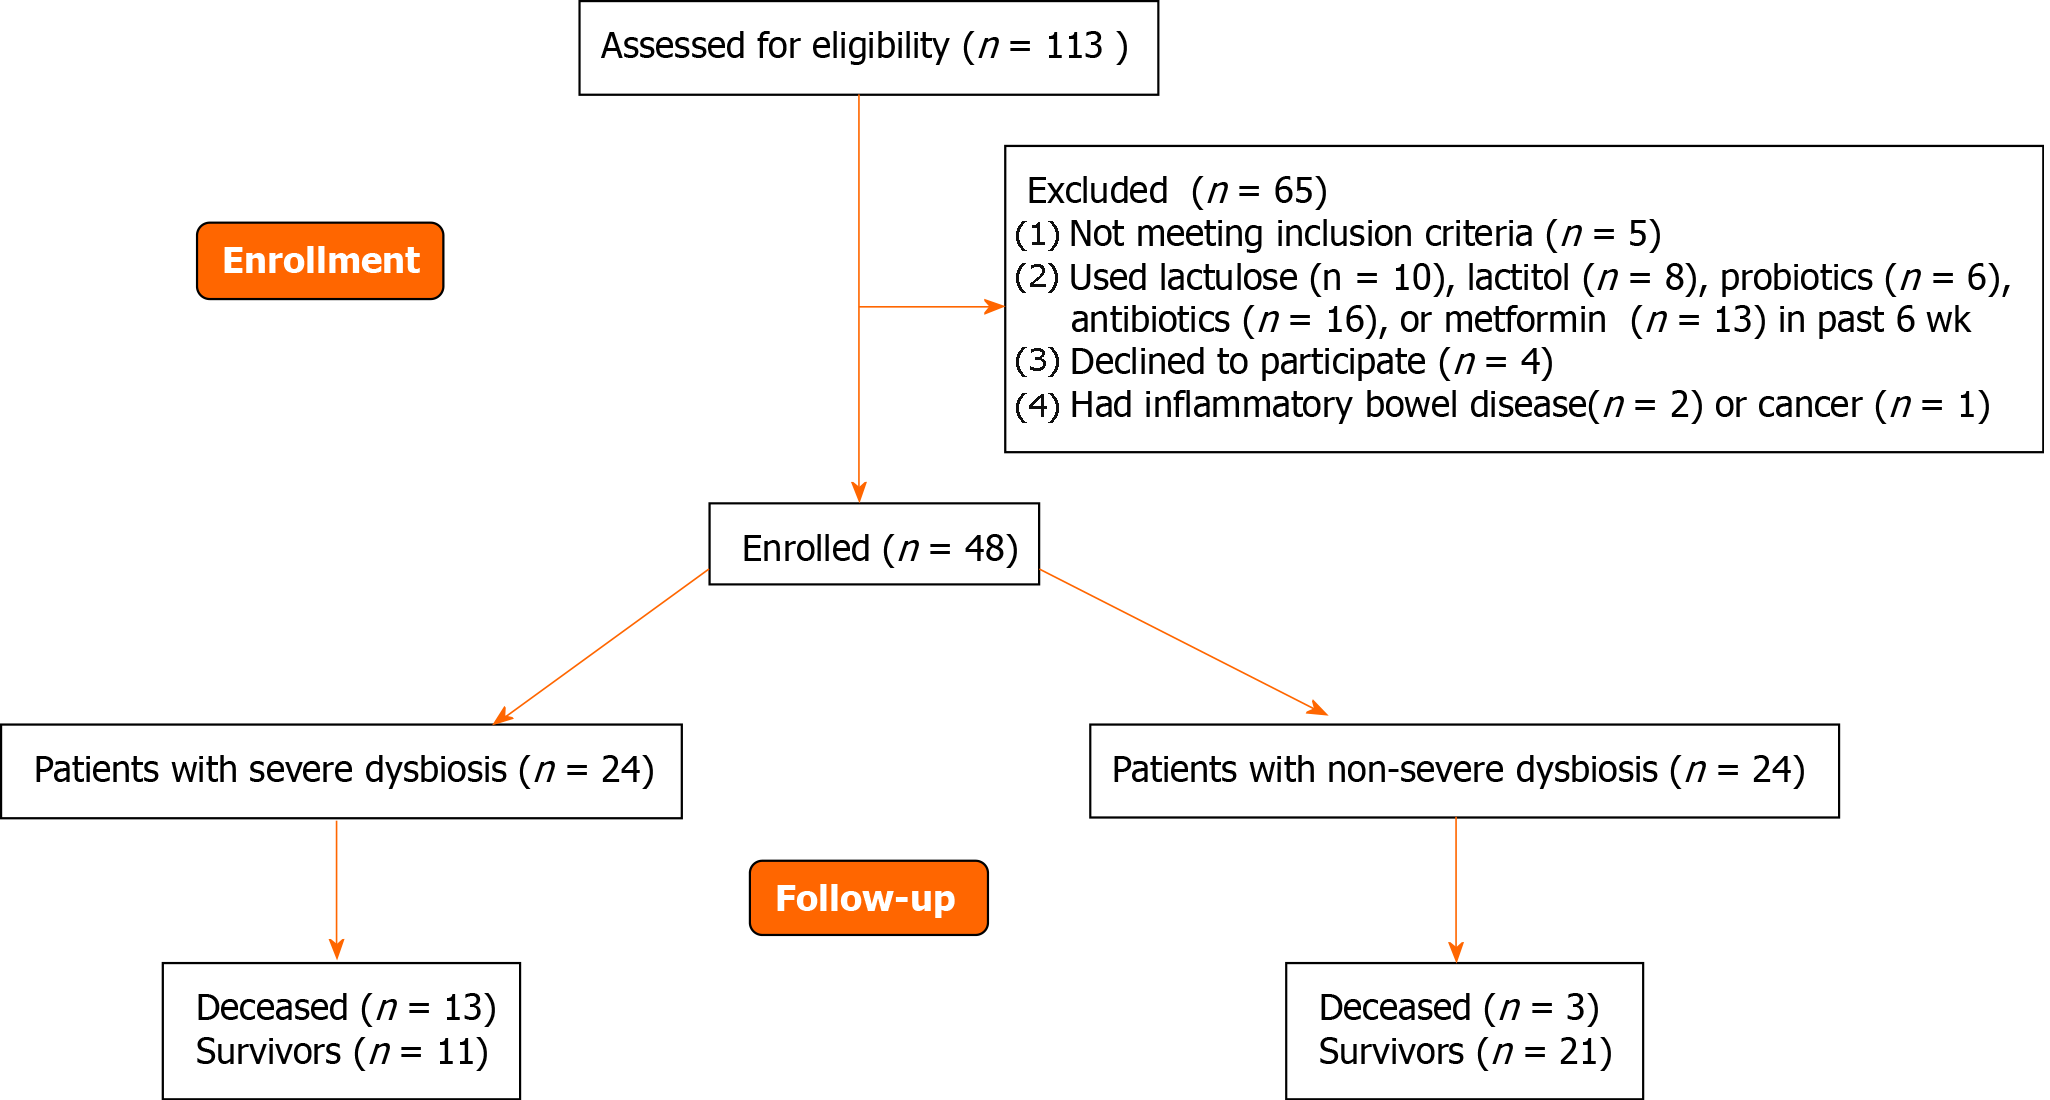
Figure 1 CONSORT 2010 flow diagram.
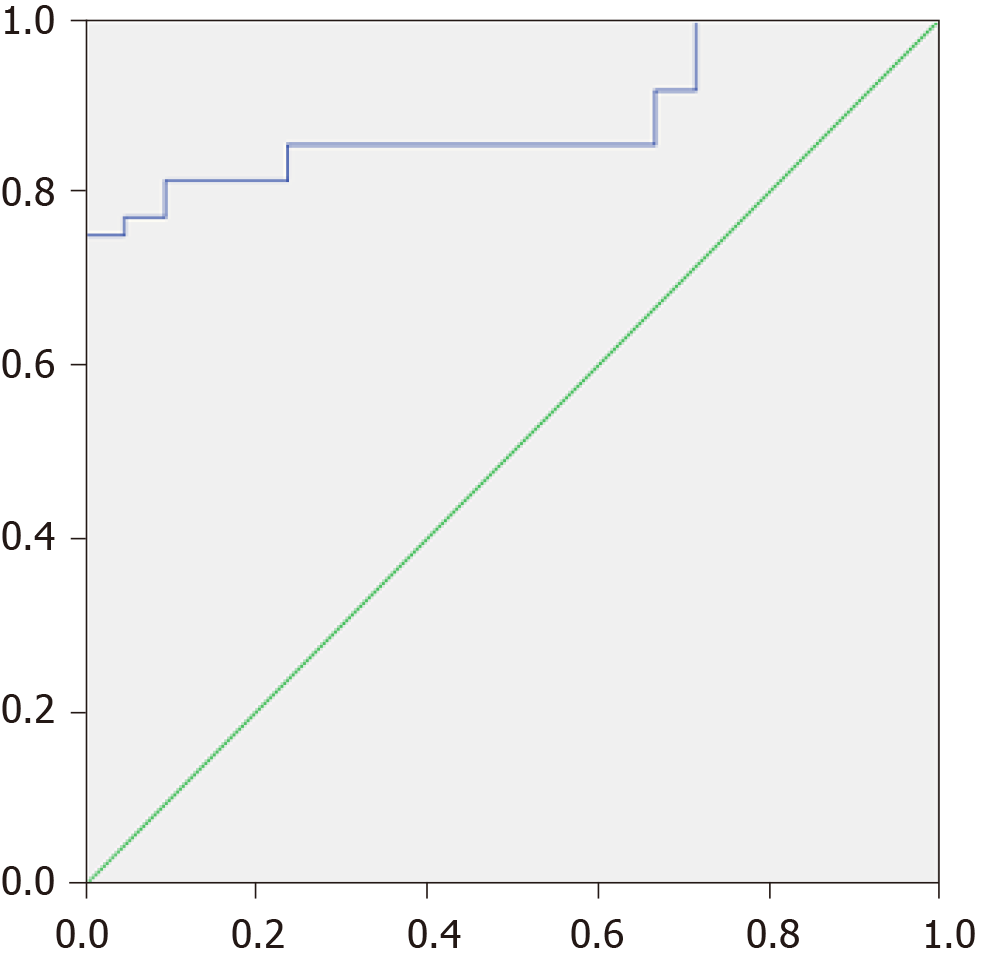
Figure 2 Receiver operating characteristic analysis of modified dysbiosis ratio for distinguish patients with cirrhosis from healthy individuals.
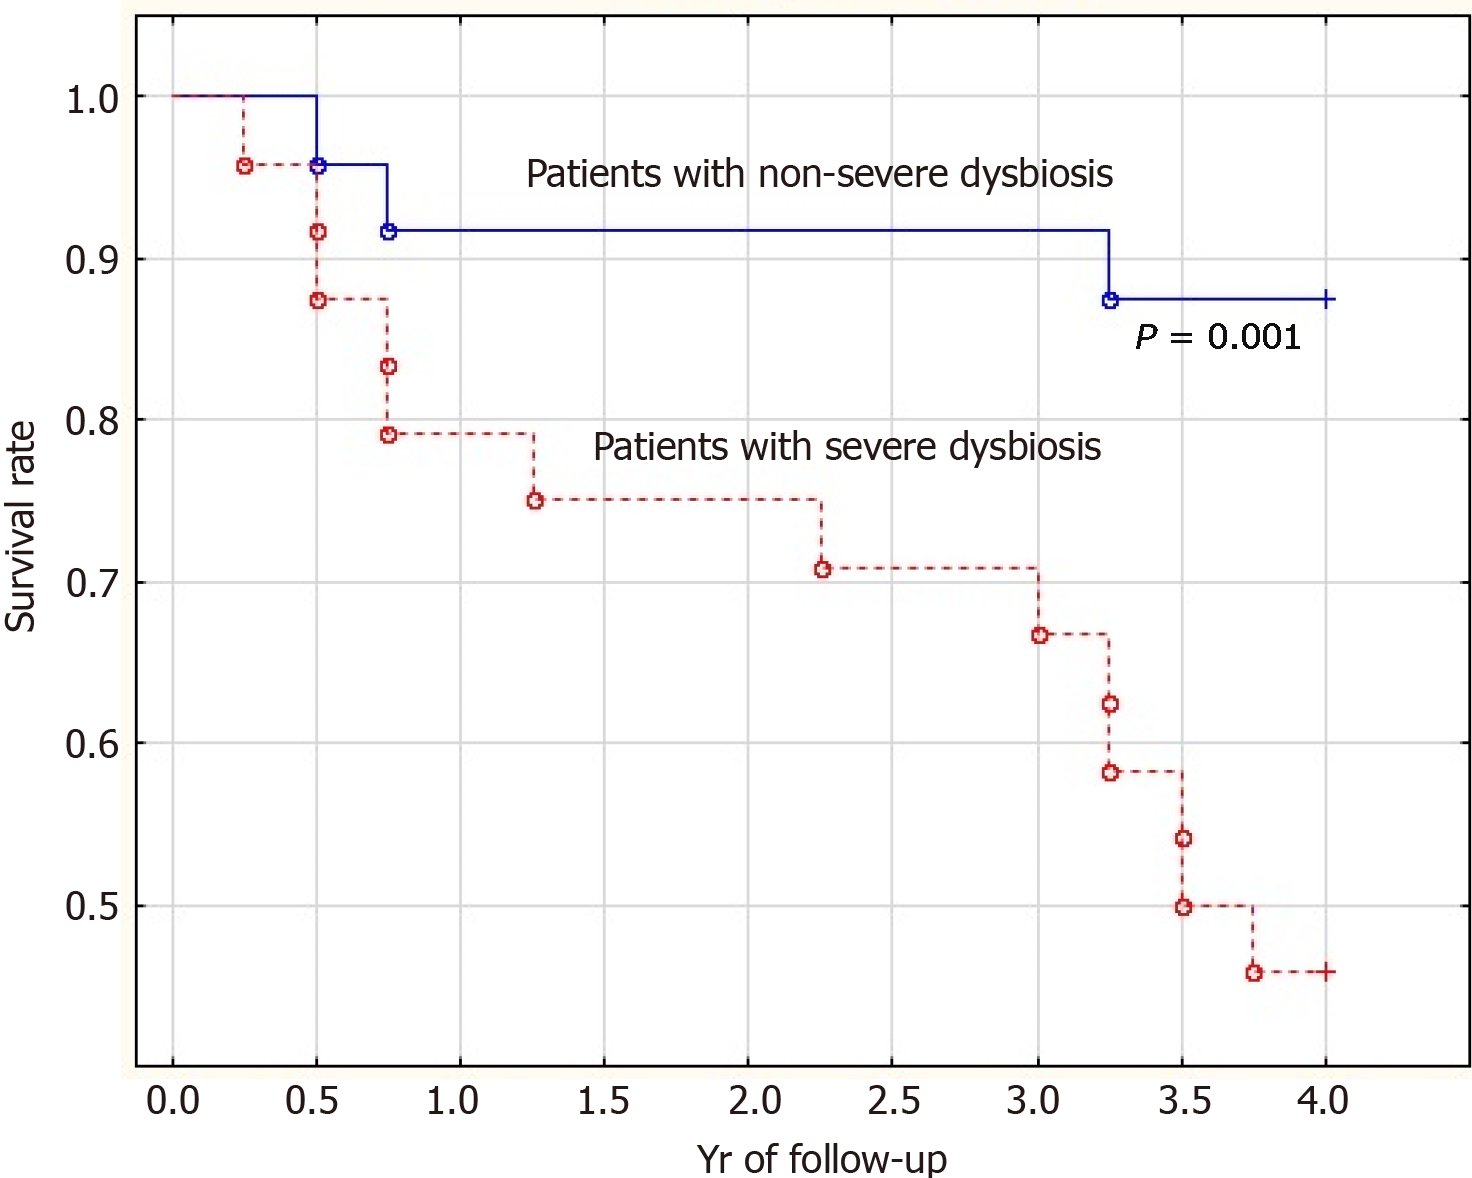
Figure 3 Survival curve (years) of patients with cirrhosis with severe (dotted line) and non-severe (solid line) dysbiosis.
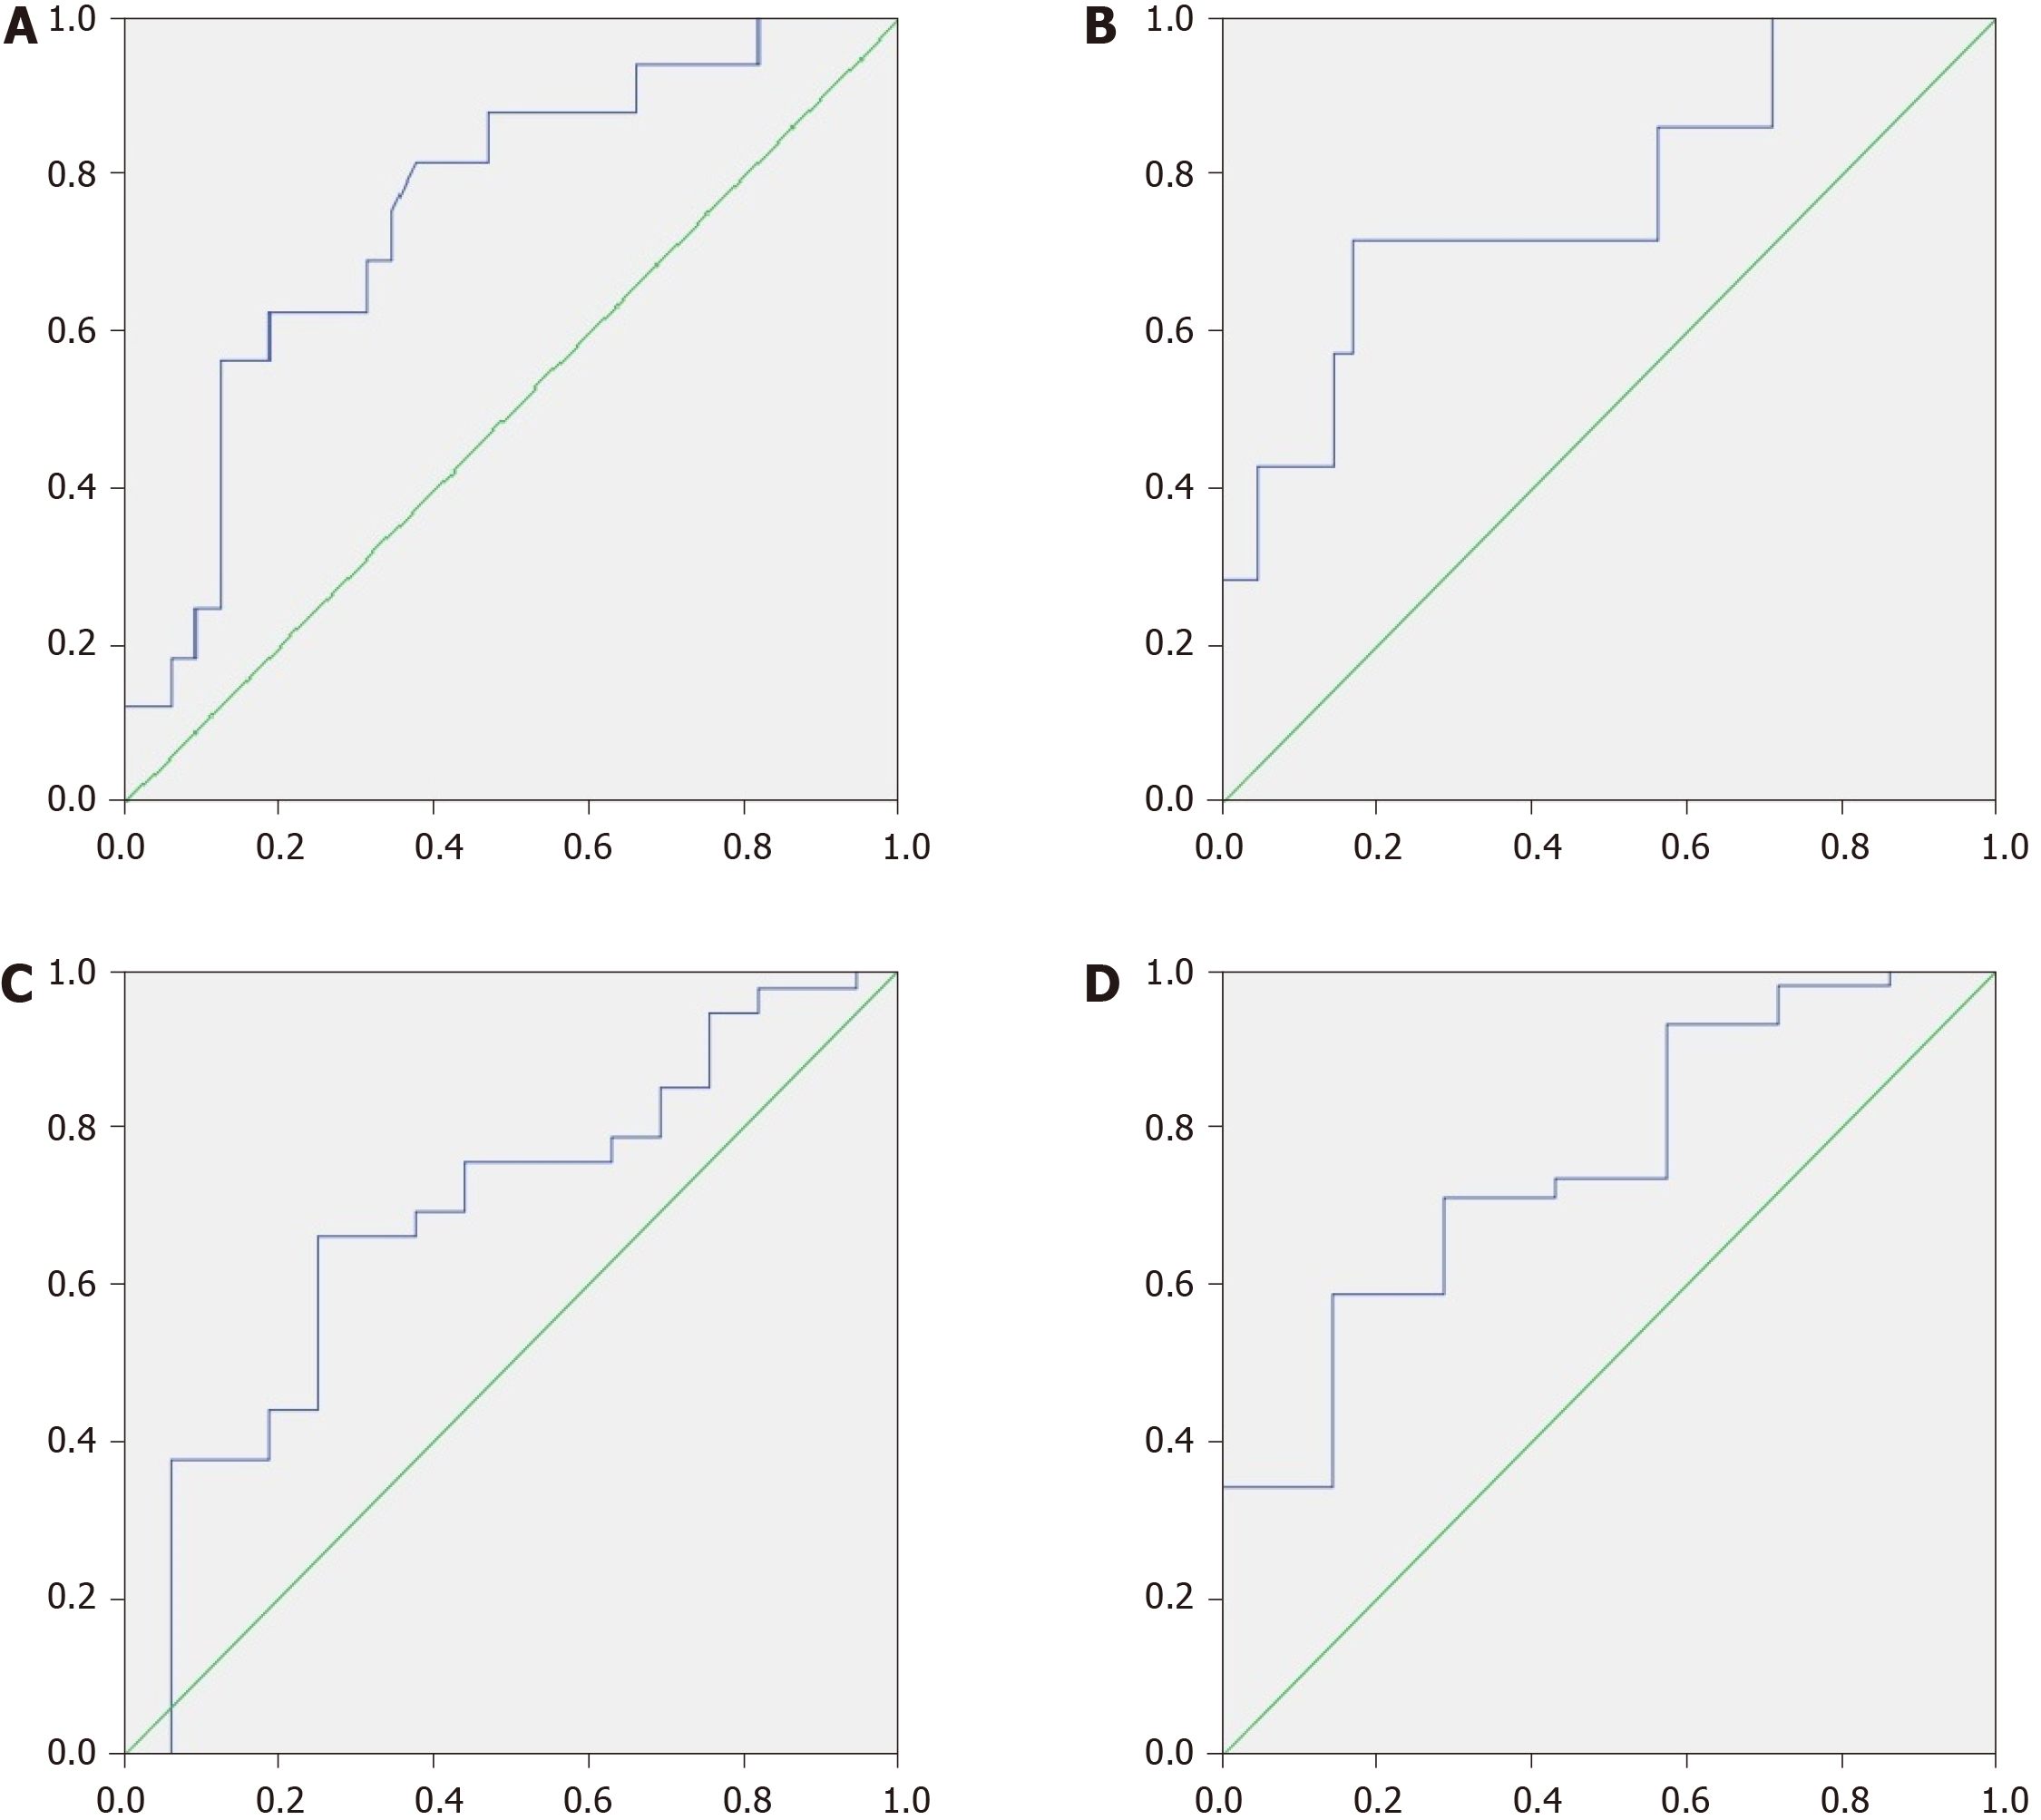
Figure 4 Receiver operating characteristic-analysis of modified dysbiosis ratio in predicting death.
A: During 4 years; B: During 1 year; and of cirrhosis dysbiosis ratio in predicting death; C: During 4 years; and D: During 1 year.
Figure 5 An abundance of the main taxa in patients who died during the first and the subsequent years of follow-up, survivors and healthy controls.
The middle point is the median, the box is the interquartile range, the whiskers are non-outlier range. A: Clostridia; B: Proteobacteria; C: Bacilli; and D: Bacteroidetes.
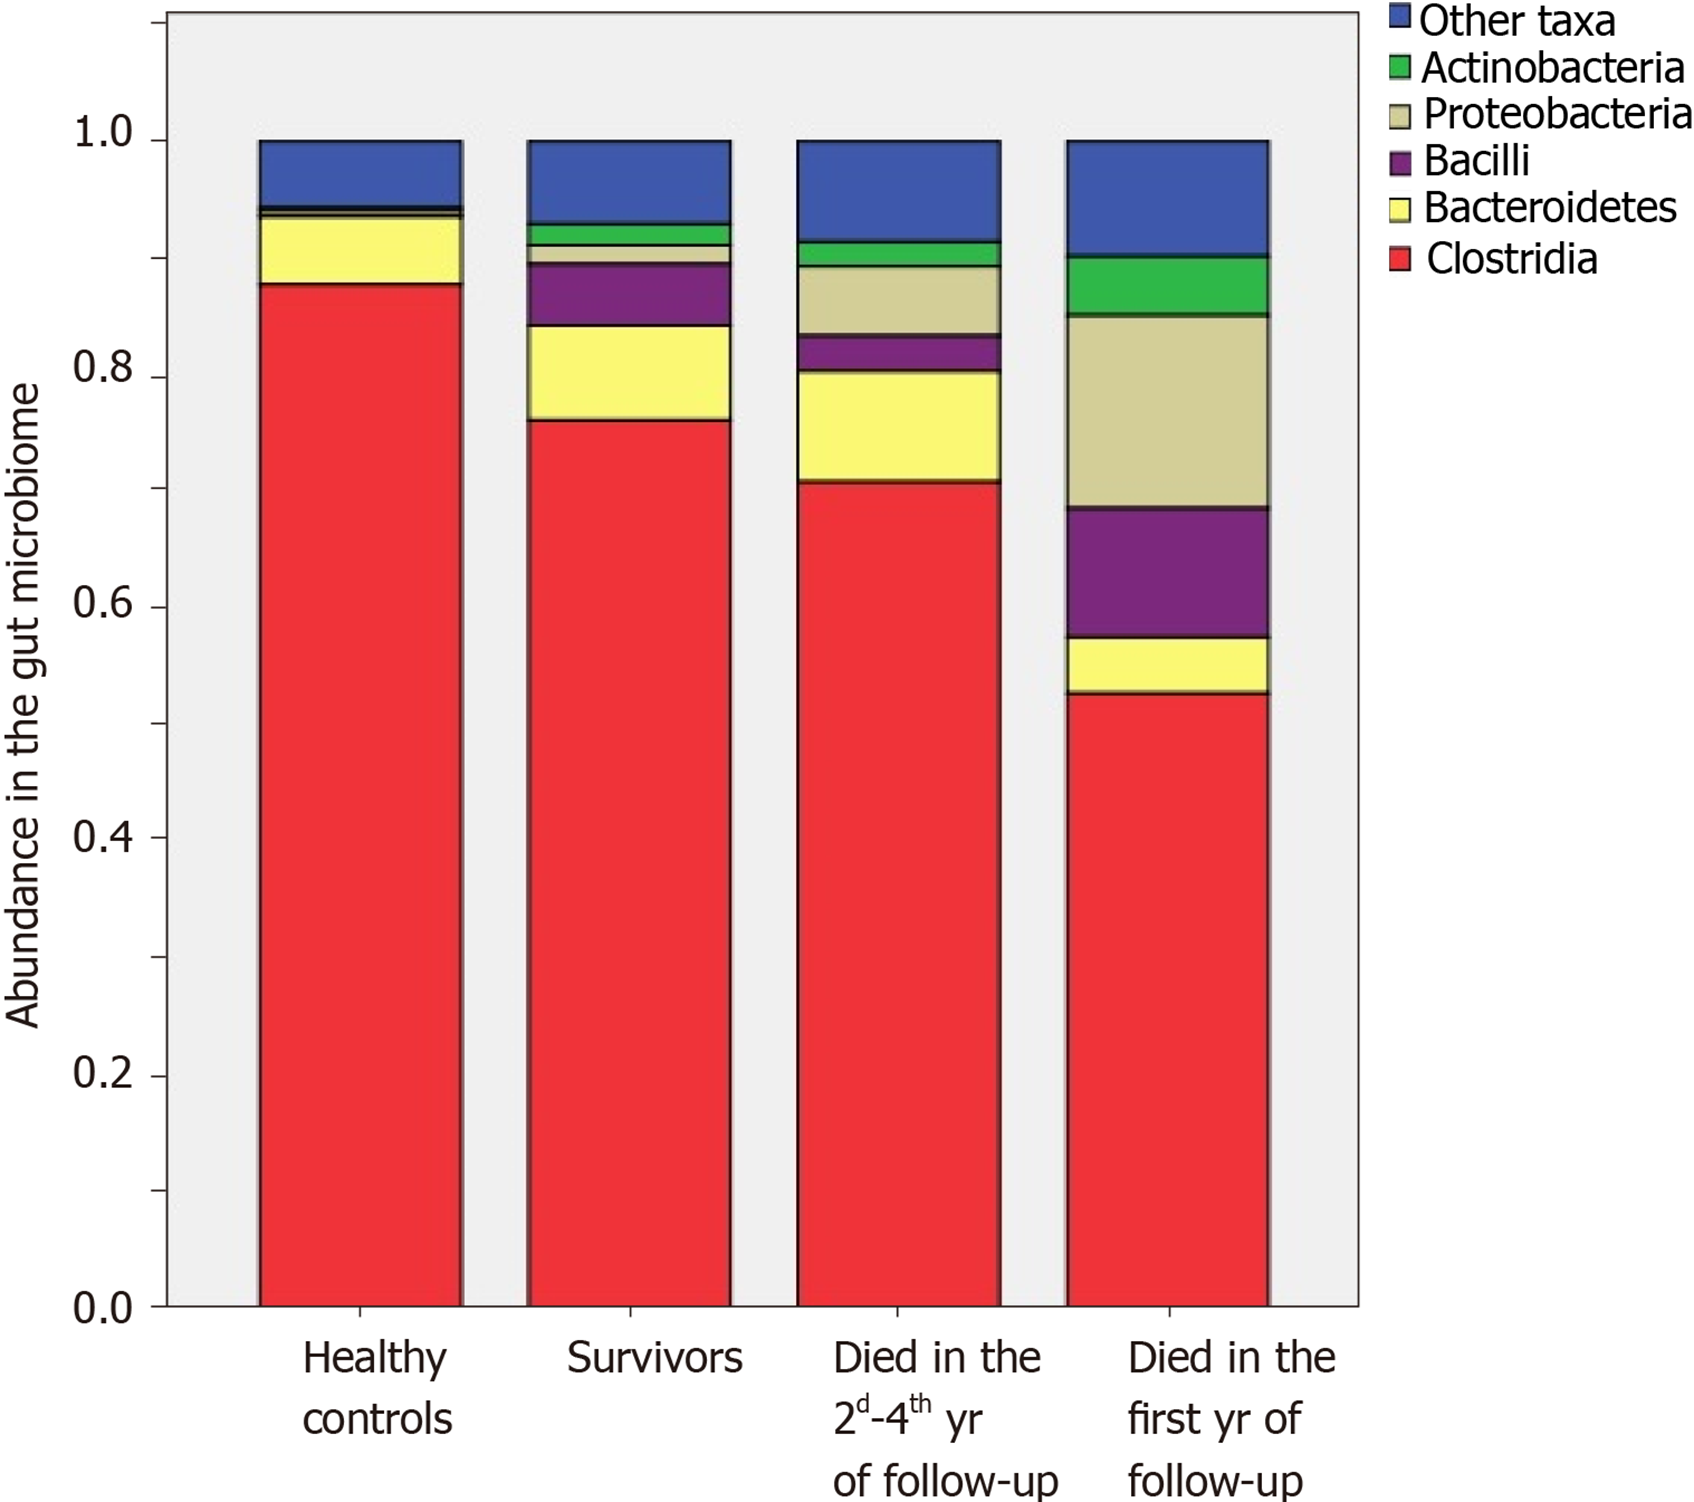
Figure 6 The composition of the gut microbiome in healthy individuals, survivors, and deceased in the first and subsequent 3 years.
- Citation: Maslennikov R, Ivashkin V, Efremova I, Alieva A, Kashuh E, Tsvetaeva E, Poluektova E, Shirokova E, Ivashkin K. Gut dysbiosis is associated with poorer long-term prognosis in cirrhosis. World J Hepatol 2021; 13(5): 557-570
- URL: https://www.wjgnet.com/1948-5182/full/v13/i5/557.htm
- DOI: https://dx.doi.org/10.4254/wjh.v13.i5.557


