Copyright
©The Author(s) 2021.
World J Hepatol. Dec 27, 2021; 13(12): 2161-2167
Published online Dec 27, 2021. doi: 10.4254/wjh.v13.i12.2161
Published online Dec 27, 2021. doi: 10.4254/wjh.v13.i12.2161
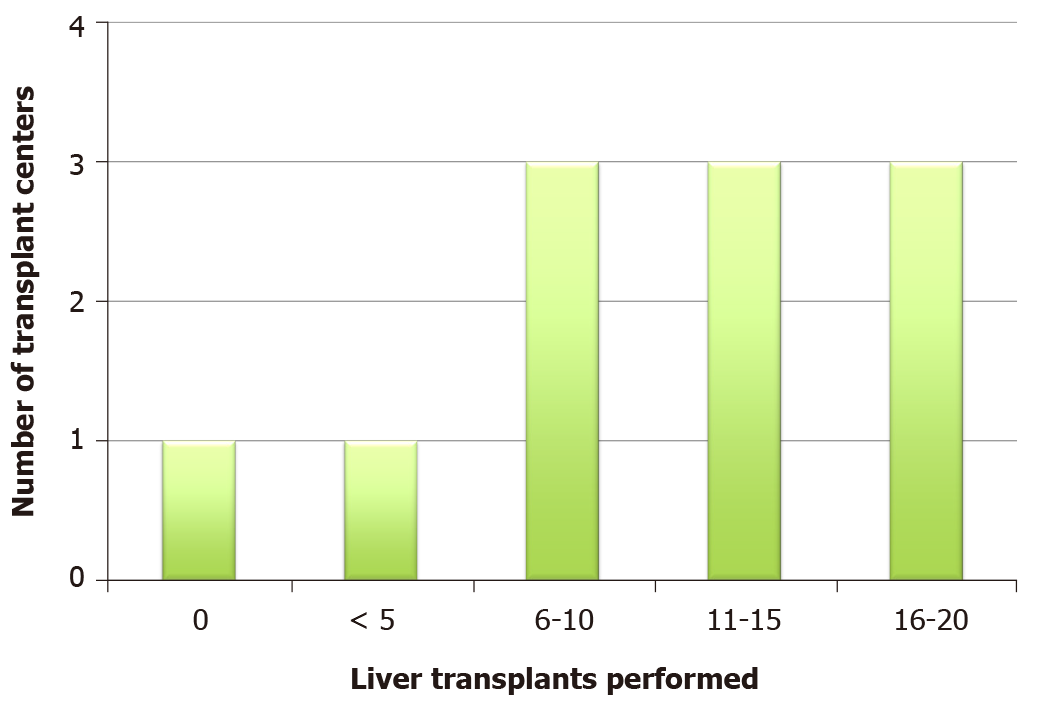
Figure 1 Number of transplants in the preceding 2 mo.
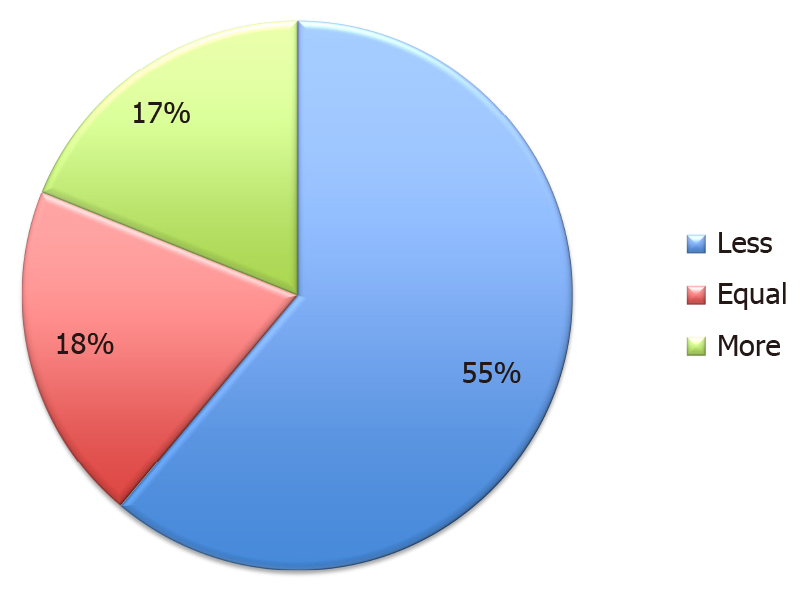
Figure 2 Comparison of liver transplants in 2020 compared to 2019.
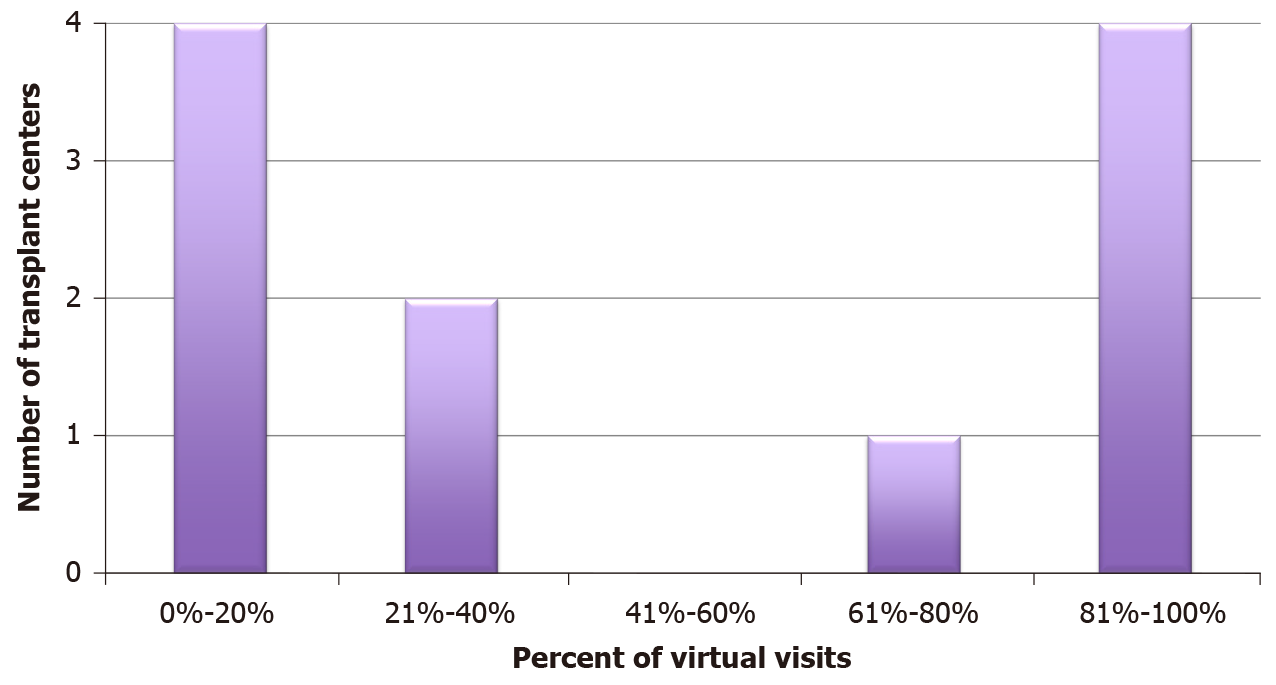
Figure 3 Percent of virtual visits.
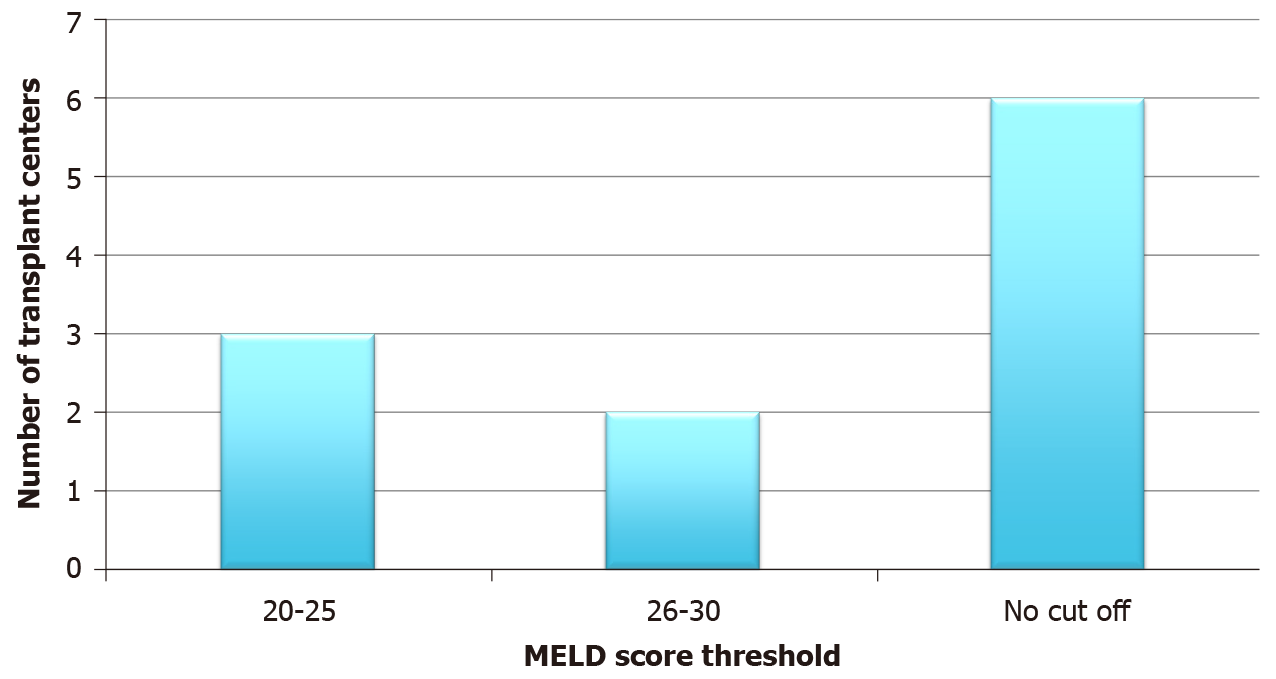
Figure 4 Model for end stage liver disease score cut-off for new evaluation.
MELD: Model for end stage liver disease.
- Citation: Gonzalez AJ, Kapila N, Thomas E, Pinna A, Tzakis A, Zervos XB. Managing liver transplantation during the COVID-19 pandemic: A survey among transplant centers in the Southeast United States. World J Hepatol 2021; 13(12): 2161-2167
- URL: https://www.wjgnet.com/1948-5182/full/v13/i12/2161.htm
- DOI: https://dx.doi.org/10.4254/wjh.v13.i12.2161


