Copyright
©The Author(s) 2021.
World J Hepatol. Dec 27, 2021; 13(12): 2081-2103
Published online Dec 27, 2021. doi: 10.4254/wjh.v13.i12.2081
Published online Dec 27, 2021. doi: 10.4254/wjh.v13.i12.2081
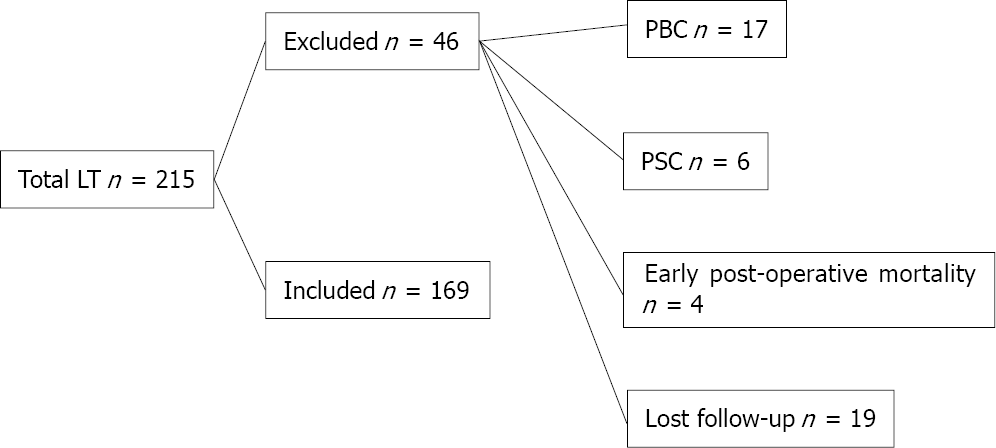
Figure 1 Flow chart of study cohort.
LT: Liver transplantation; PBC: Primary biliary cholangitis; PSC: Primary sclerosing cholangitis.
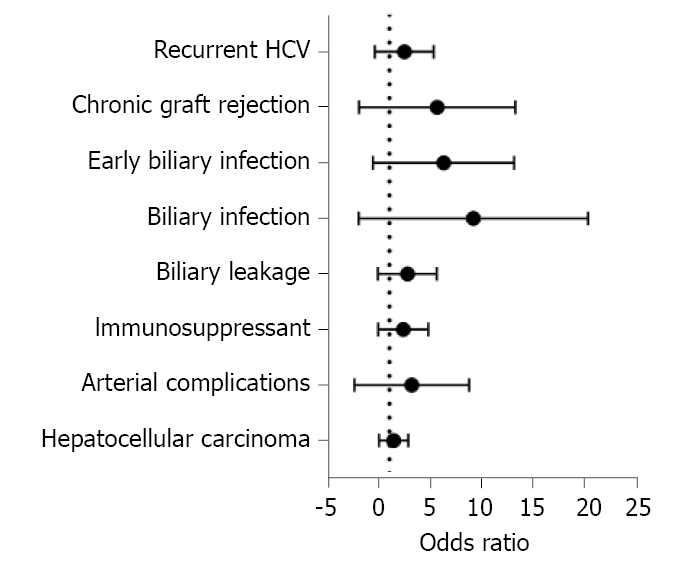
Figure 2 Forest plot for risk factors for biliary strictures.
HCV: Hepatitis C virus.
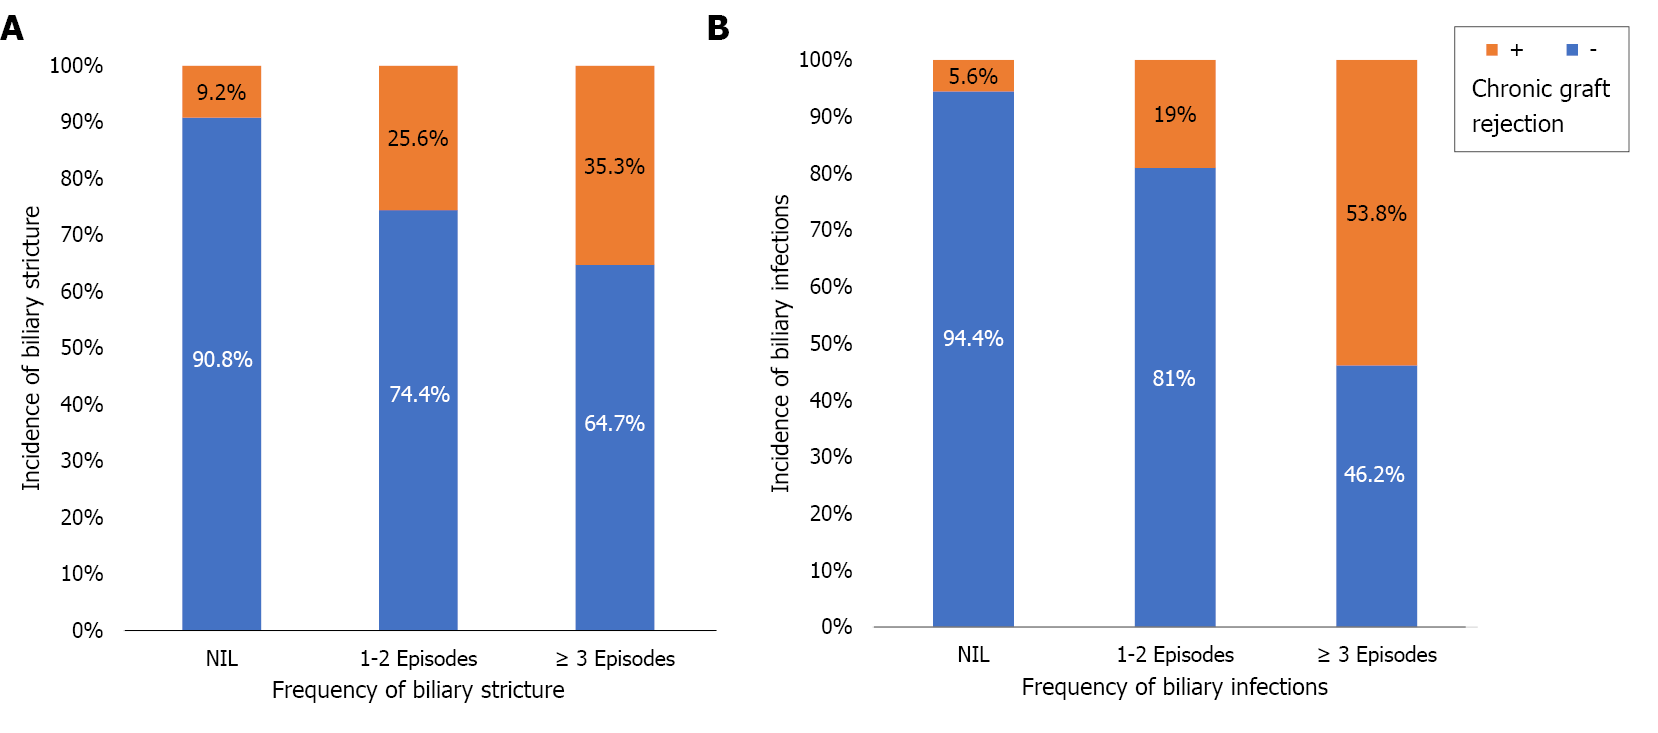
Figure 3 Incidence of chronic graft rejection according to the occurrence of biliary strictures (A) and biliary infections (B).
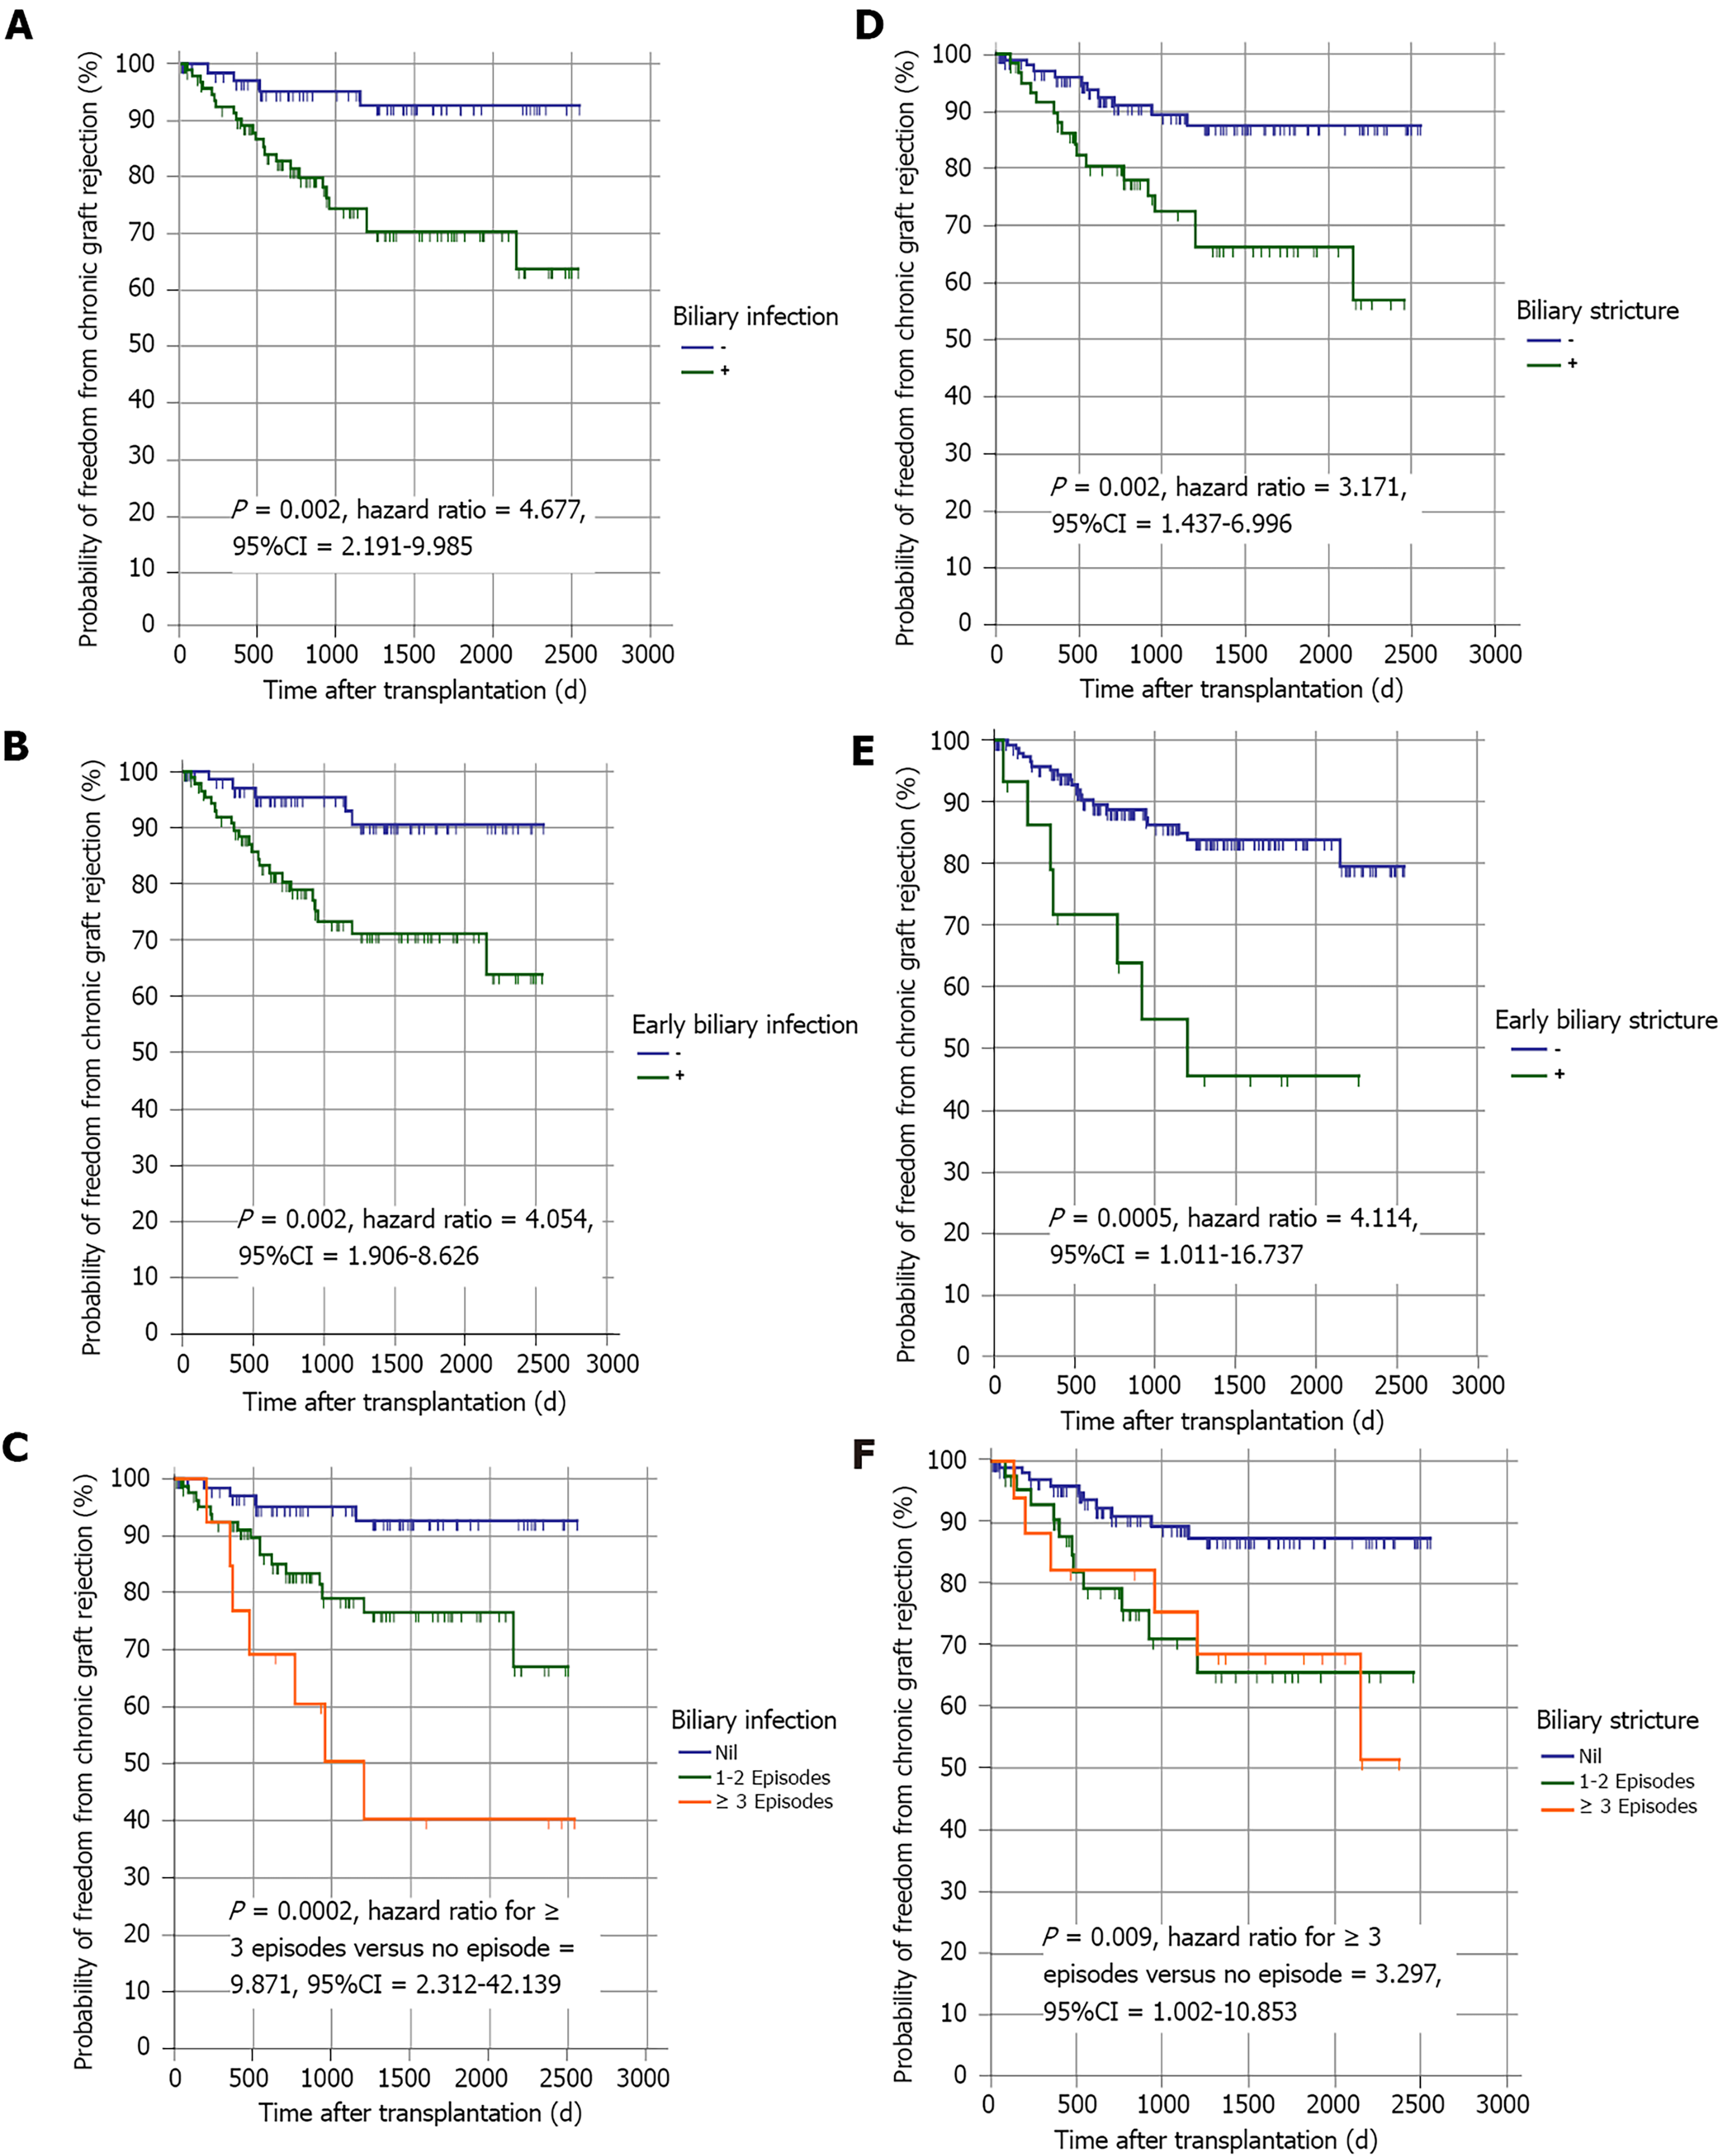
Figure 4 Kaplan-Meier curves.
A-C: The curves showing the probability of chronic graft rejection in patients regarding the occurrence (A), timing (B), and frequency (C) of biliary infection; D-F: The curves showing the probability of chronic graft rejection in patients regarding the occurrence (D), timing (E), and frequency (F) of biliary strictures.
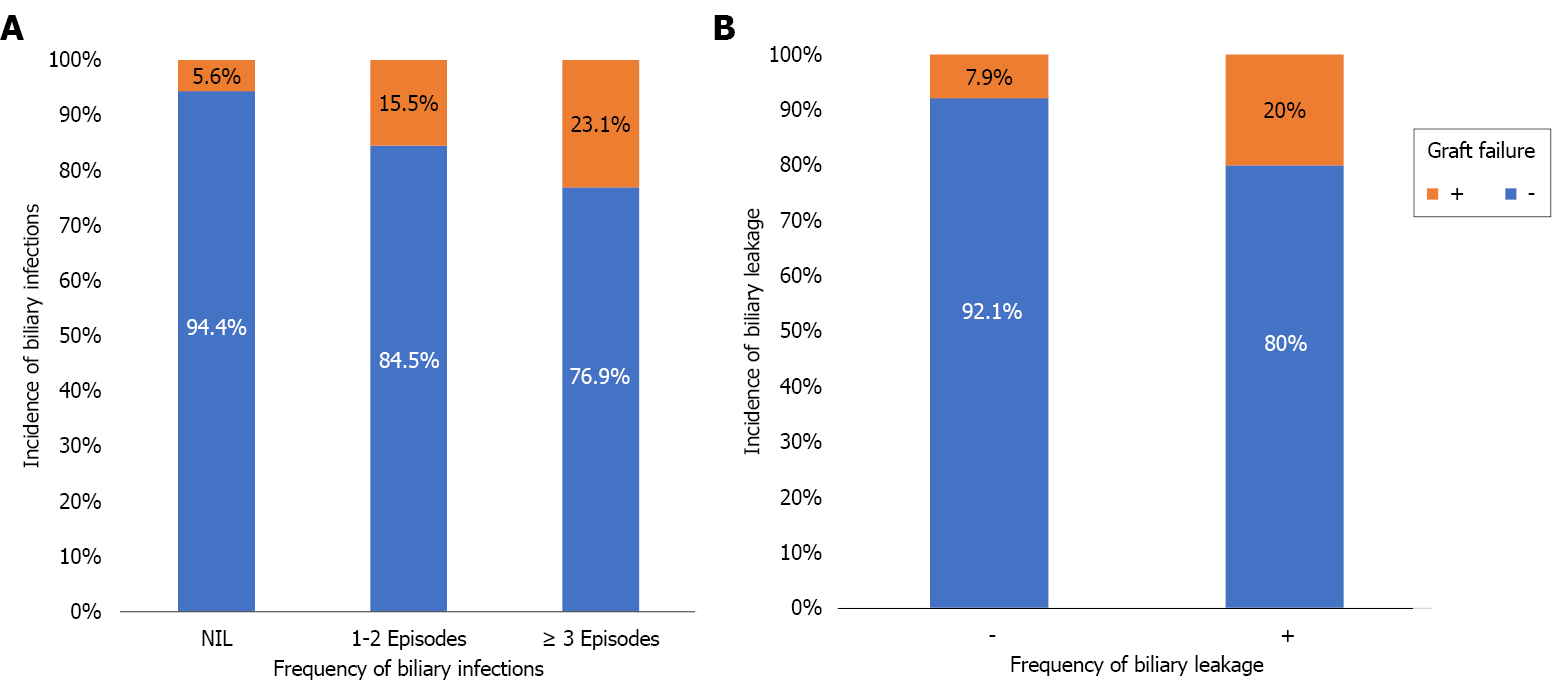
Figure 5 Incidence of graft failure according to the occurrence of biliary infections (A) and biliary leakage (B).
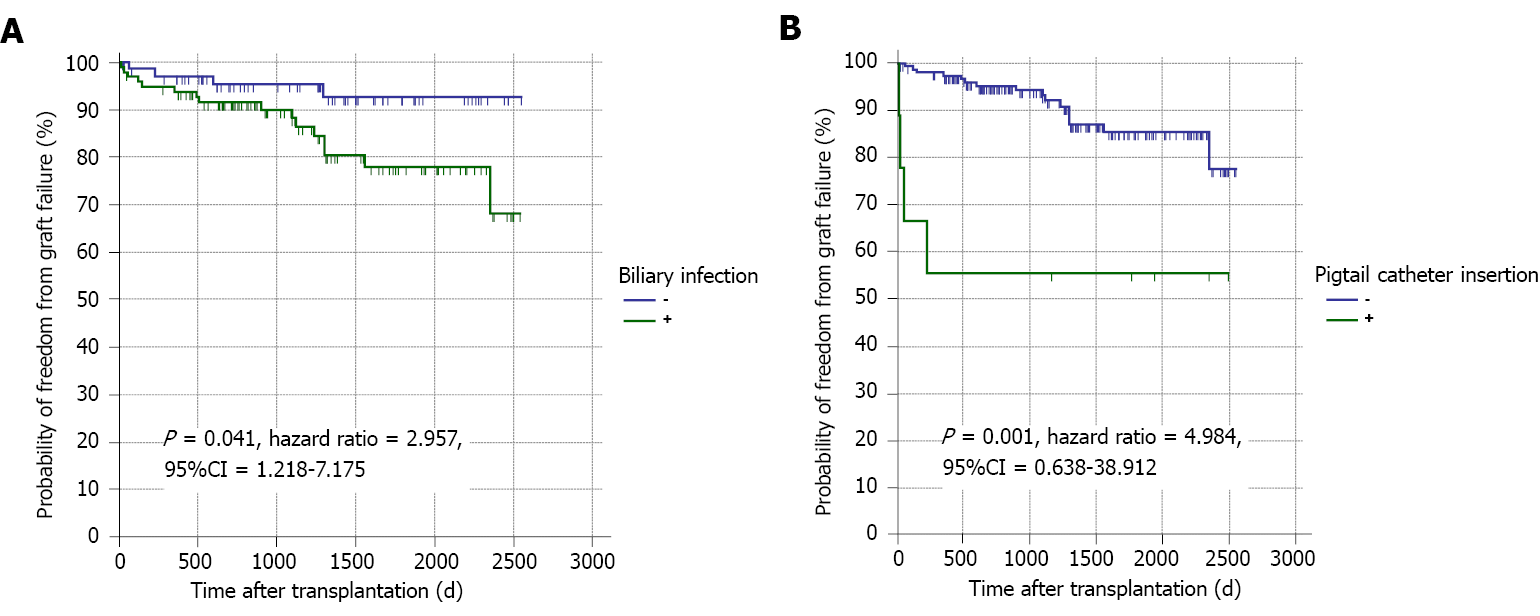
Figure 6 Kaplan-Meier curves.
The curves showing the probability of graft failure in patients regarding the occurrence of biliary infection (A) and large bile leaks as indicated by pigtail insertion (B).
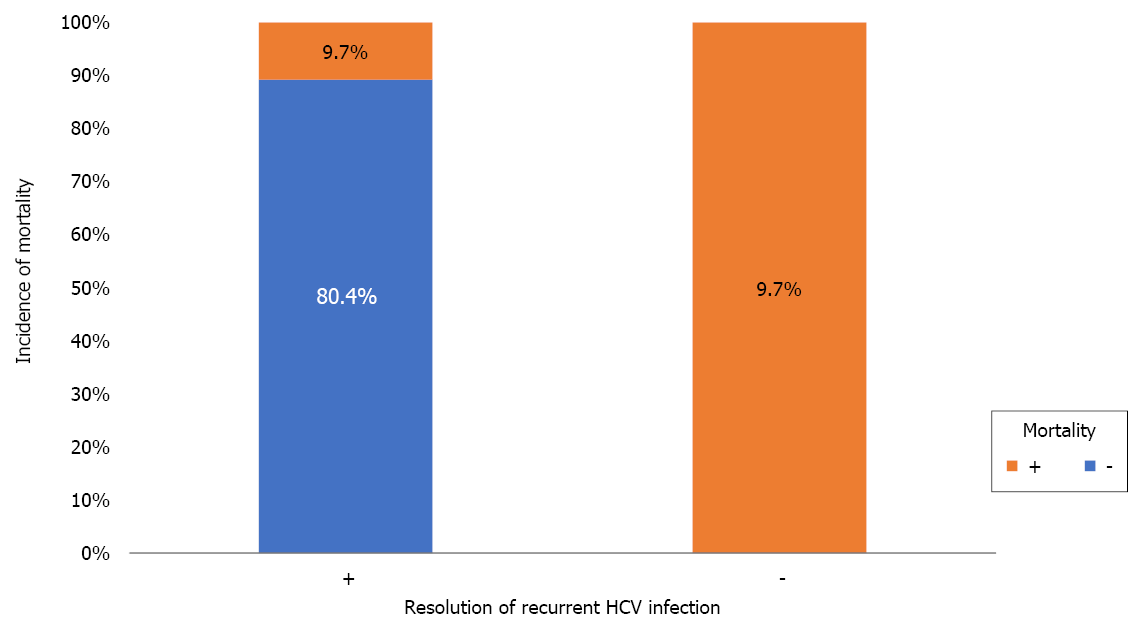
Figure 7 Mortality rate in patients with or without resolution of recurrent hepatitis C virus in patient with biliary stricture.
HCV: Hepatitis C virus.
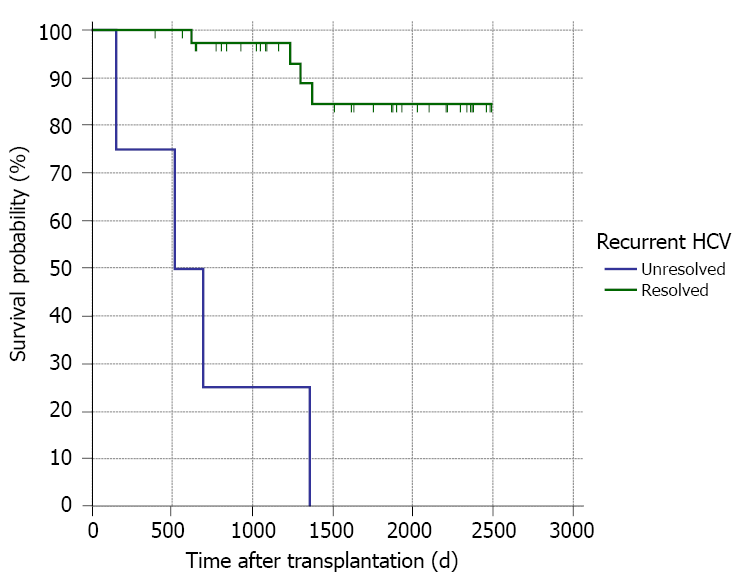
Figure 8 Kaplan-Meier curves showing the survival probability of patients with resolved or unresolved hepatitis C virus.
HCV: Hepatitis C virus.
- Citation: Guirguis RN, Nashaat EH, Yassin AE, Ibrahim WA, Saleh SA, Bahaa M, El-Meteini M, Fathy M, Dabbous HM, Montasser IF, Salah M, Mohamed GA. Biliary complications in recipients of living donor liver transplantation: A single-centre study . World J Hepatol 2021; 13(12): 2081-2103
- URL: https://www.wjgnet.com/1948-5182/full/v13/i12/2081.htm
- DOI: https://dx.doi.org/10.4254/wjh.v13.i12.2081


