Copyright
©The Author(s) 2021.
World J Hepatol. Dec 27, 2021; 13(12): 1936-1955
Published online Dec 27, 2021. doi: 10.4254/wjh.v13.i12.1936
Published online Dec 27, 2021. doi: 10.4254/wjh.v13.i12.1936
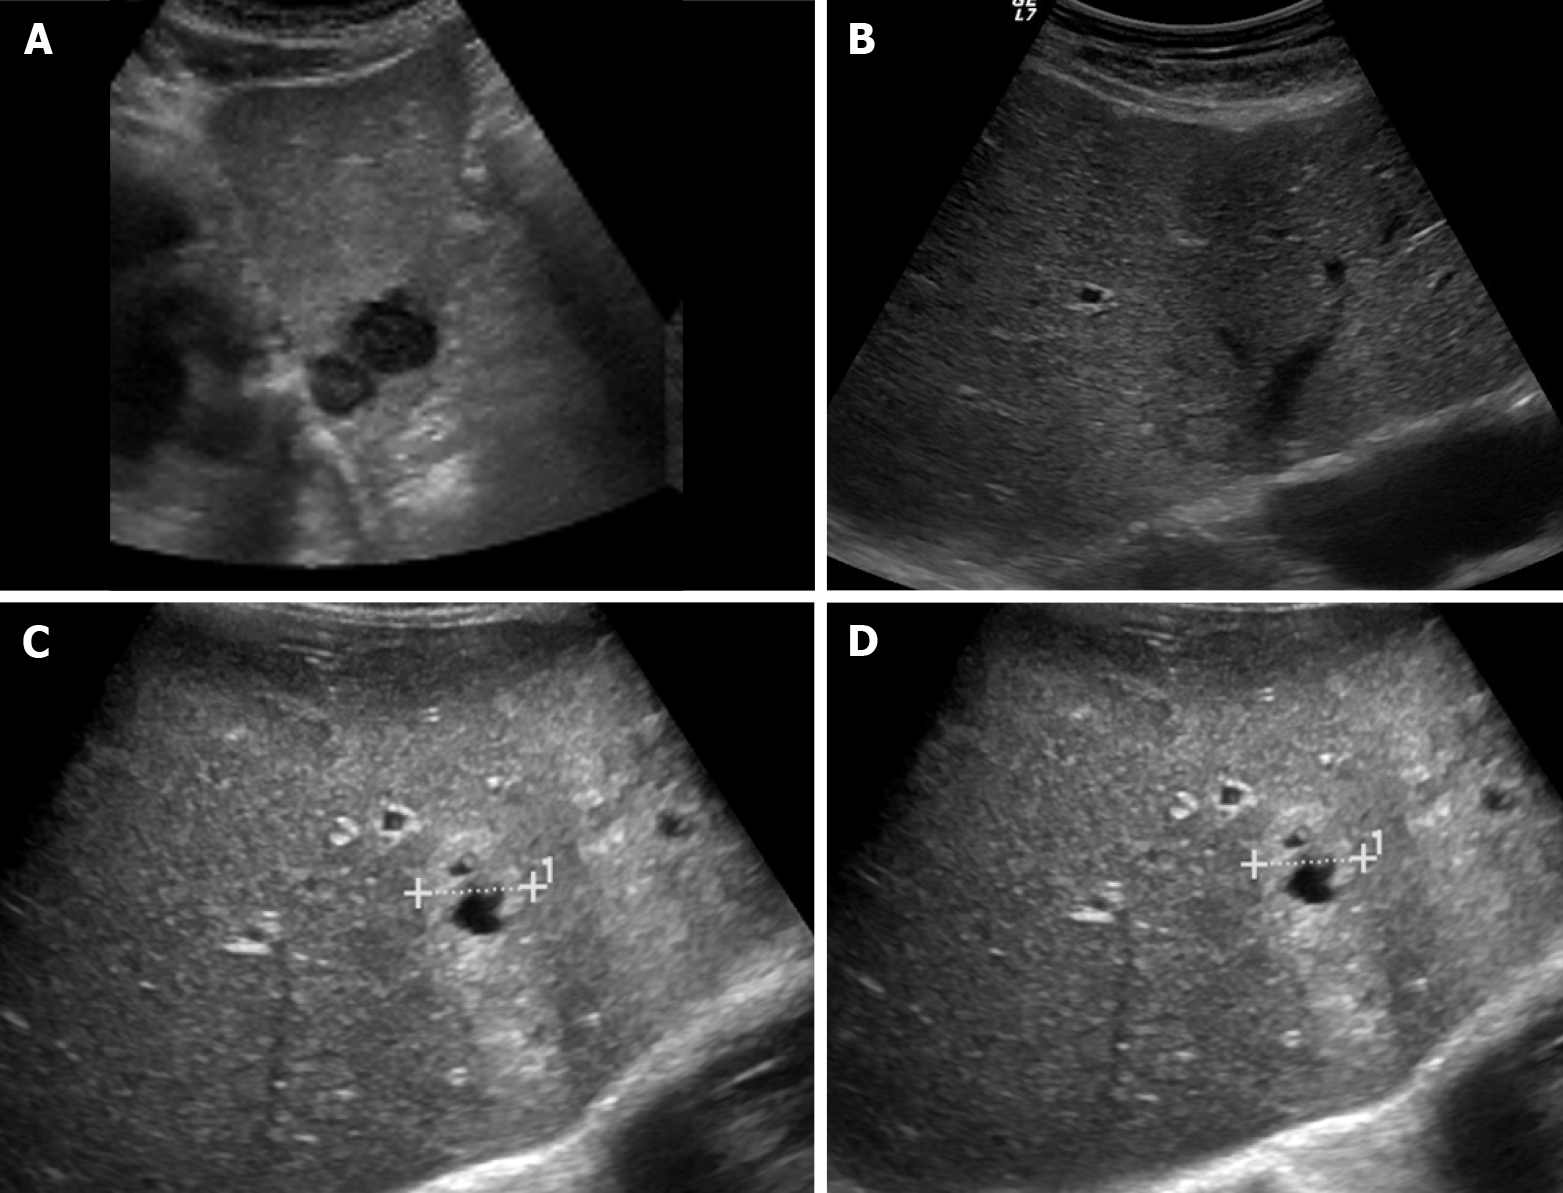
Figure 1 Ultrasound images showing variable echogenicity of liver metastases.
A: Two hypoechoic lesions in the left liver lobe consistent with metastases in a patient with lung cancer; B: Isoechoic liver metastasis from lung cancer demonstrating a hypoechoic halo; C: Occult primary tumor with hepatic metastases, predominantly solid and hyperechoic; D: Occult primary tumor with hepatic metastases, showing central necrosis.
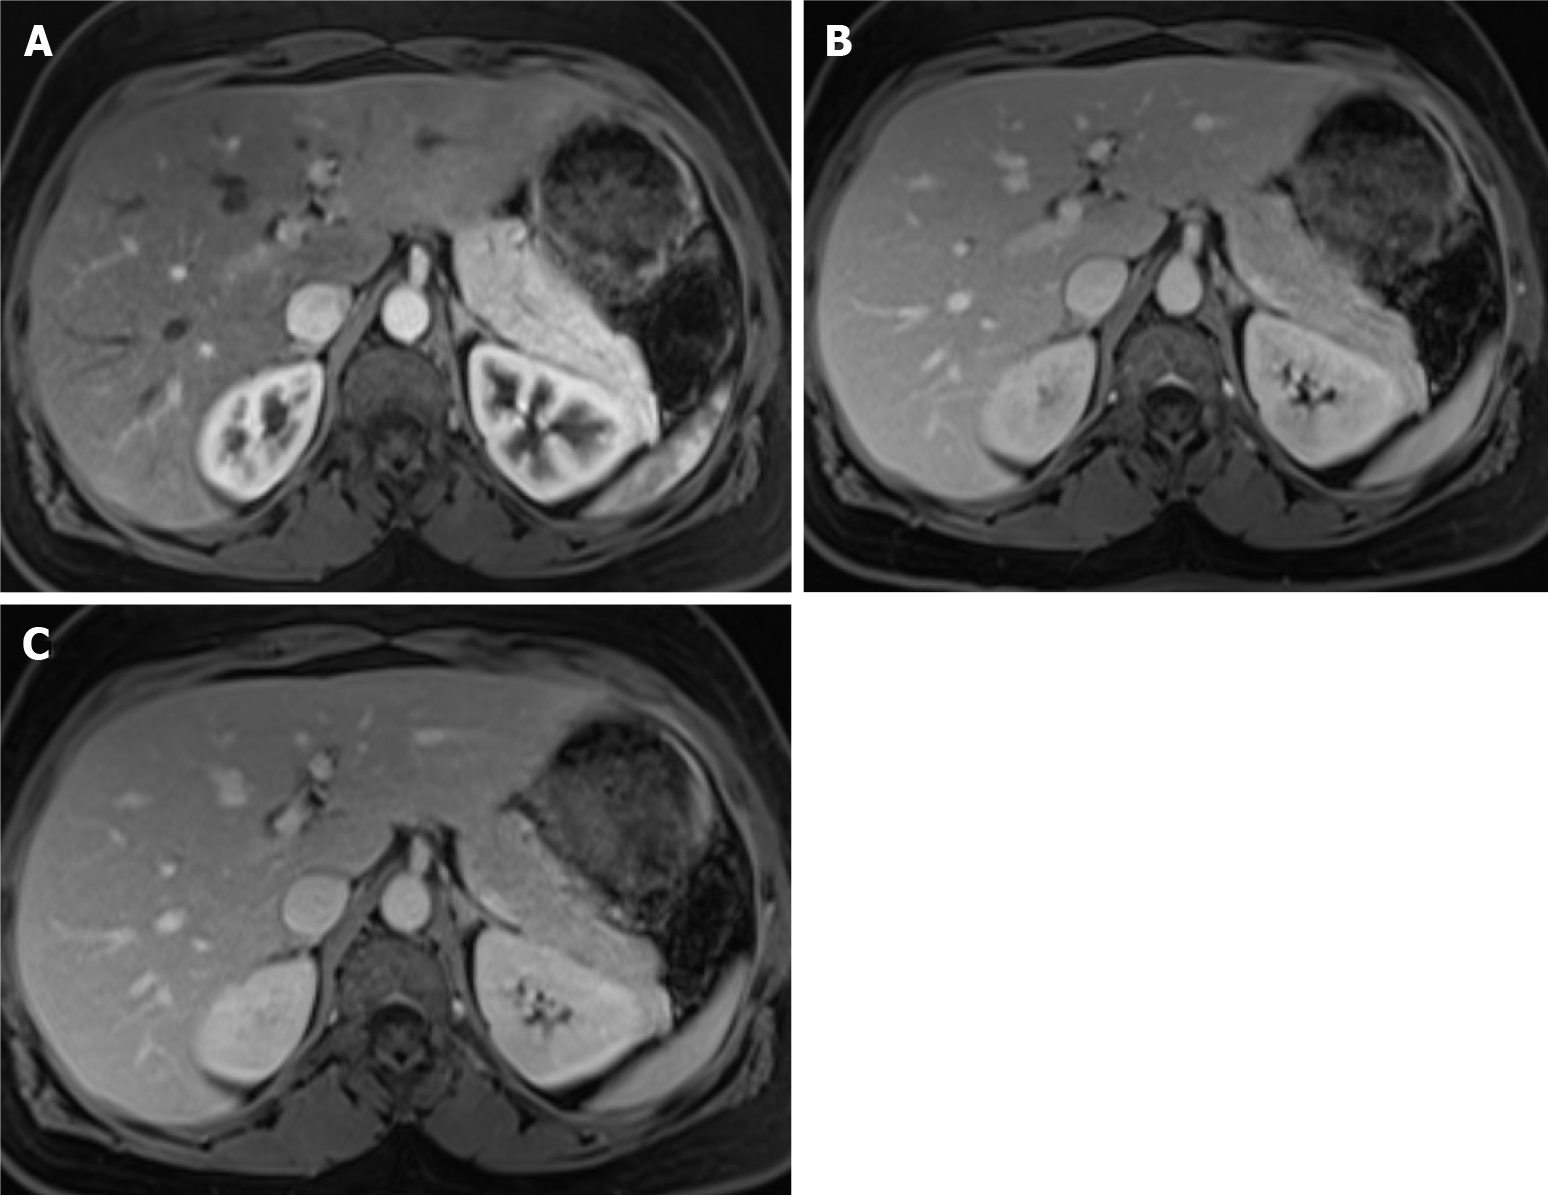
Figure 2 Dynamic phases of enhancement.
A: Late hepatic arterial phase. It is characterized by contrast in hepatic arteries and portal veins, not in hepatic veins. It is helpful for hypervascular lesions and perfusional abnormalities. Note that the normal pancreas enhances greater than the liver; B: Portal venous phase. It is recognized by the contrast in the hepatic and portal veins. It is useful mainly for hypovascular lesion detection; C: Interstitial or delayed phase. It is helpful for lesion characterization, especially for late enhancement perception.
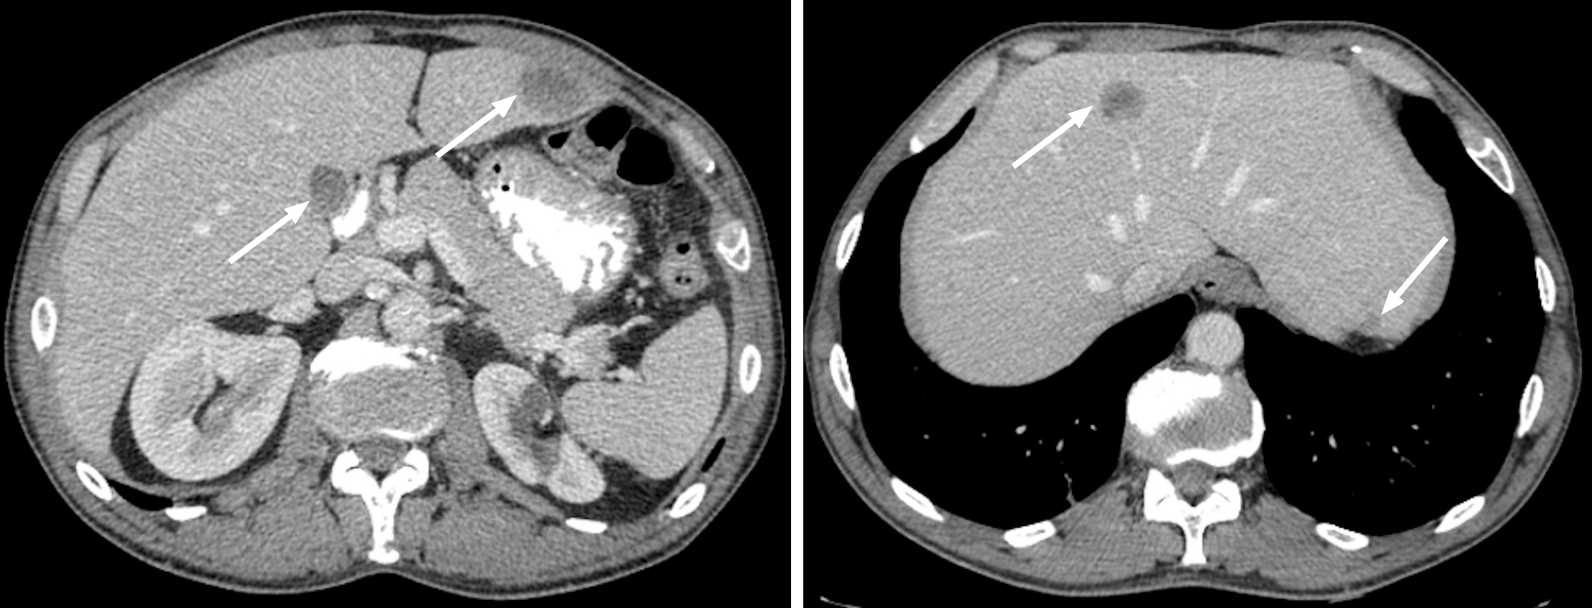
Figure 3 Metastatic lesions from lung cancer.
Axial contrast-enhanced computed tomography in the portal-venous phase shows multiple hypodense and hypovascular lesions (arrows) consistent with metastatic lesions from lung cancer.
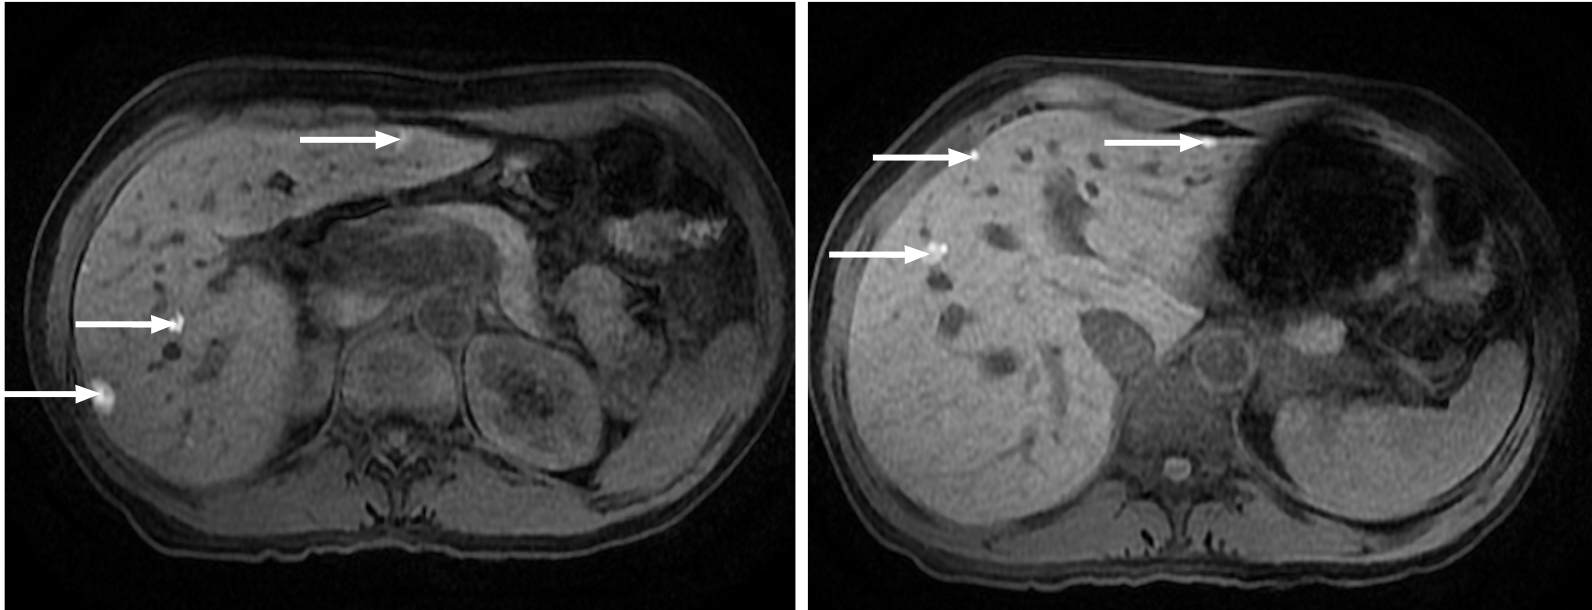
Figure 4 Multiple liver metastases from melanoma.
Hepatic metastases showing a characteristic high signal on fat saturated T1-weighted imaging due to their melanocytic content (arrows).
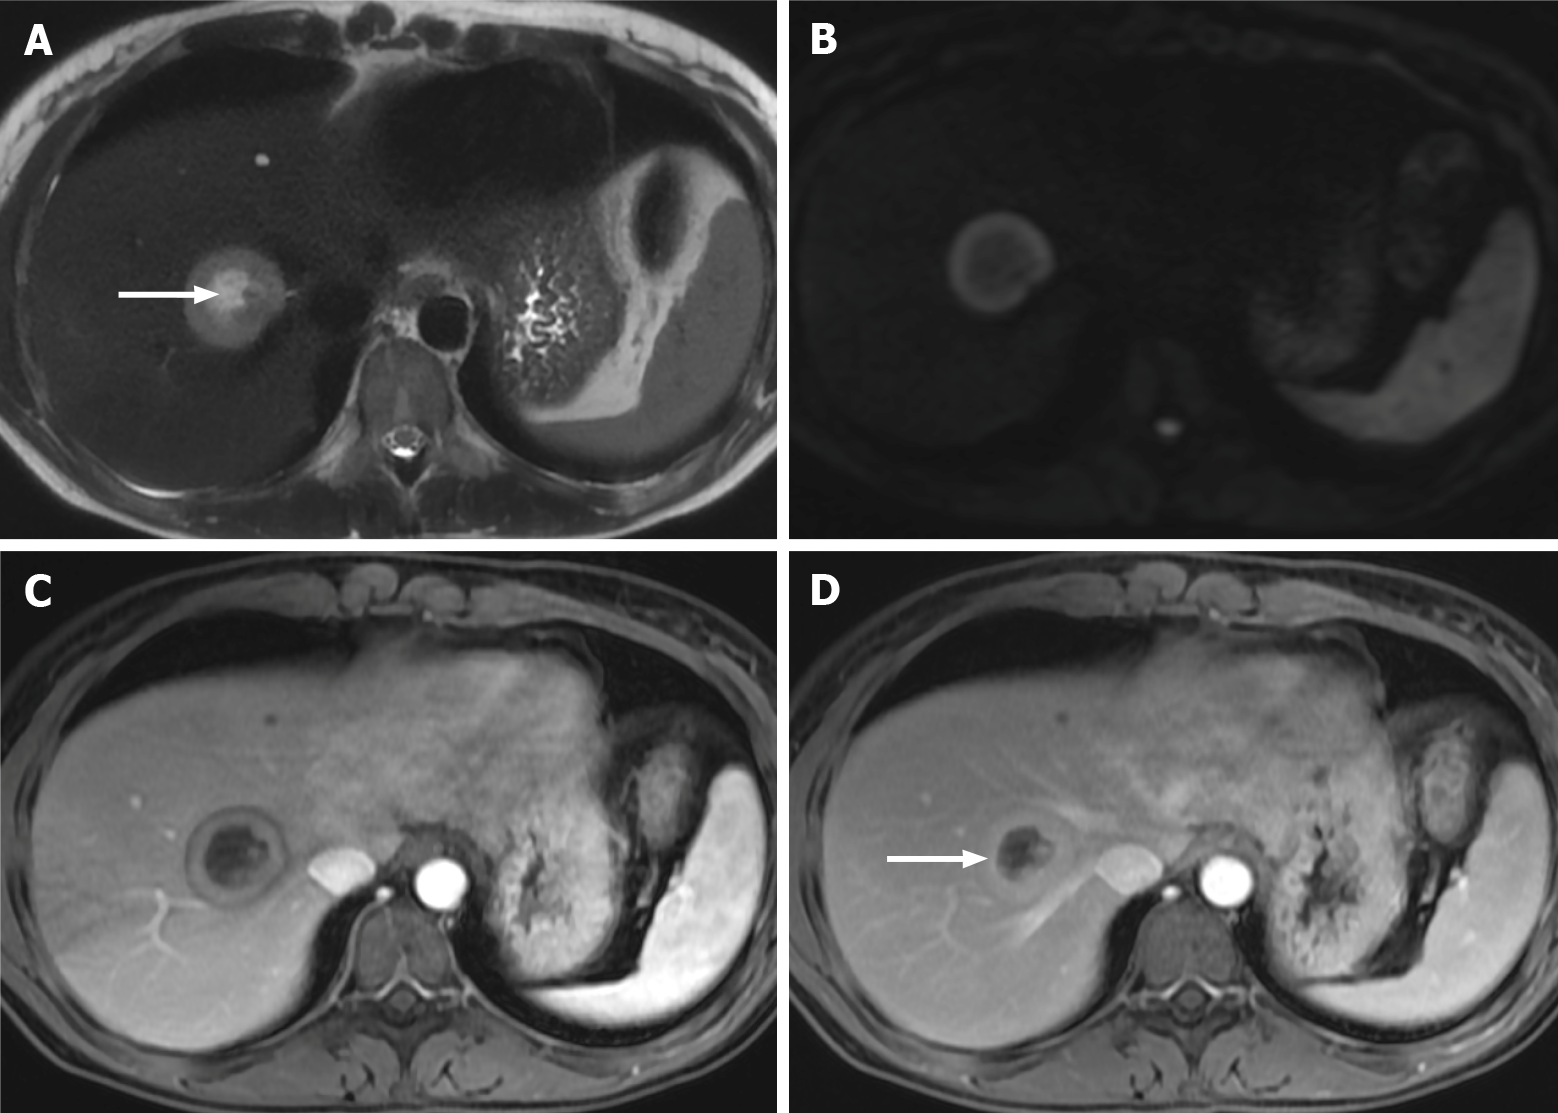
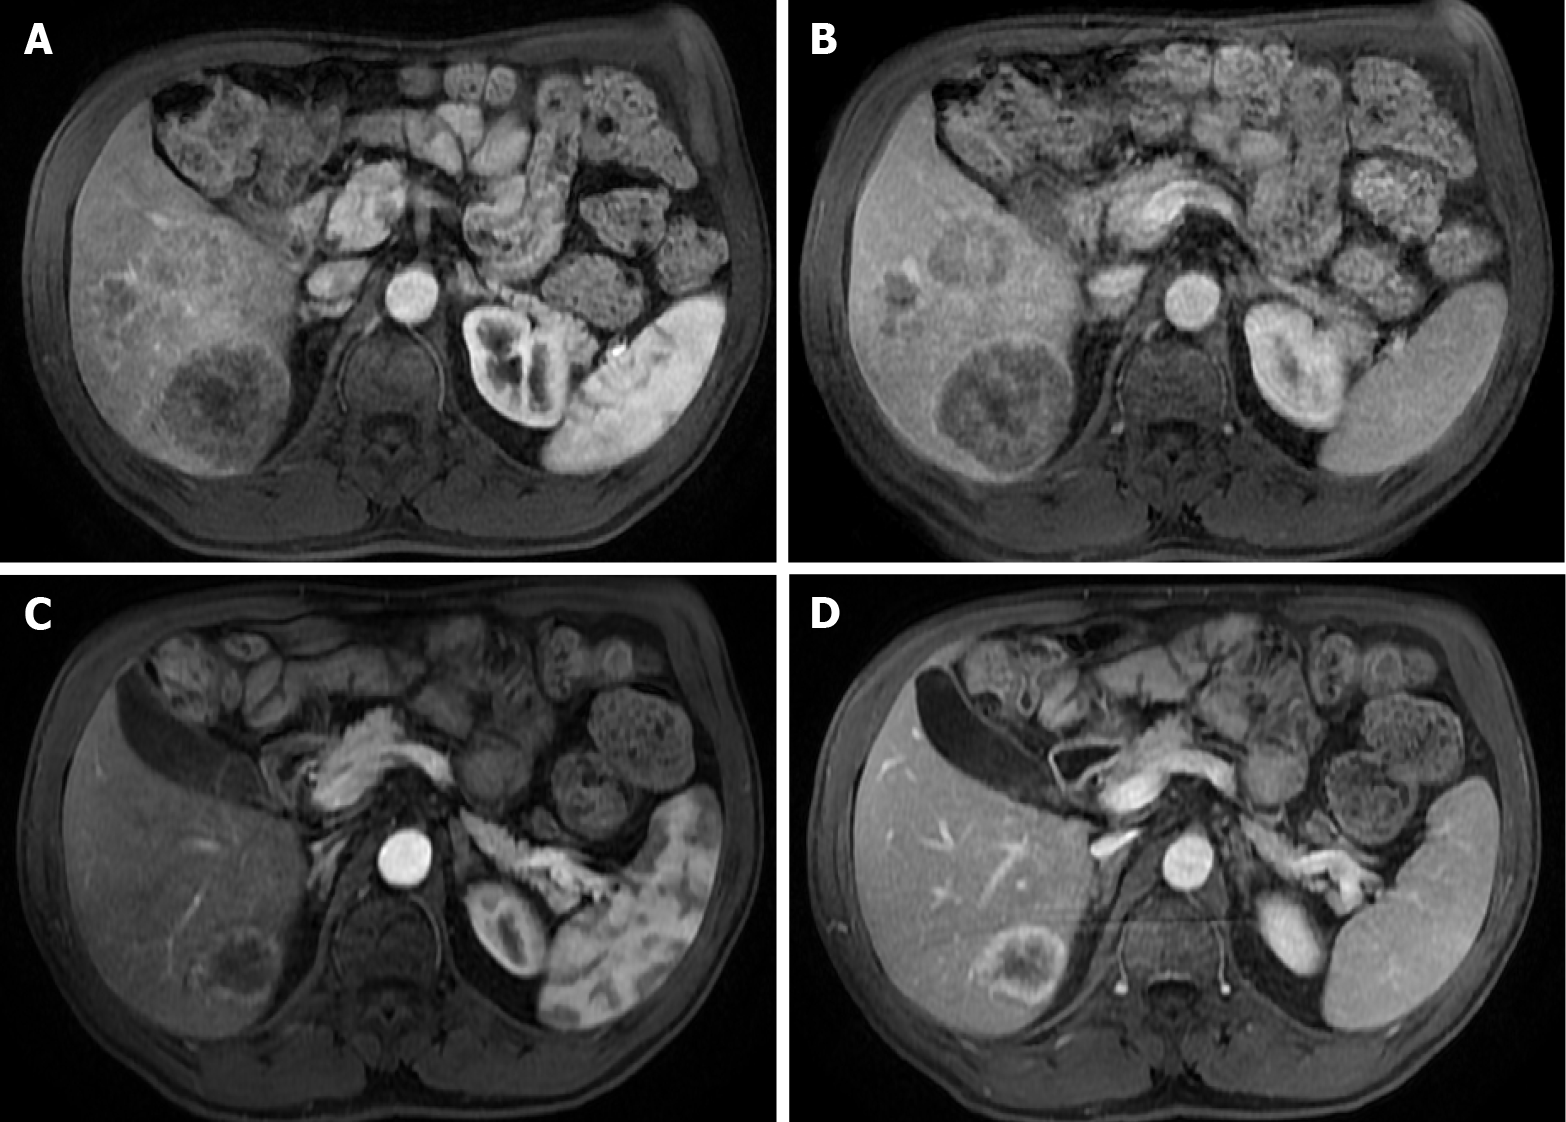
Figure 5 Right lobe liver metastasis from breast cancer.
A: Axial T2-weighted imaging (WI) of the metastatic lesion shows a target sign characterized as a hyperintense center (arrow) - necrosis - marginated by a lesser intense rim of viable tumor; B: Diffusion WI shows viable tumor characterized by an increased signal; C: Axial fat sat (FS) contrast-enhanced magnetic resonance imaging (CE-MRI) T1-WI in the arterial phase shows a characteristic doughnut sign; D: Axial FS CE-MRI T1-WI in the interstitial phase reveals a mild progressive enhancement of the peripheral tumor (arrow).
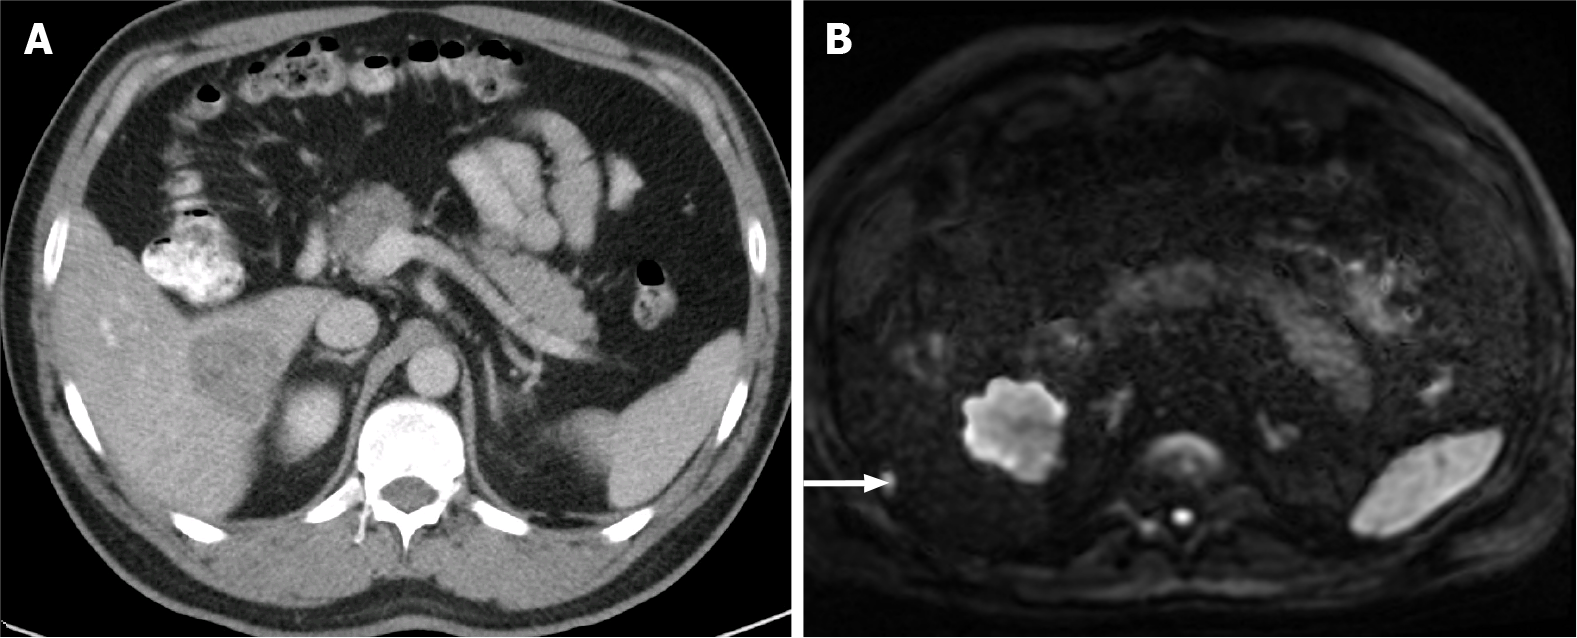
Figure 6 A 85-year-old man with a large hypovascular metastasis in the right lobe from pancreatic carcinoma proposed for tumorectomy.
A: Axial contrast-enhanced computed tomography (CE-CT) in the portal-venous phase shows a large hypodense and hypovascular metastasis; B: The patient underwent magnetic resonance imaging. An additional subcapsular small metastasis was depicted in diffusion-weighted imaging (DWI) (arrow). This example illustrates the higher sensitivity for lesion detection of DWI compared to CT.
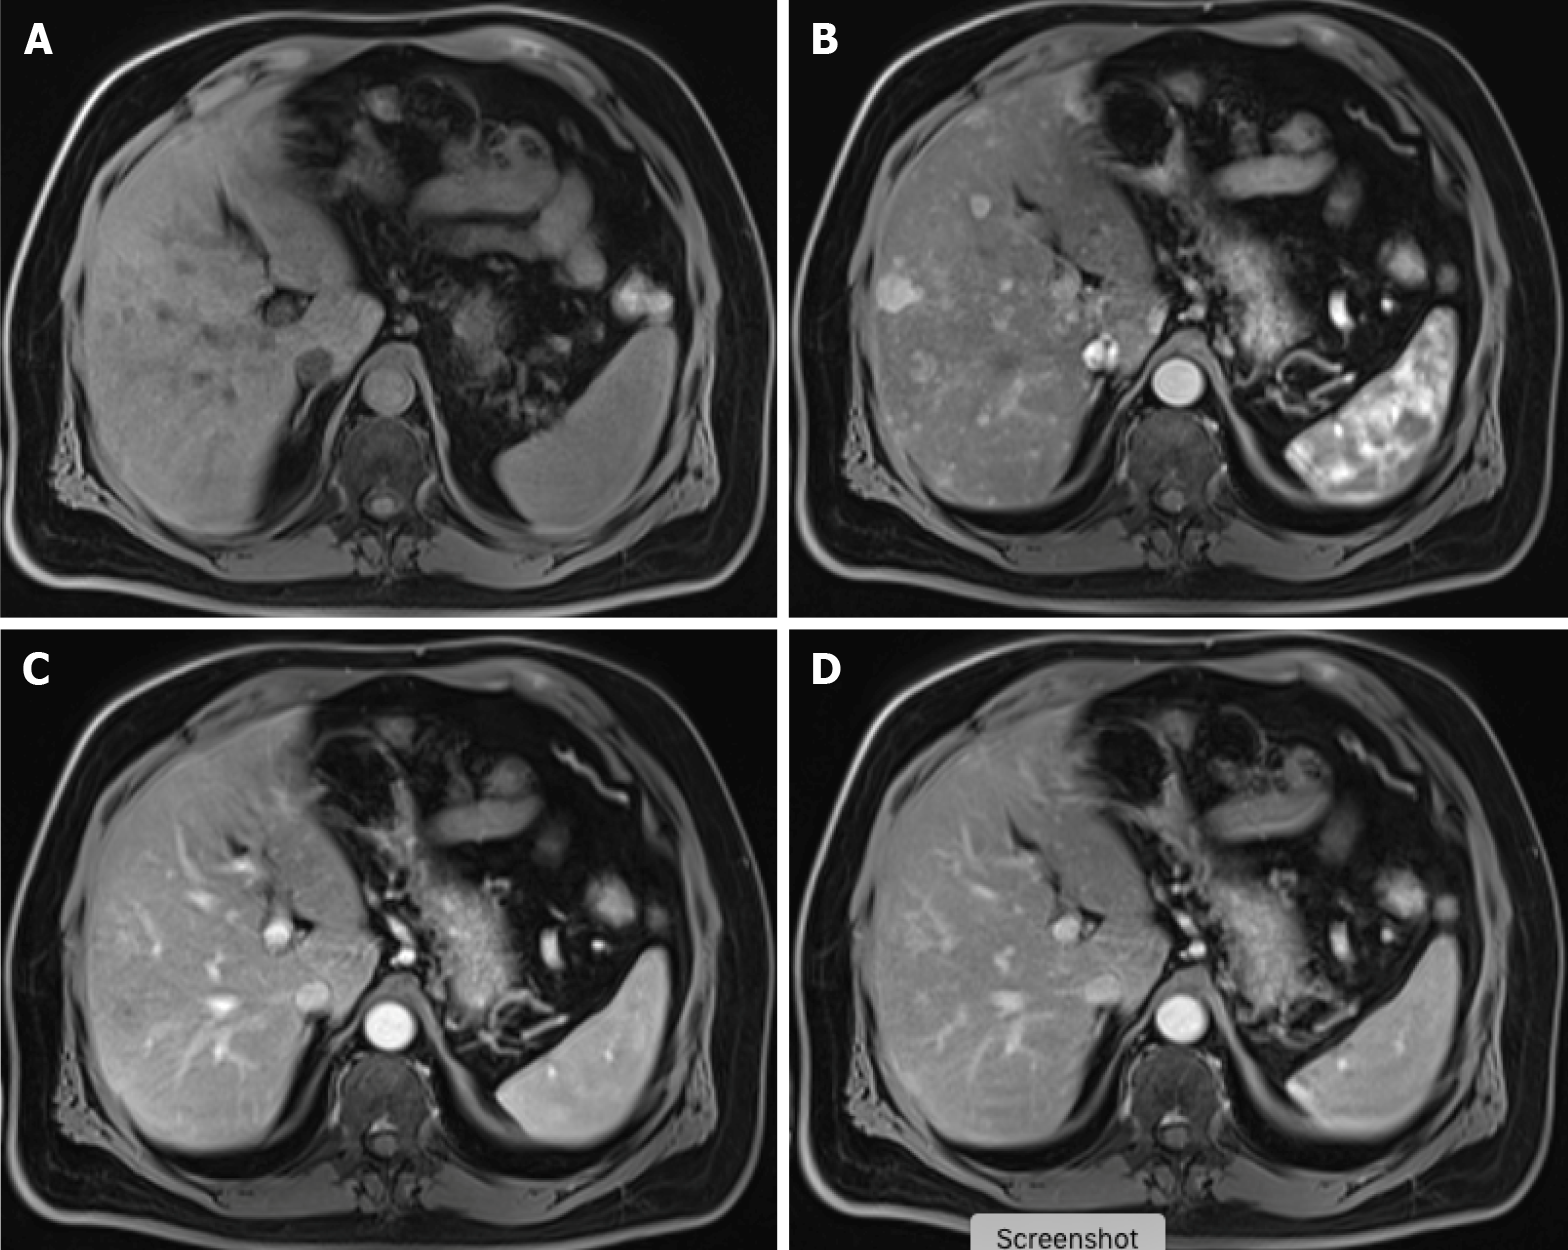
Figure 7 Carcinoid tumor with countless hypervascular liver metastases.
A: Axial fat saturated (FS) non-contrast-enhanced magnetic resonance imaging (CE-MRI) T1-weighted imaging (WI) with barely imperceptible hypointense lesions; B: Axial FS CE-MRI T1-WI in the arterial phase detecting multiple hyperenhancing lesions compatible with hypervascular liver metastases; C: Axial FS CE-MRI T1-WI in the portal-venous phase shows fast fading of the lesions previously depicted; D: In the axial FS CE-MRI T1-WI in the delayed phase, the lesions become barely imperceptible. The arterial phase is crucial for the detection of hypervascular metastases.
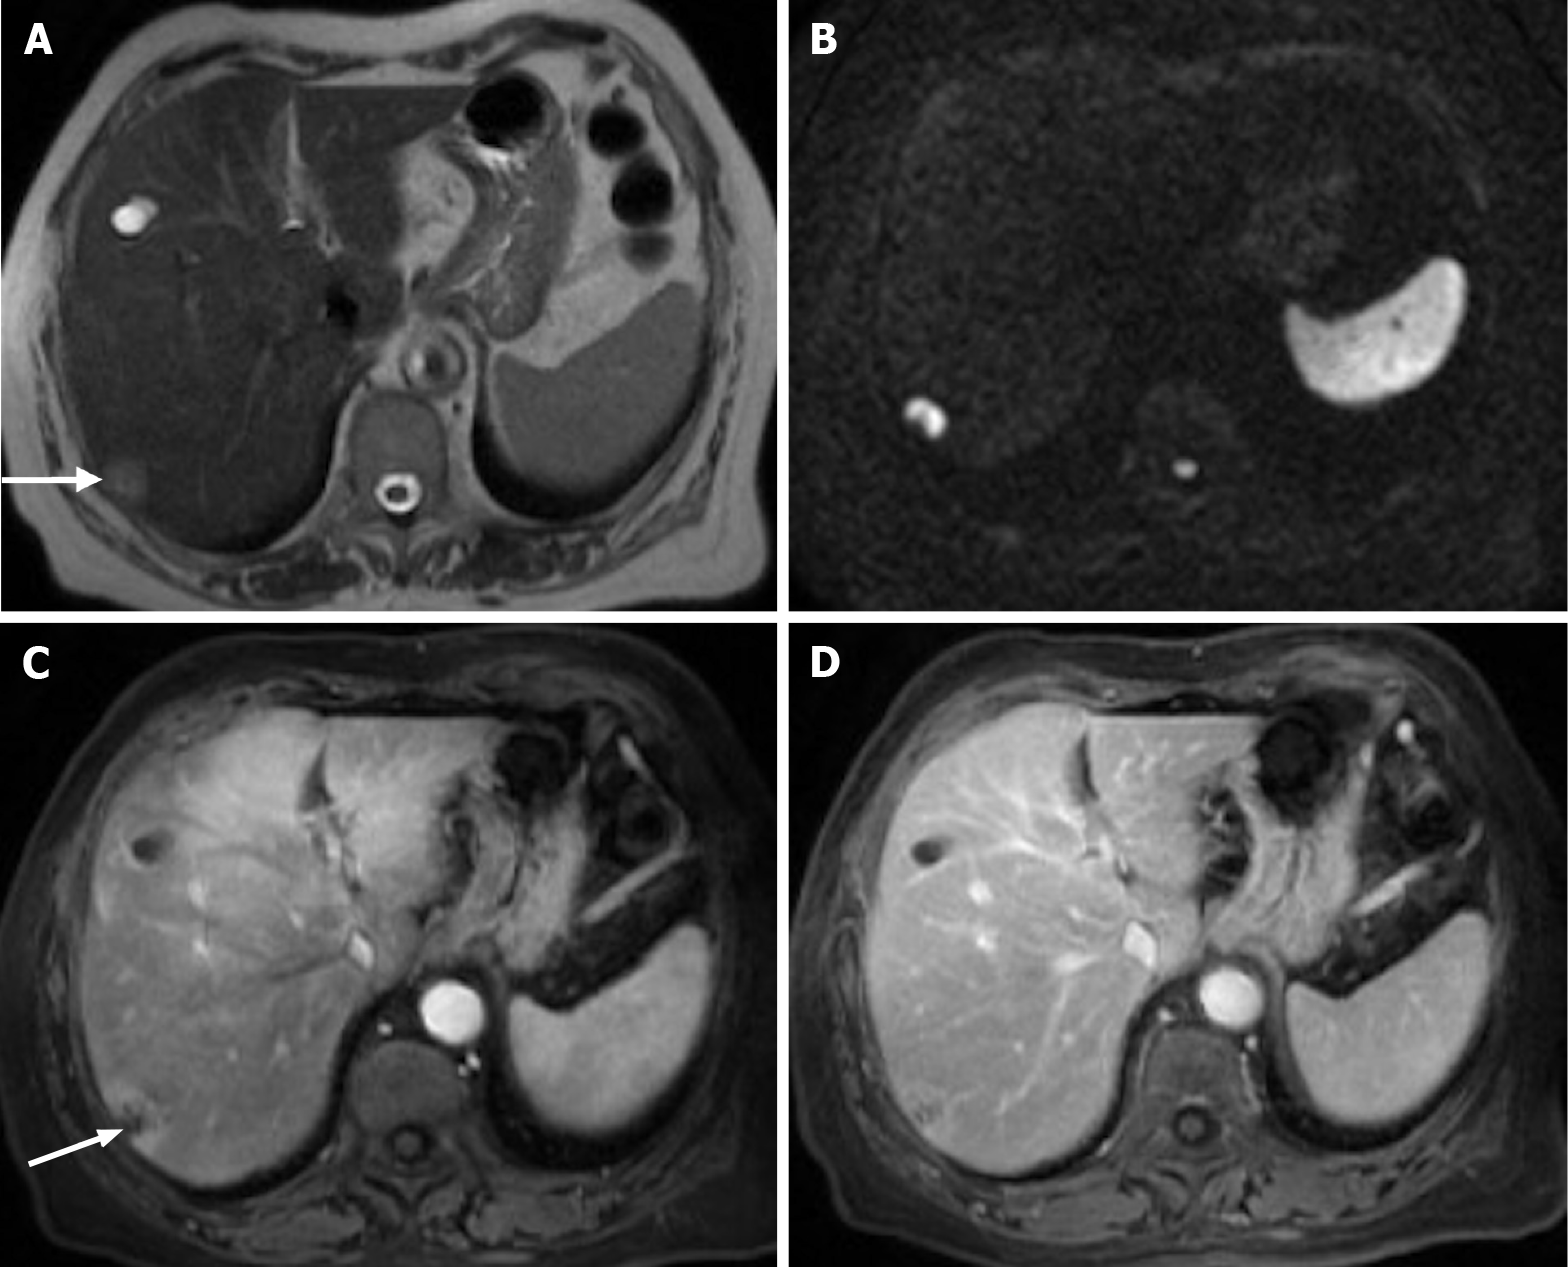
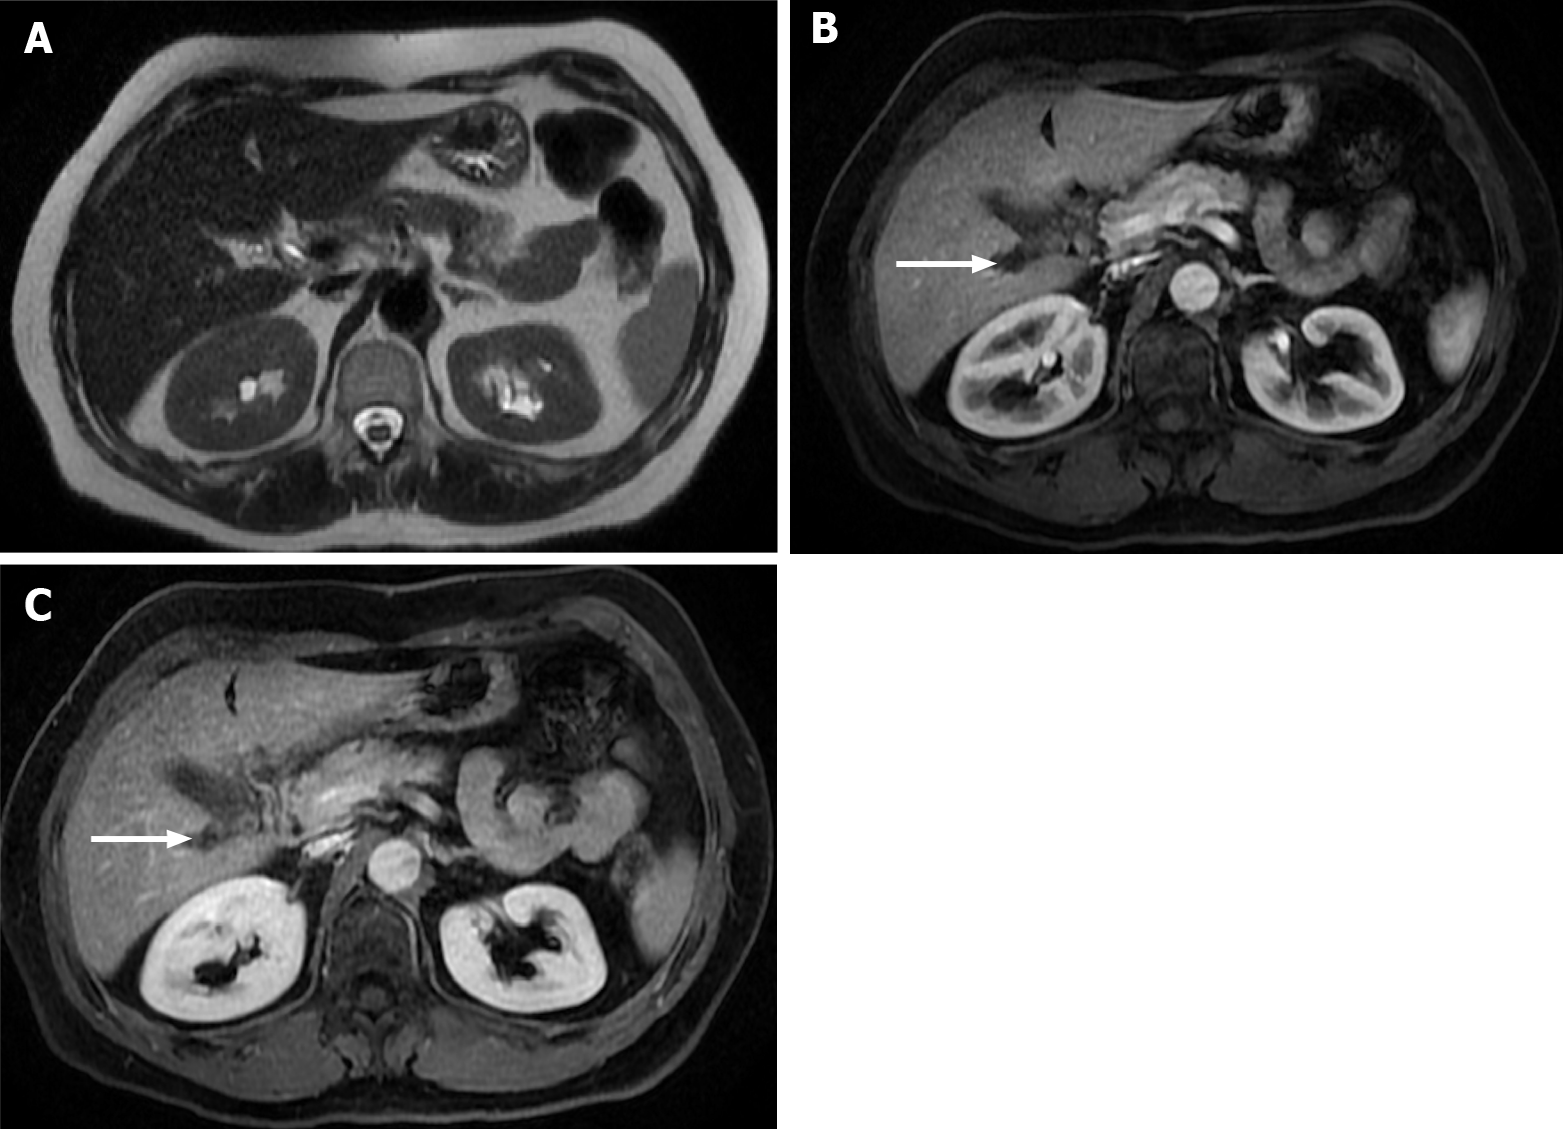
Figure 8 Pancreatic cancer liver metastasis is seen in the subcapsular region of segment VII.
A: Axial T2- weighted imaging (WI) shows the pancreatic liver metastasis as a mildly hyperintense lesion (arrow); B: Note the very high signal intensity on high b value diffusion-weighted imaging; C: Axial fat saturated (FS) contrast-enhanced magnetic resonance imaging (CE-MRI) T1-WI in the arterial phase. Despite being hypovascular, it is common to find perilesional hyperenhancement in pancreatic cancer subcapsular metastases (arrow); D: Axial FS CE-MRI T1-WI interstitial phase - progressive central enhancement is appreciated in the interstitial phase.
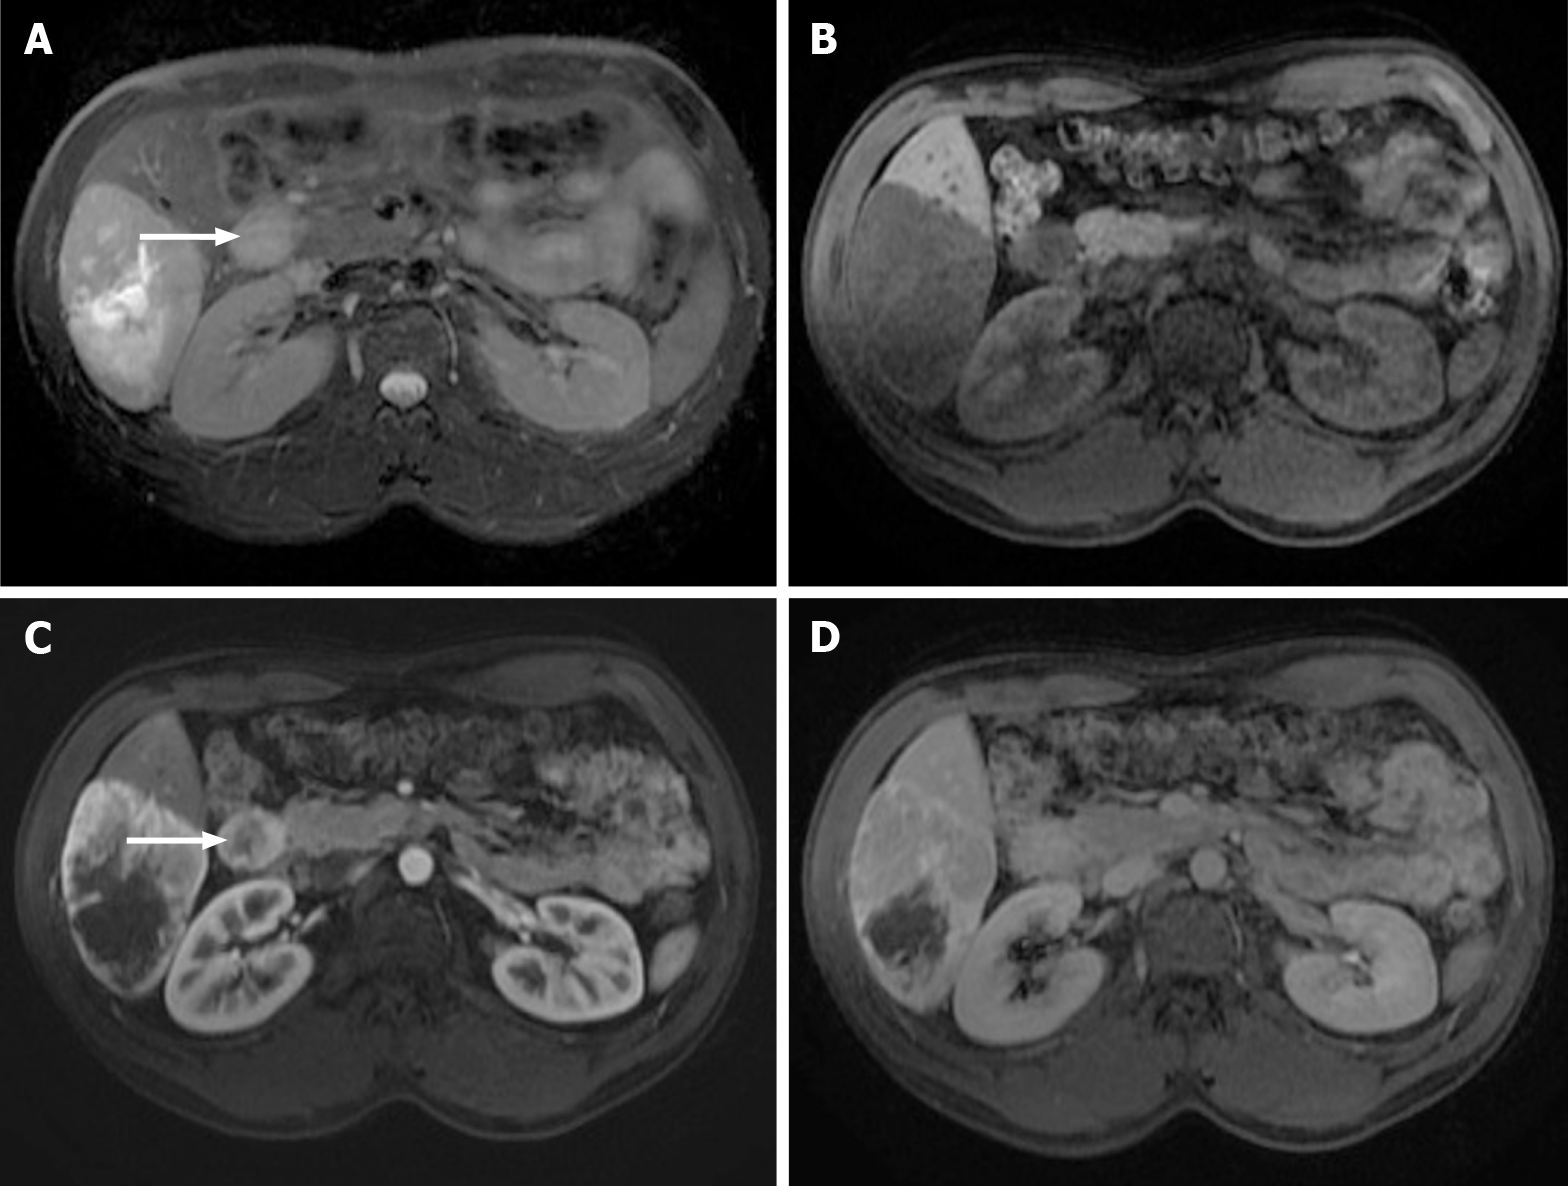
Figure 9 Images show a large liver metastasis from a duodenal neuroendocrine tumor.
A: In the axial fat saturated (FS) T2-weighted imaging (WI), the liver metastasis is characterized by hyperintense central necrosis delimited by a lesser intense viable tumor. Note the duodenal neuroendocrine tumor (arrow); B: Axial FS non-contrast-enhanced magnetic resonance imaging (CE-MRI) T1-WI shows large hypointense liver metastasis; C: Axial FS CE-MRI T1-WI in the arterial phase demonstrates viable tumor with avid heterogeneous enhancement. The primary lesion is also hypervascular and depicted in the 2nd portion of the duodenum (arrow); D: Axial FS CE-MRI T1-WI in the interstitial phase reveals fading of the lesion.
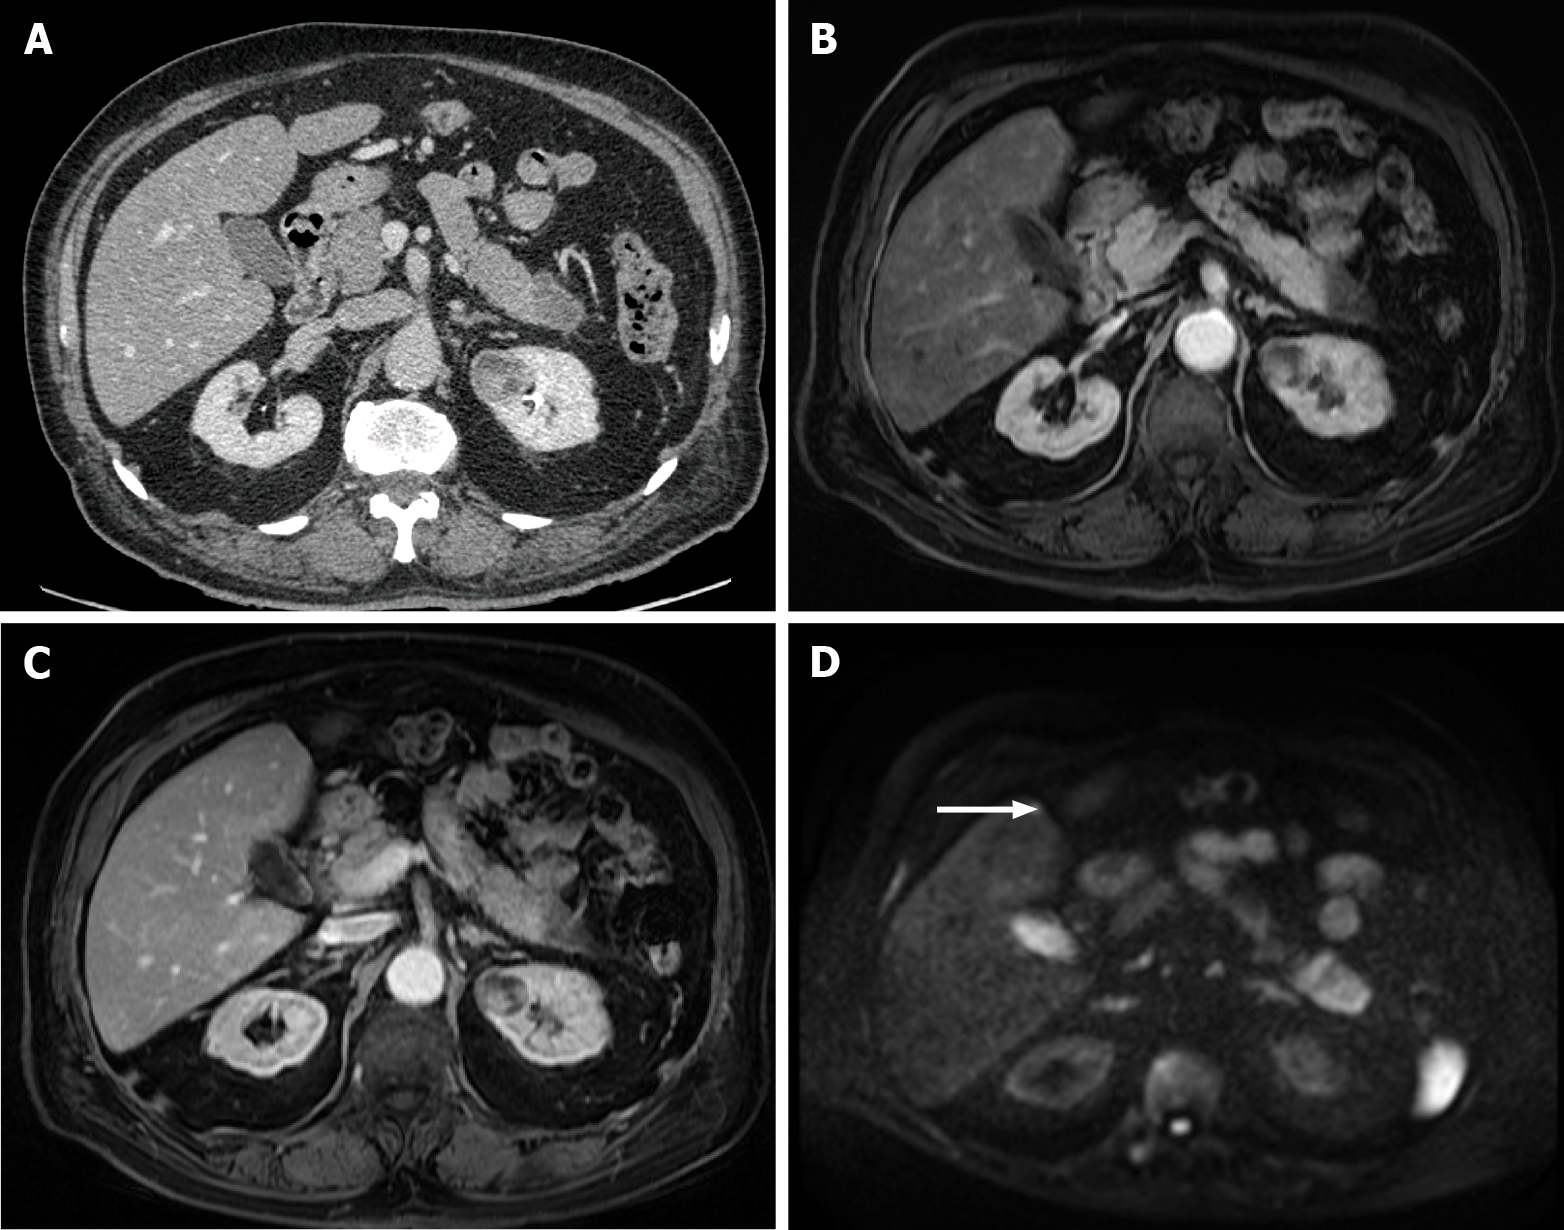
Figure 10 A 40-year-old woman with breast cancer showing a subcapsular millimetric iso-vascular metastasis only depicted in the diffusion-weighted imaging.
Contrast-enhanced computed tomography (CE-CT) and dynamic magnetic resonance imaging (MRI) sequences could not detect the lesion. A: Axial CE-CT in the portal-venous phase; B: Axial fat saturated (FS) CE-MRI T1-weighted imaging (WI) in the arterial phase; C: Axial FS CE-MRI T1-WI in the portal-venous phase; D: Diffusion-weighted imaging showing a small lesion with high signal intensity on high b value corresponding to liver metastasis (arrow).
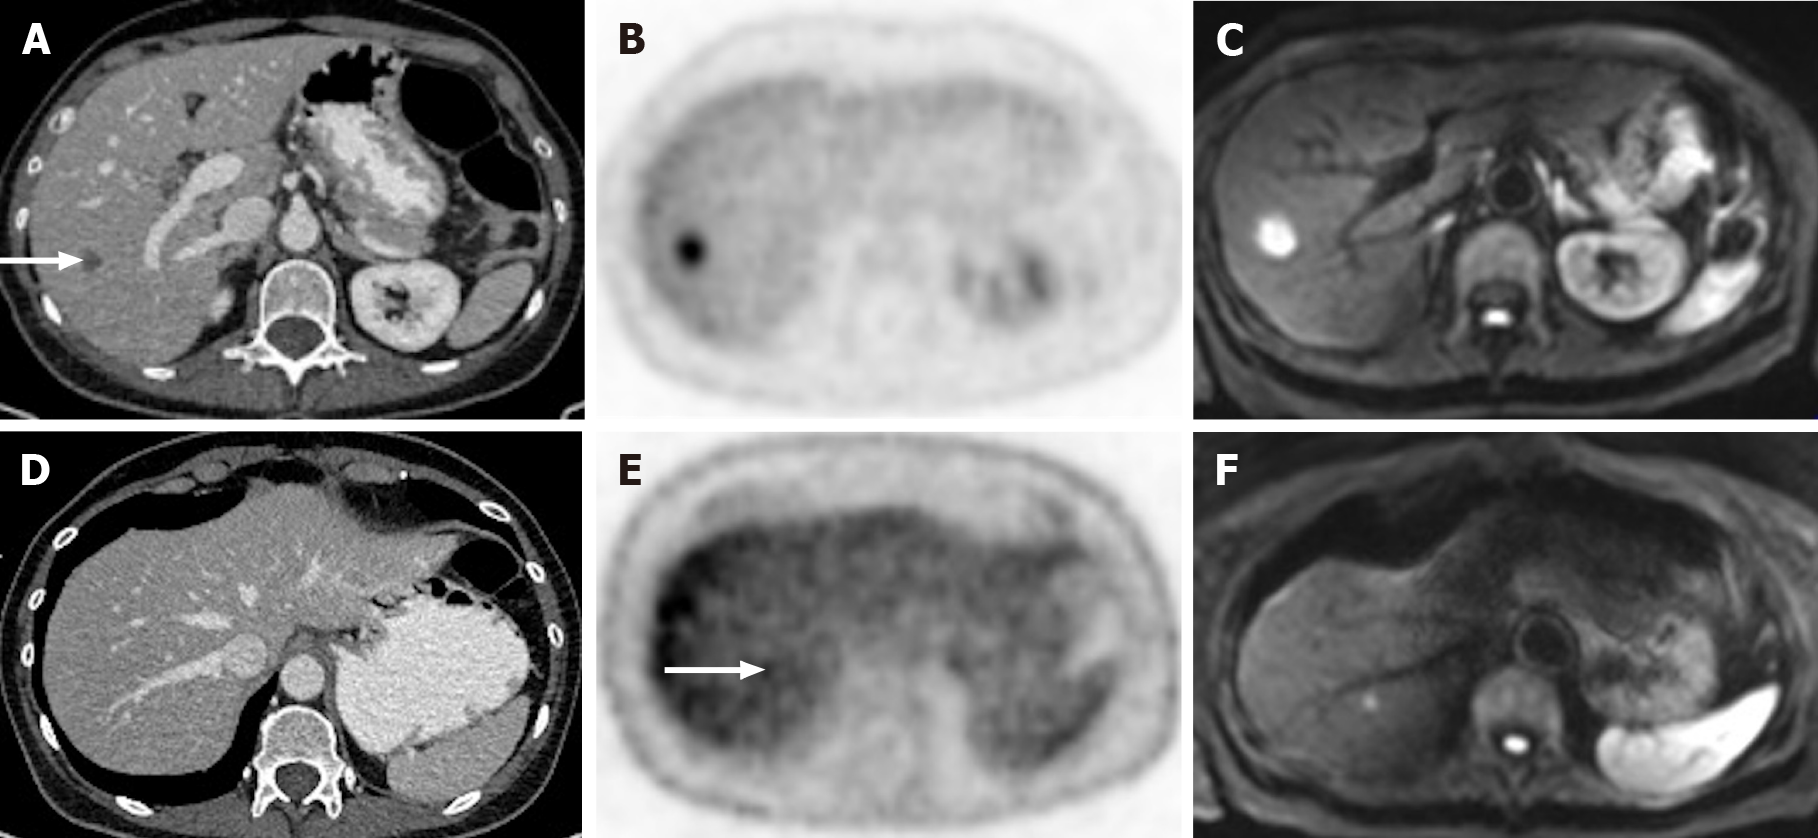
Figure 11 A 65-year-old woman with colorectal carcinoma shows liver metastasis in segment VII.
A: Axial contrast-enhanced computed tomography (CE-CT) reveals a hypodense lesion corresponding to liver metastasis (arrow); B: Fluorodeoxyglucose (FDG) positron emission tomography (PET)-CT confirms metastatic origin; D: Axial CE-CT shows no apparent lesion; E: FDG PET-CT shows an additional barely visible nodule not seen in CT (arrow); C and F: Diffusion-weighted imaging confirmed that both lesions were secondary.
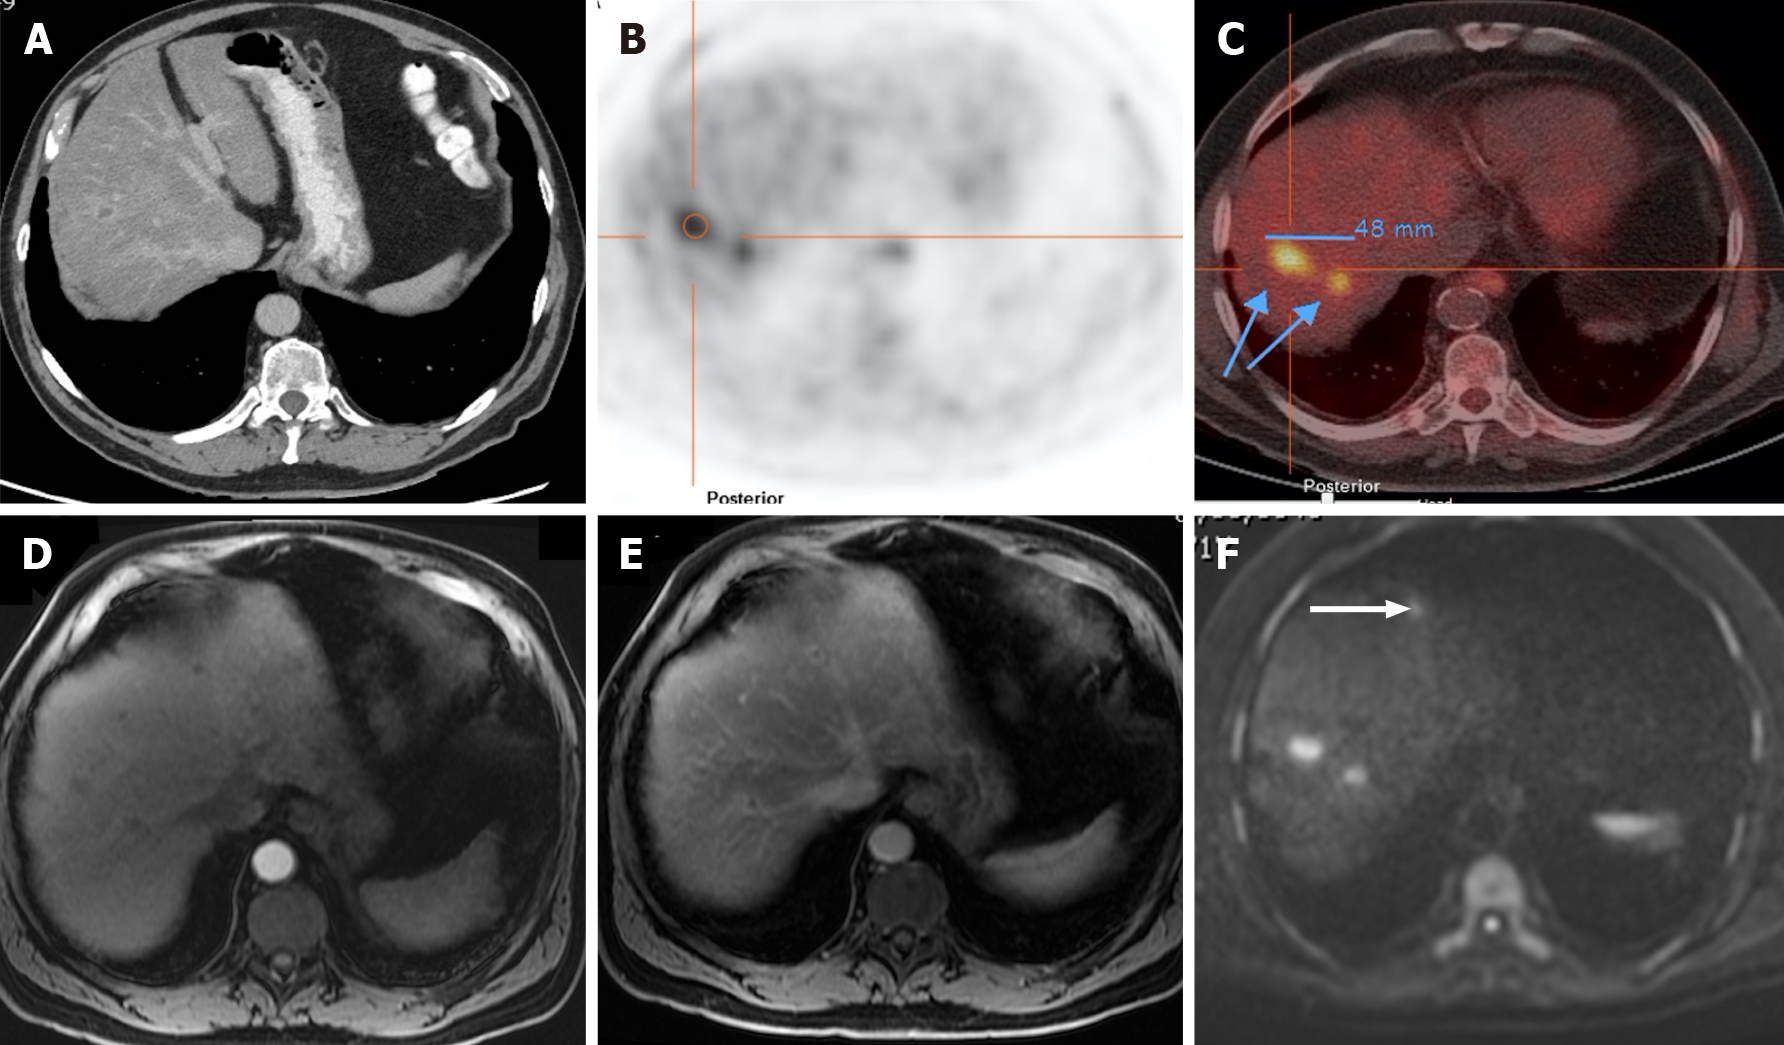
Figure 12 A 71-year-old man with colorectal carcinoma presenting with liver metastases.
A: Axial contrast-enhanced computed tomography (CE-CT) in the portal-venous phase shows barely identified non-specific liver micronodules; B and C: Fluorodeoxyglucose positron emission tomography (PET)-CT shows two hypermetabolic lesions in the right lobe, consistent with viable neoplastic tissue; D: Axial fat saturated (FS) CE- magnetic resonance imaging (MRI) T1-weighted imaging (WI) in the arterial phase shows hypovascular liver lesions; E: Axial FS CE-MRI T1-WI in the venous phase confirms the liver metastases, showing hypointense nodules with venous ring enhancement; F: In the diffusion-weighted imaging study, these lesions are more conspicuous. Also, an additional metastasis (arrow) that was not detected either by CE-CT, CE-MRI, or PET-CT is shown.
Figure 13 A 71-year-old man with unresectable CRLM.
A and C: Axial fat saturated (FS) contrast-enhanced magnetic resonance imaging (CE-MRI) T1-weighted imaging (WI) in the arterial phase; B and D: Axial FS CE-MRI T1-WI in the portal-venous phase. Initial presentation of three heterogeneous hepatic lesions corresponding to unresectable CRLM before treatment (A and B). After chemotherapy (C and D), the patient presented partial response, with the disappearance of two lesions and reduced size of the larger lesion, which still presents viable peripheral tumor.
Figure 14 Follow-up of a 66-years-old woman with previous breast cancer liver metastases submitted to chemotherapy showing complete response in 2015.
A: Axial T2-weighted imaging (WI) shows the liver metastasis characterized by an isointense lesion; B and C: Axial fat sat contrast-enhanced magnetic resonance imaging T1-WI in the arterial (B) and interstitial (C) phases present the liver metastasis without noticeable enhancement in the post-contrast dynamic study (arrow, B and C), which is consistent with treated metastasis (no viable tumor). To date, after 6 years, the patient is free of recurrent disease.
- Citation: Freitas PS, Janicas C, Veiga J, Matos AP, Herédia V, Ramalho M. Imaging evaluation of the liver in oncology patients: A comparison of techniques. World J Hepatol 2021; 13(12): 1936-1955
- URL: https://www.wjgnet.com/1948-5182/full/v13/i12/1936.htm
- DOI: https://dx.doi.org/10.4254/wjh.v13.i12.1936


