Copyright
©The Author(s) 2021.
World J Hepatol. Dec 27, 2021; 13(12): 1892-1908
Published online Dec 27, 2021. doi: 10.4254/wjh.v13.i12.1892
Published online Dec 27, 2021. doi: 10.4254/wjh.v13.i12.1892
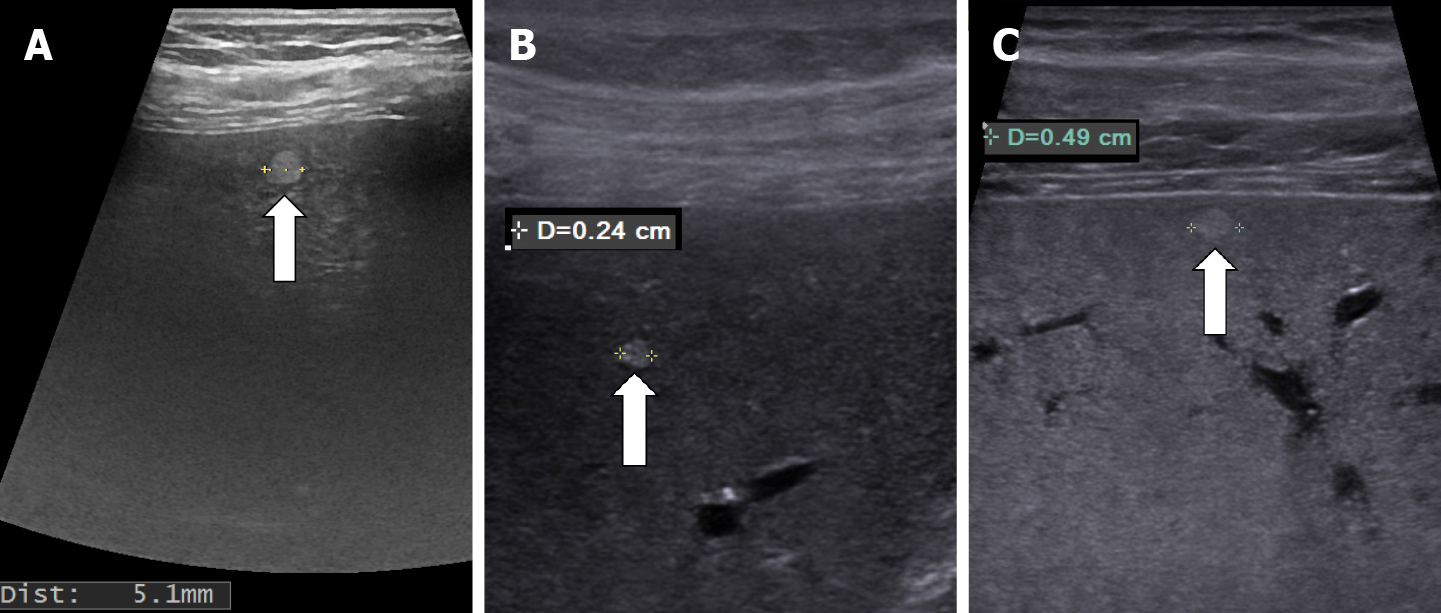
Figure 1 Very small (less than 5 mm), hyperechoic, well delimited hemangiomas showed by linear probe exam (arrows).
A: Subcapsular hepatic hemangioma; B and C: Intraparenchymal hepatic hemangioma.
Figure 2 Typical hepatic hemangioma.
Ultrasonography shows the hemangioma as a hyperechoic mass with sharp margins. A and B: Small hepatic hemangioma; C: Large hepatic hemangioma.
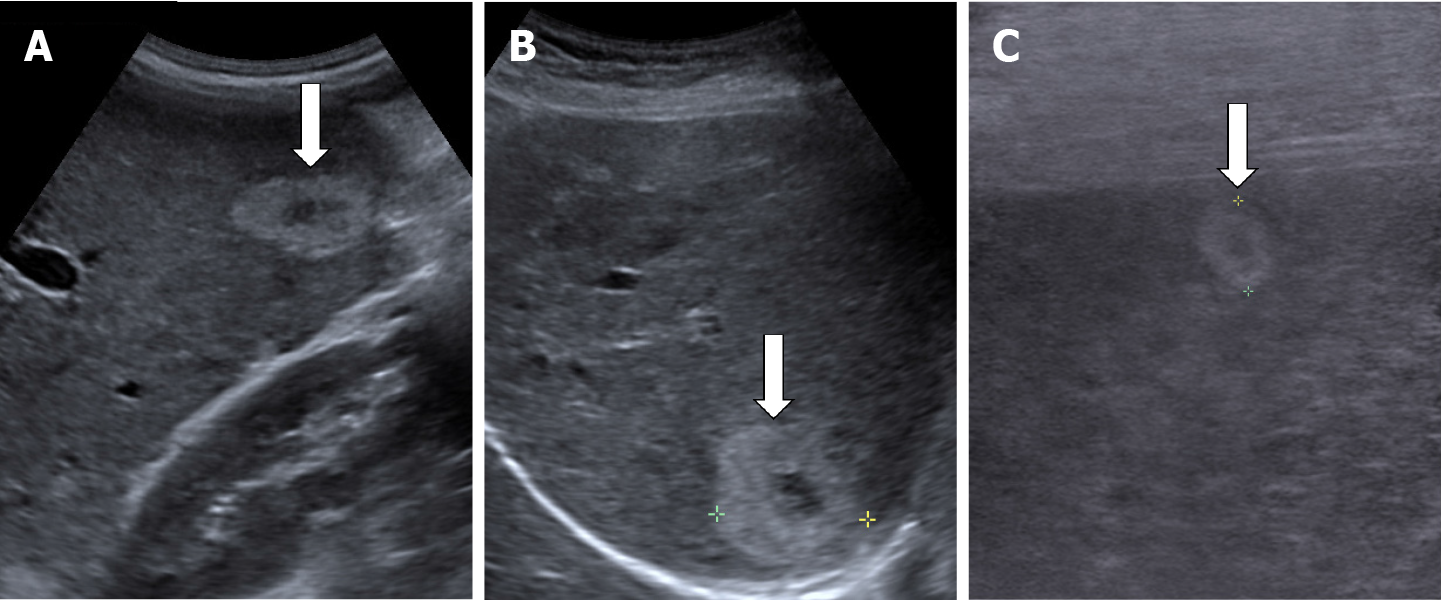
Figure 3 Examples of hyperechoic hepatic hemangioma with hypoechoic central area.
A and B: Convex probe; C: Linear probe.
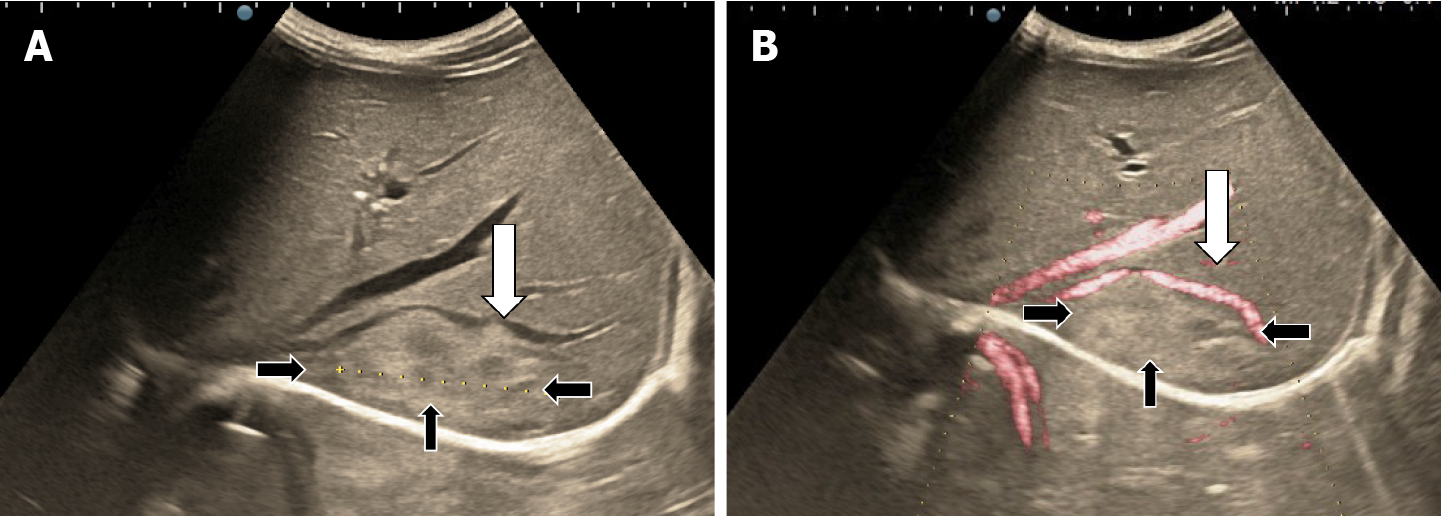
Figure 4 Subdiaphragmatic hepatic hemangioma (white arrows) that pushes the right hepatic vein (black arrows) without its invasion or thrombosis.
A: B-mode ultrasound; B: Doppler ultrasound mode.
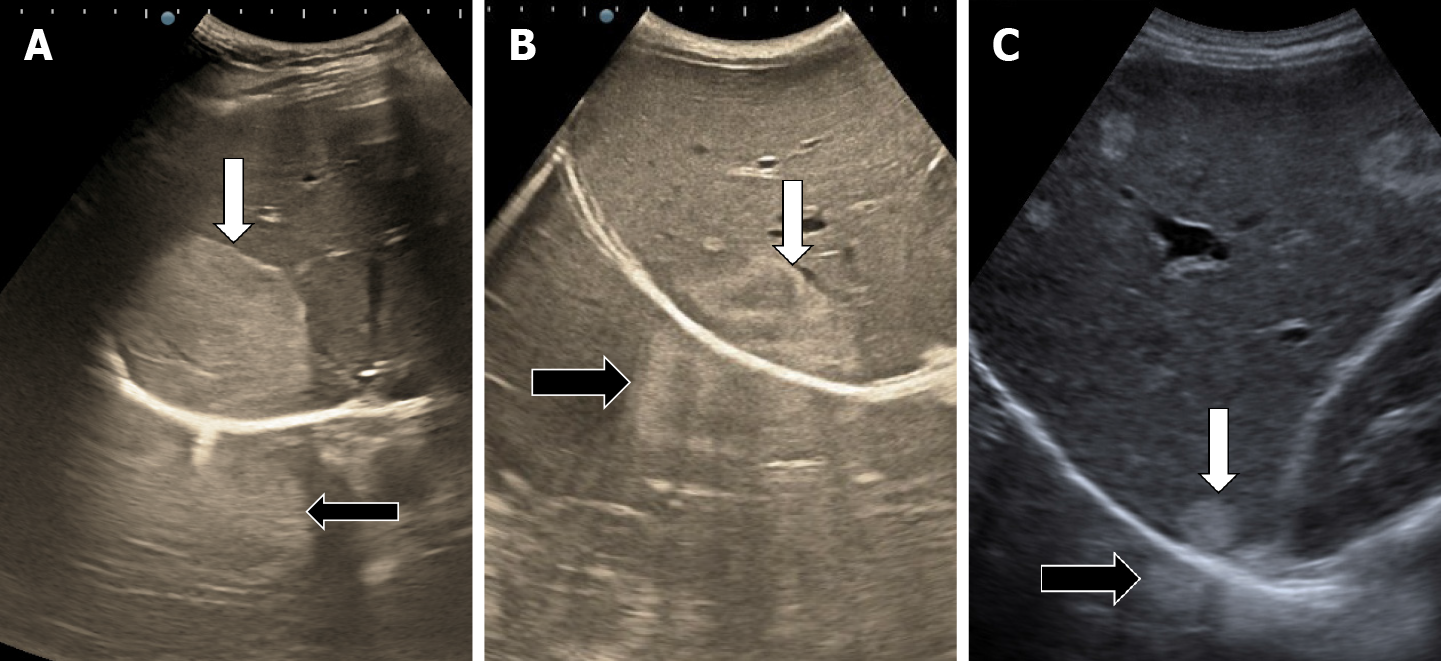
Figure 5 Examples of hepatic hemangioma located subdiaphragmatically (white arrows) with the artefact "in the mirror" (black arrows).
A: Large, hyperechoic hepatic hemangioma; B: Inhomogeneous lesion; C: Small hepatic hemangioma.
Figure 6 Illustration of hepatic hemangioma with inhomogeneous echogenicity.
A-C: Hepatic hemangioma with intratumorally changes, such as fibrosis (A) or thrombosis (B and C).
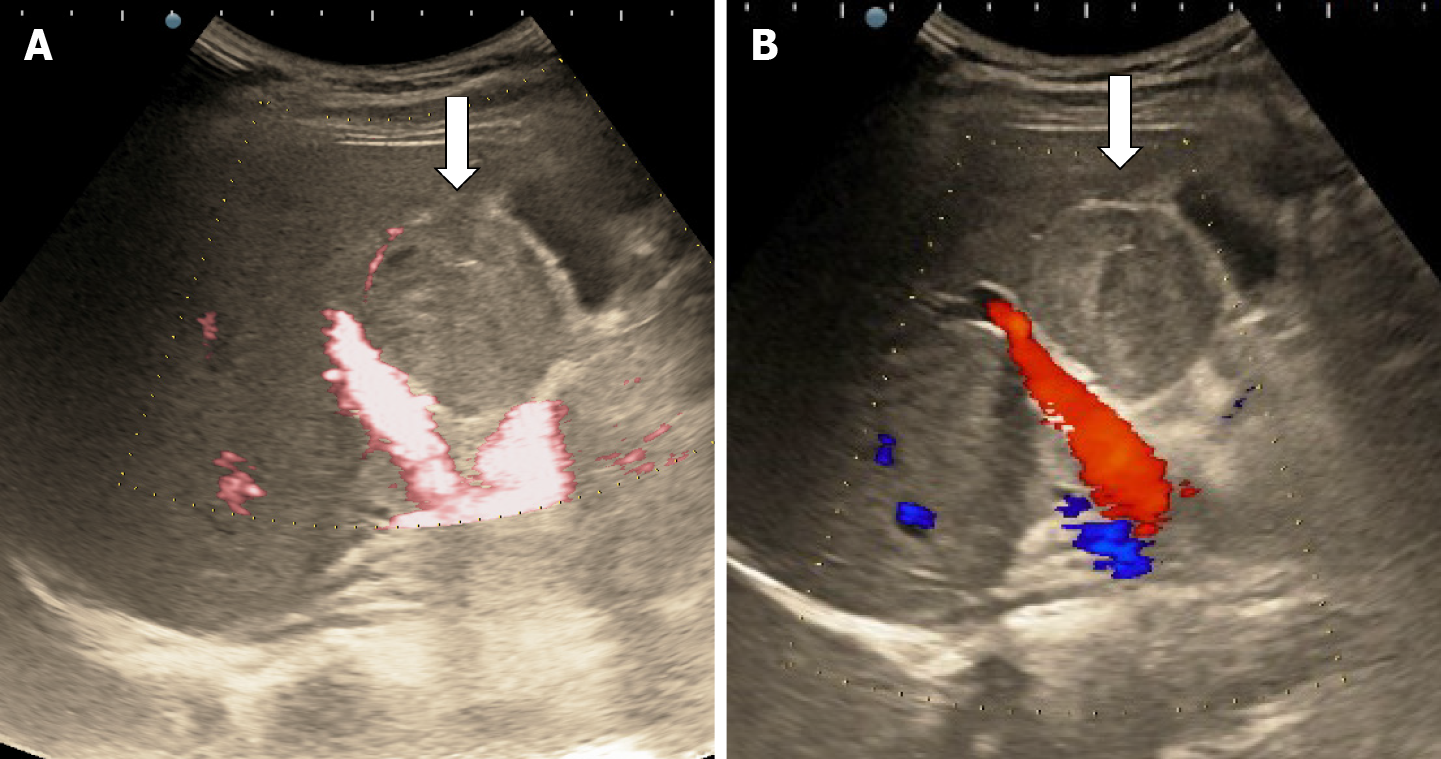
Figure 7 Doppler mode ultrasound for hepatic hemangioma.
A and B: No intralesional vessels are seen at power (A) or color Doppler (B) exam due very slow intralesional flows.
Figure 8 Typical hepatic hemangioma in B-mode ultrasound.
A: Hyperechoic mass with sharp margins; B-D: After contrast agent administration the mass shows peripheral nodular enhancement in arterial phase (B and C) with partial centripetal filling in the late phase (D).
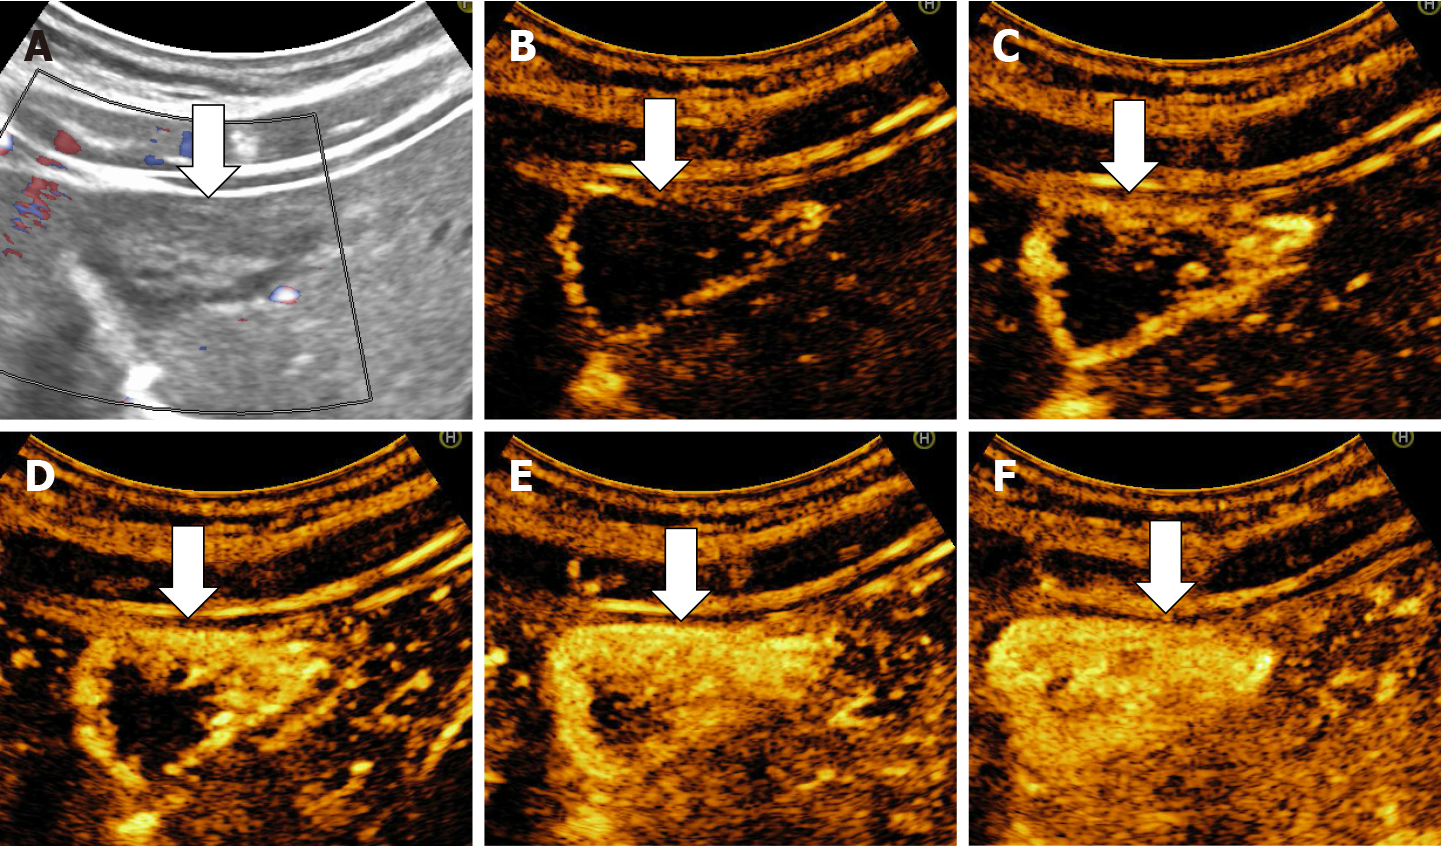
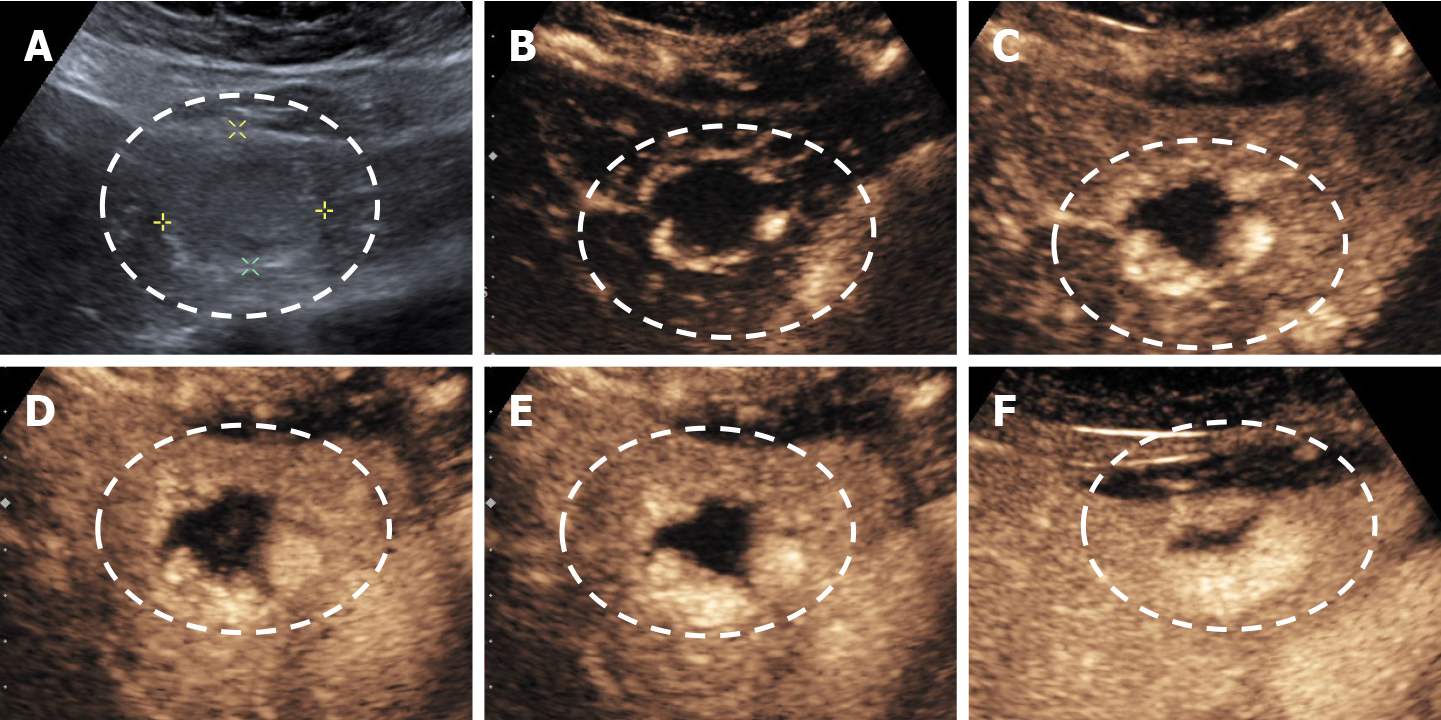
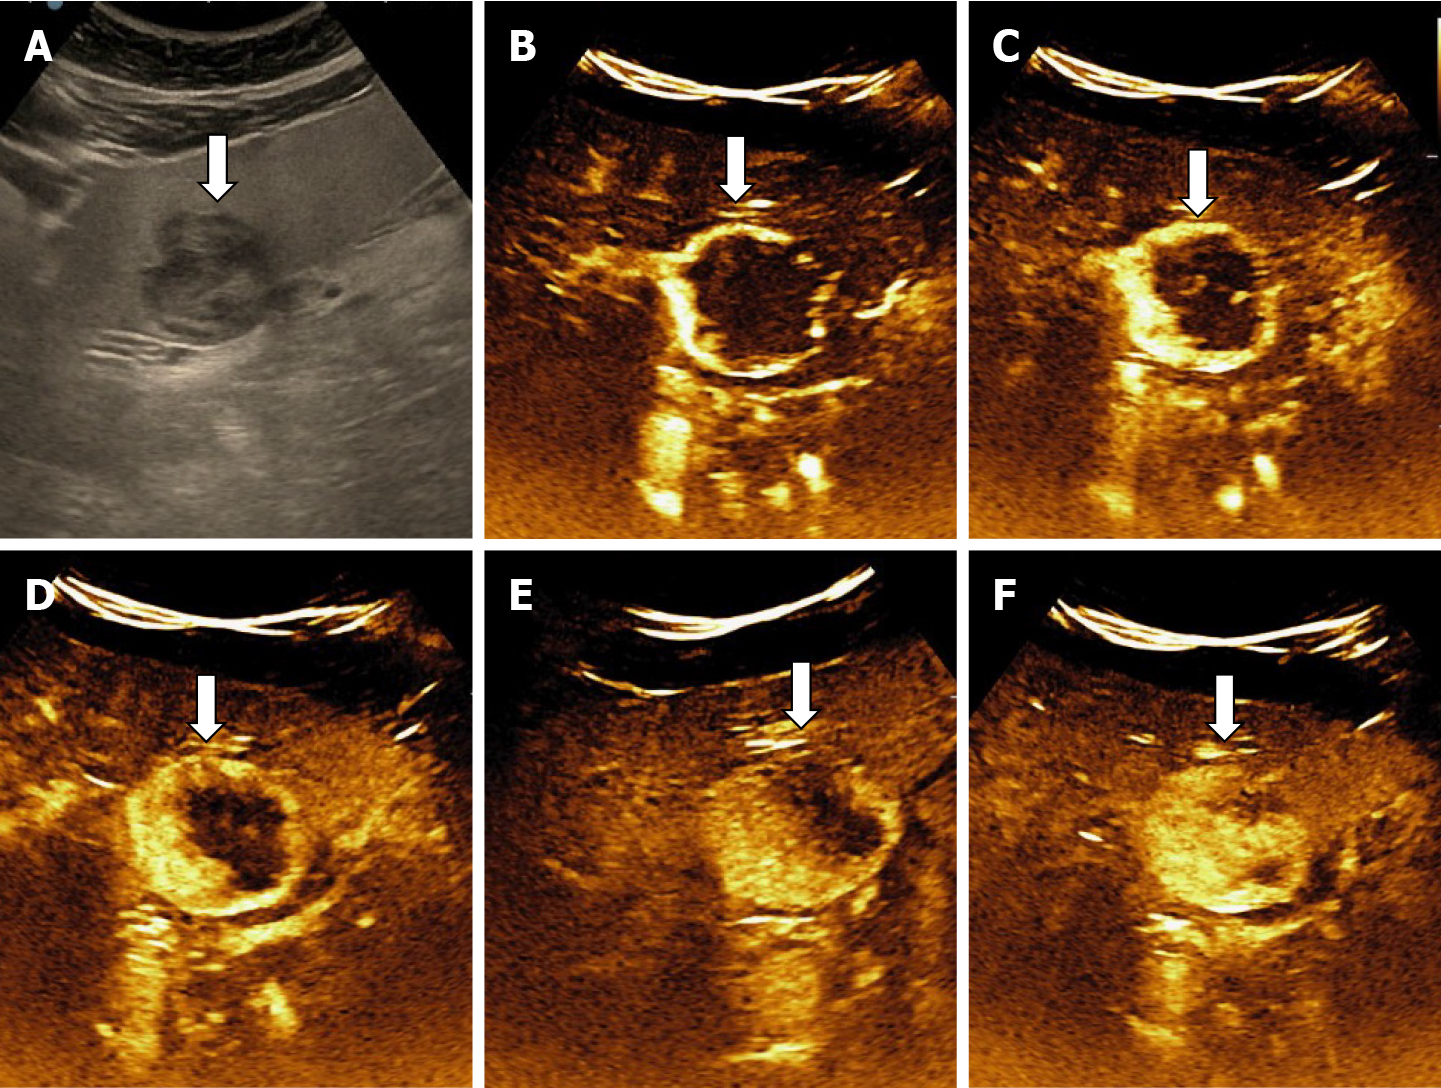
Figure 9 Example of hepatic hemangioma with inhomogeneous echogenicity.
A: Gray scale ultrasound; B-E: On contrast enhanced ultrasound the hemangioma shows the typical peripheral nodular contrast enhancement (B and C) and centripetal fill-in (D and E); F: The mass shows strong homogenous enhancement in the late phase.
Figure 10 Ultrasound images using linear probe in a case of small, hyperechoic, subcapsular hepatic hemangioma.
A: Gray scale ultrasound; B-E: A typical enhancement is showed in contrast enhanced ultrasound. Peripheral pools in arterial phase (B and C) and centripetal progression (D) followed by complete fill-in (E); F: In the late phase phenomenon of pseudo-washout is observed due to hyperinsonation determined by the proximity of the linear probe.
Figure 11 Example of a flashfilling hemangioma.
A: On B-mode ultrasound a hypoechoic hemangioma is observed anterior of hepatic hilum; B and C: After injection of contrast agent, a rapid, uniform and intense homogeneous enhancement in the arterial phase (B) that persists into the late phases (C) is observed.
Figure 12 Illustration of hepatic hemangioma with echoic border.
A-C: Hepatic hemangioma localized in the right (A and B) and left (C) liver lobe respectively.
Figure 13 Example of hemangioma with echoic border.
A: B-mode ultrasound; B-F: Typical pattern of enhancement: Peripheral nodular enhancement in arterial phase (B and C) centripetal filling (D and E) and incomplete enhancement in late phase (F).
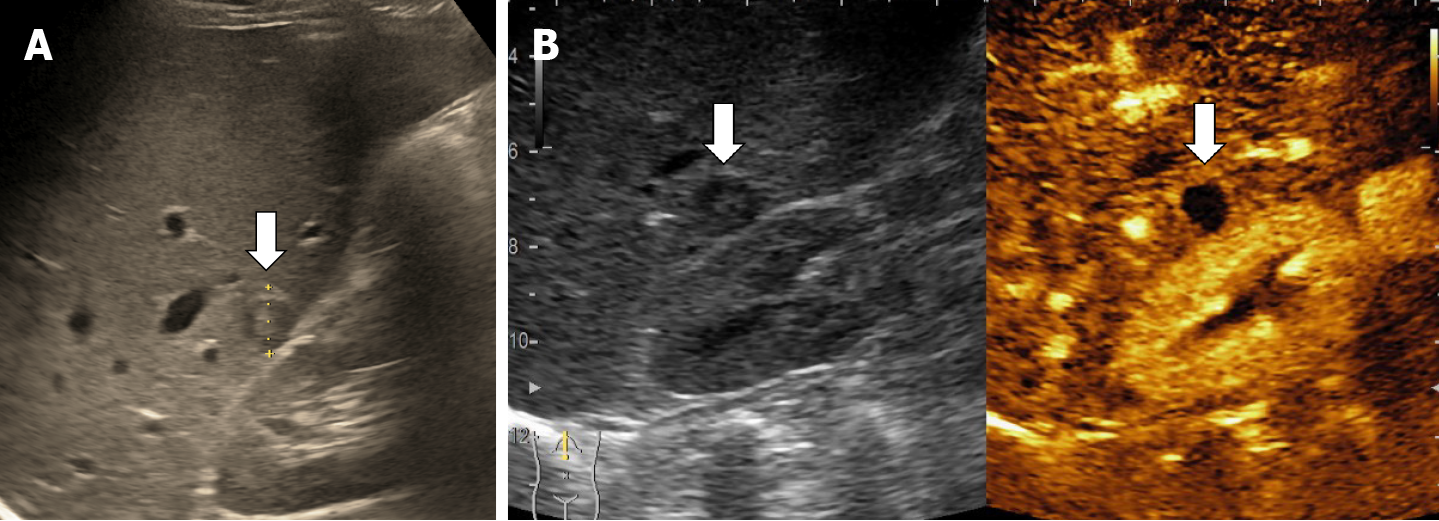
Figure 14 Sclerosed hemangioma in a 45-yr-old man detected on a routine ultrasound examination.
A: B-mode ultrasound revealed a small hypoechoic lesion; B: In contrast enhanced ultrasound no enhancement is observed.
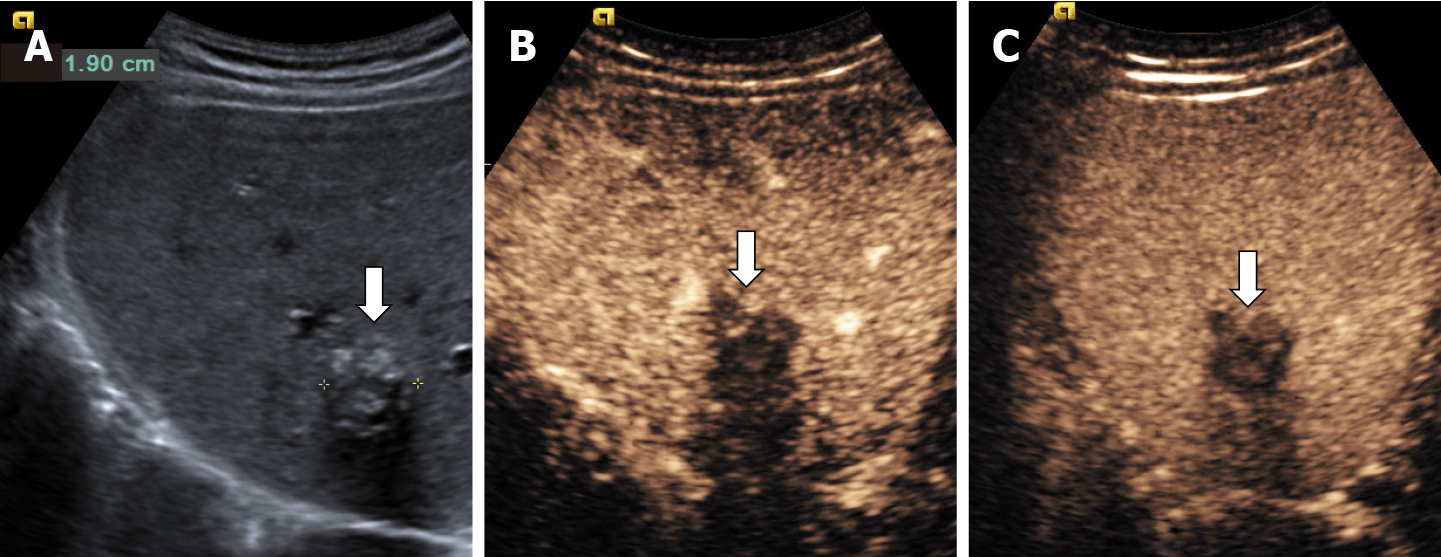
Figure 15 Hemangioma with calcifications in a 64-yr-old man detected on a routine ultrasound examination.
A: On B-mode ultrasound several spotted calcifications are showed in the marginal and central part of the lesion and posterior acoustic shadow also; B and C: On post-contrast administration no enhanced is noticed in the portal (B) or the late phase (C).
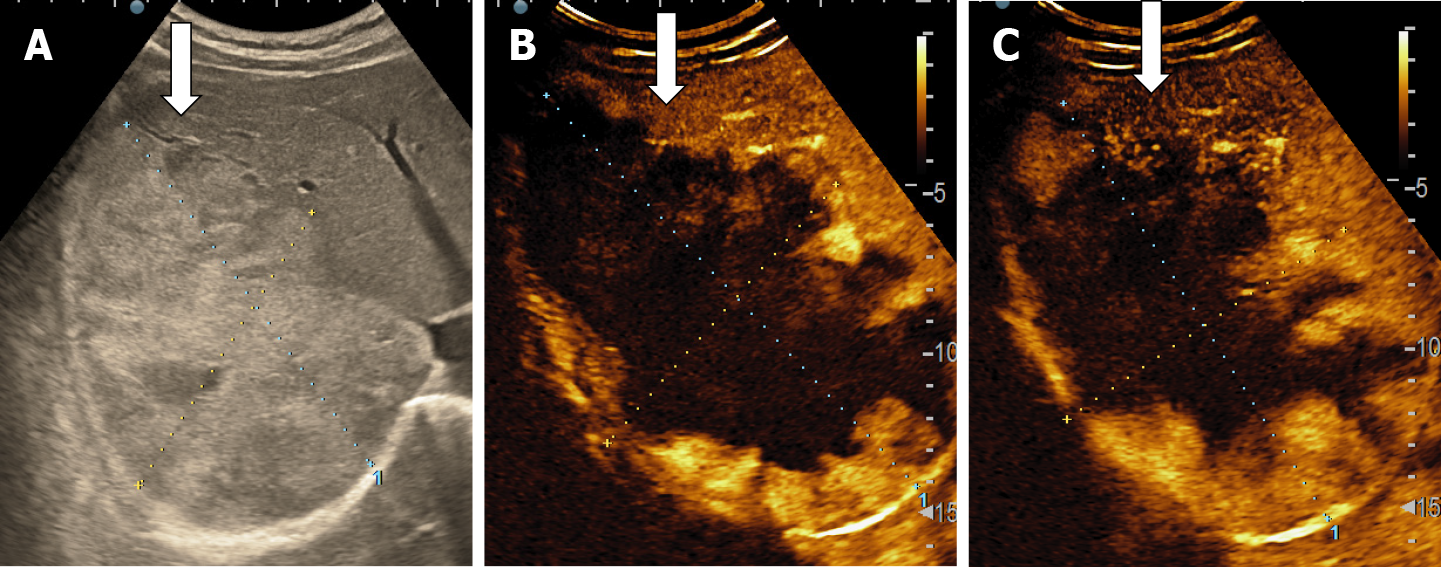
Figure 16 Oblique subcostal baseline image of the right liver lobe in a 45-yr-old woman.
A: An intense heterogeneous, large hemangiomas (about 17 cm); B and C: After intravenous administration of contrast agent, the typical early, peripheral, globular enhancement (B) is observed followed by progressive centripetal incomplete enhancement of the lesion (C).
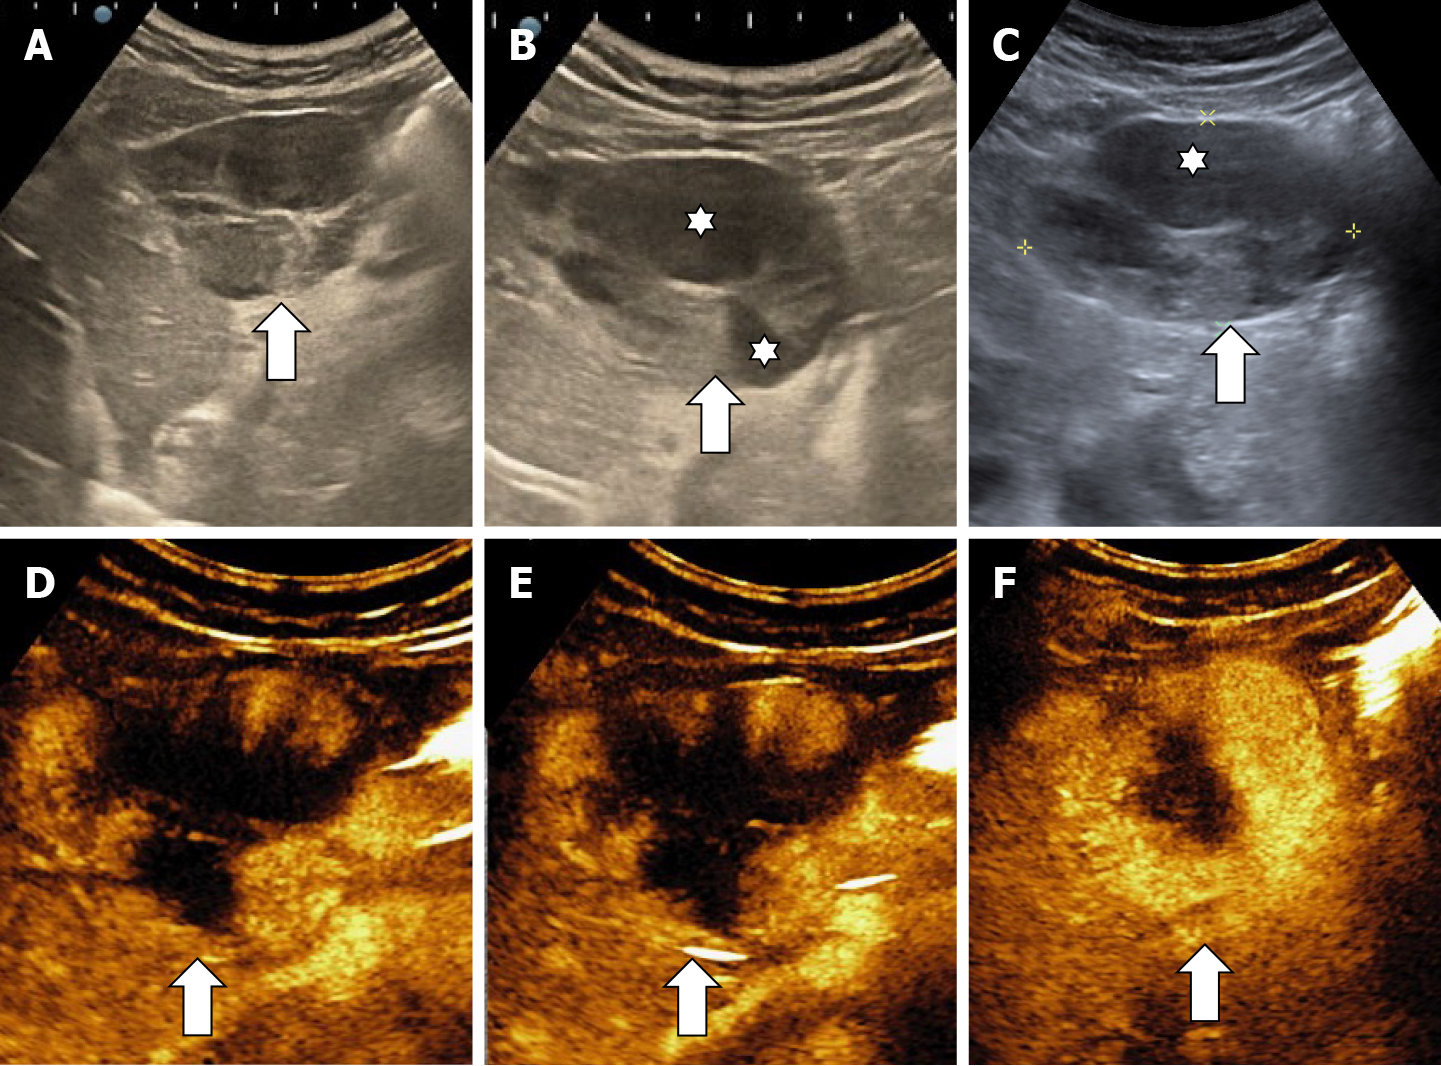
Figure 17 Multicystic hemangioma.
A-C: B mode ultrasound shows an inhomogeneous lesion (A) with central cavity (stars) (B) that contains fluid and septa (C); D-F: In contrast enhanced ultrasound the mass shows a progressive (D and E) but partial filling (F) because of the presence of fluid-like cystic cavities that do not enhance.
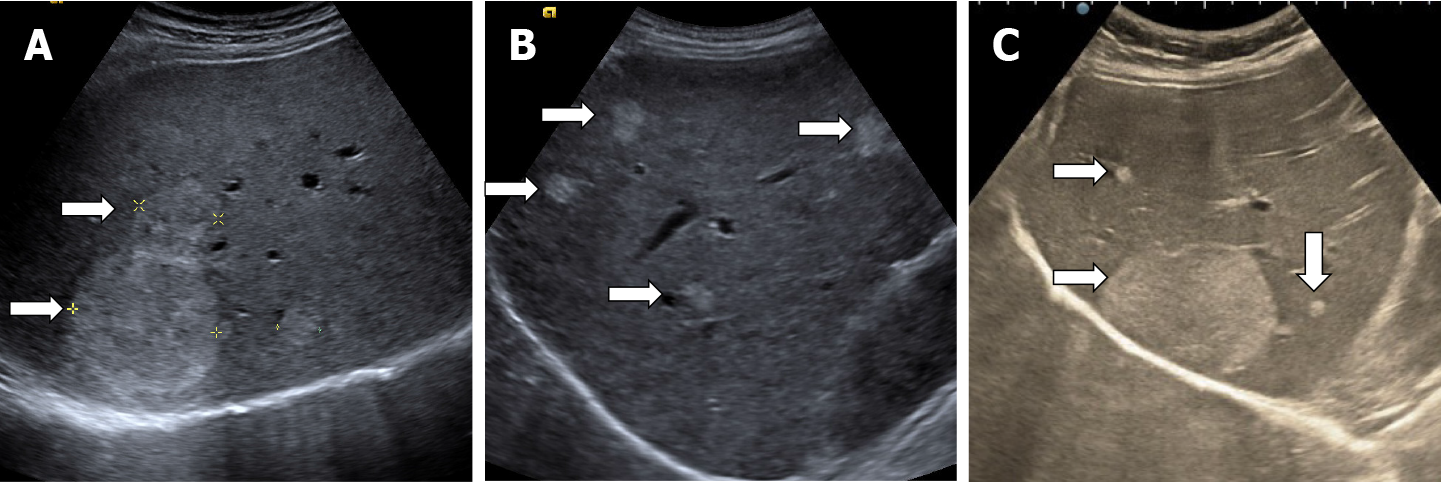
Figure 18 Illustration of multiple hepatic hemangioma in B mode ultrasound.
A: Two hyperechoic lesions; B: Four small well delimited lesions; C: One large hepatic hemangioma besides two small hyperechoic lesions.
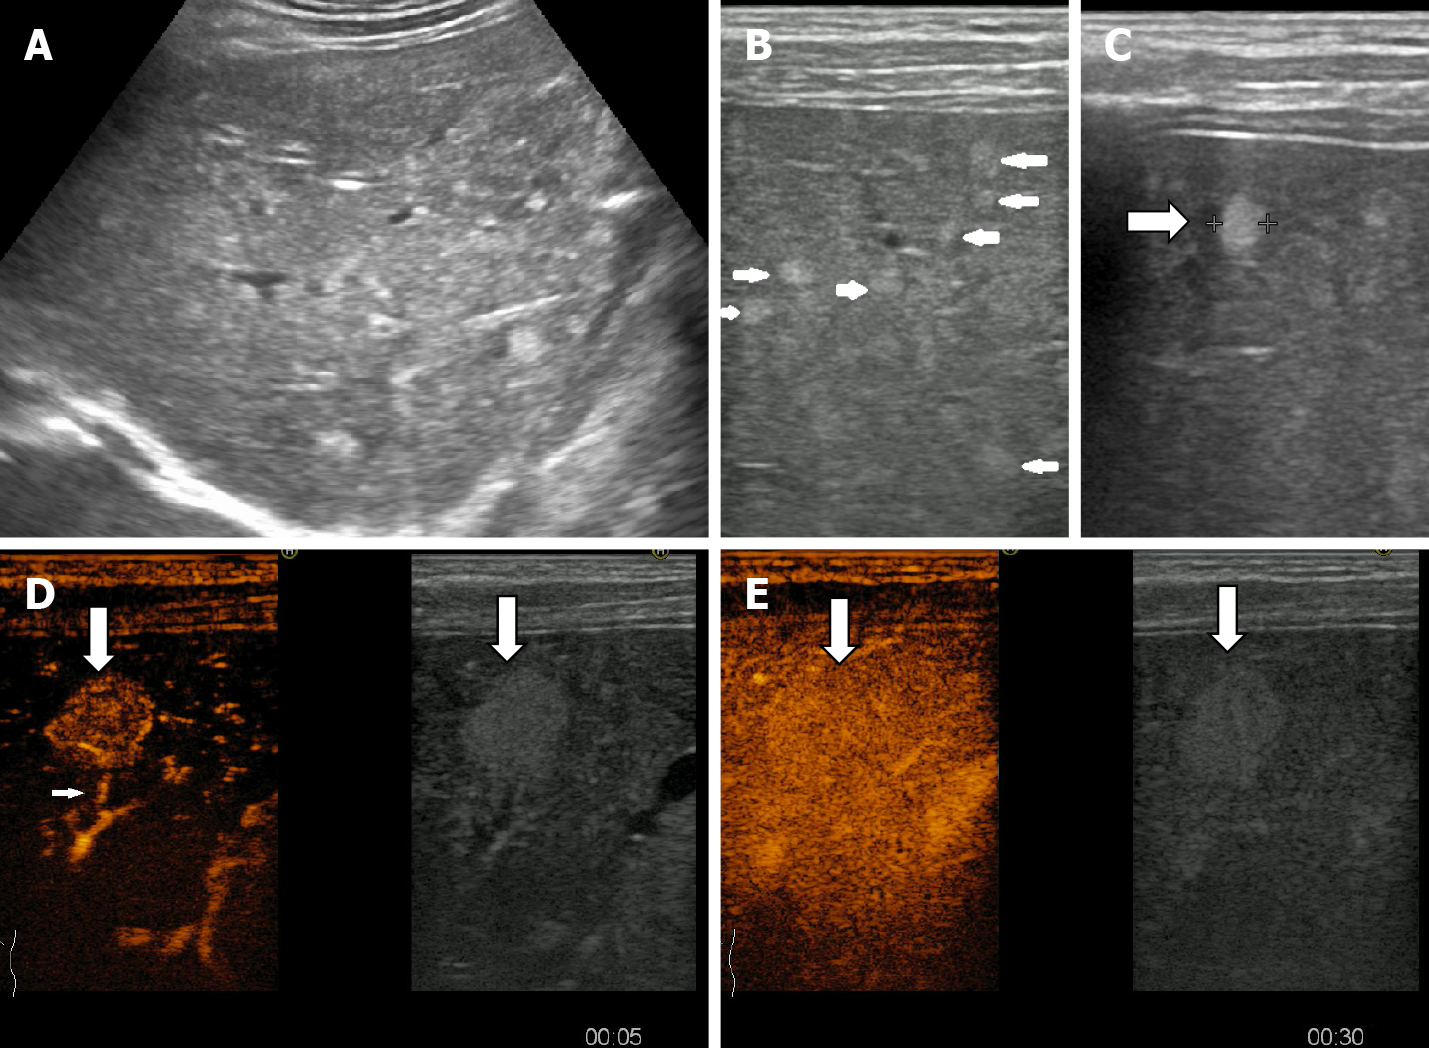
Figure 19 A multinodular pattern of hepatic hemangiomatosis on ultrasound.
A: Small hyperechoic lesions are scattered throughout the right liver lobe; B and C: Multiple subcapsular infracentimetric hemangiomas on ultrasound exam using linear probe; D and E: On contrast enhanced ultrasound examination fast-filling hemangioma displaying early homogenous enhancement and visible afferent artery in the artherial phase (D), homogenous enhancement with surrounding parenchyma on early portal phase (E).
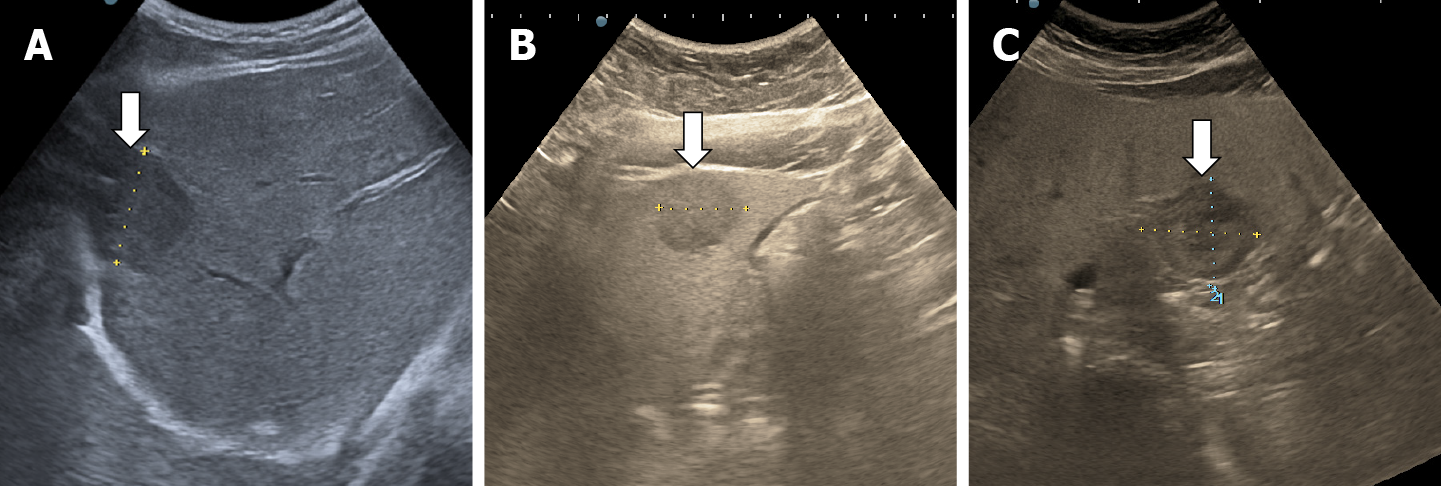
Figure 20 Examples of hypoechoic hemangioma relative to a hyperechoic, fatty liver.
A and B: B mode ultrasound show a hypoechoic lesion with a subdiaphragmatic (A) and subcapsular position (B); C: Case of hepatic hemangioma in fatty liver with an area surrounding the lesion appears hypoechoic and resembles a halo, an appearance termed a '' pseudohalo”.
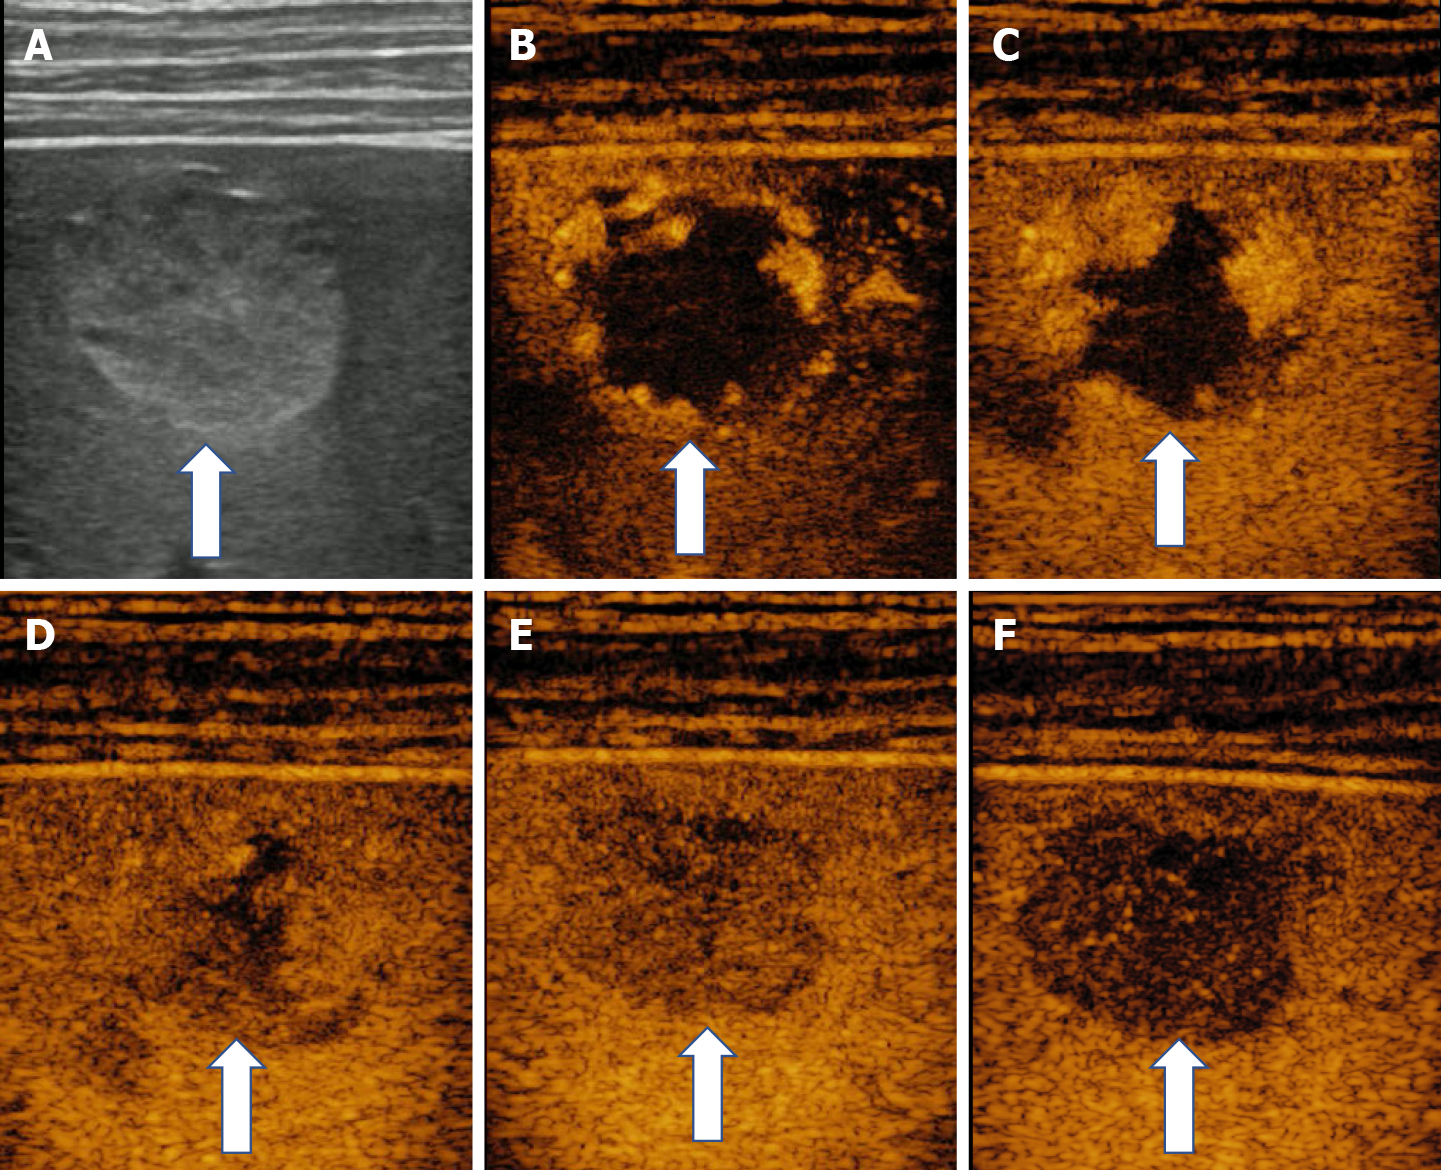
Figure 21 Hypoechoic hemangioma in 57-yr-old woman with liver steatosis.
A: B mode ultrasound image; B-F: After intravenous administration of contrast agent, the typical early, peripheral, globular enhancement (B and C) is observed followed by progressive, centripetal (D and E) incomplete (F) enhancement of the lesion.
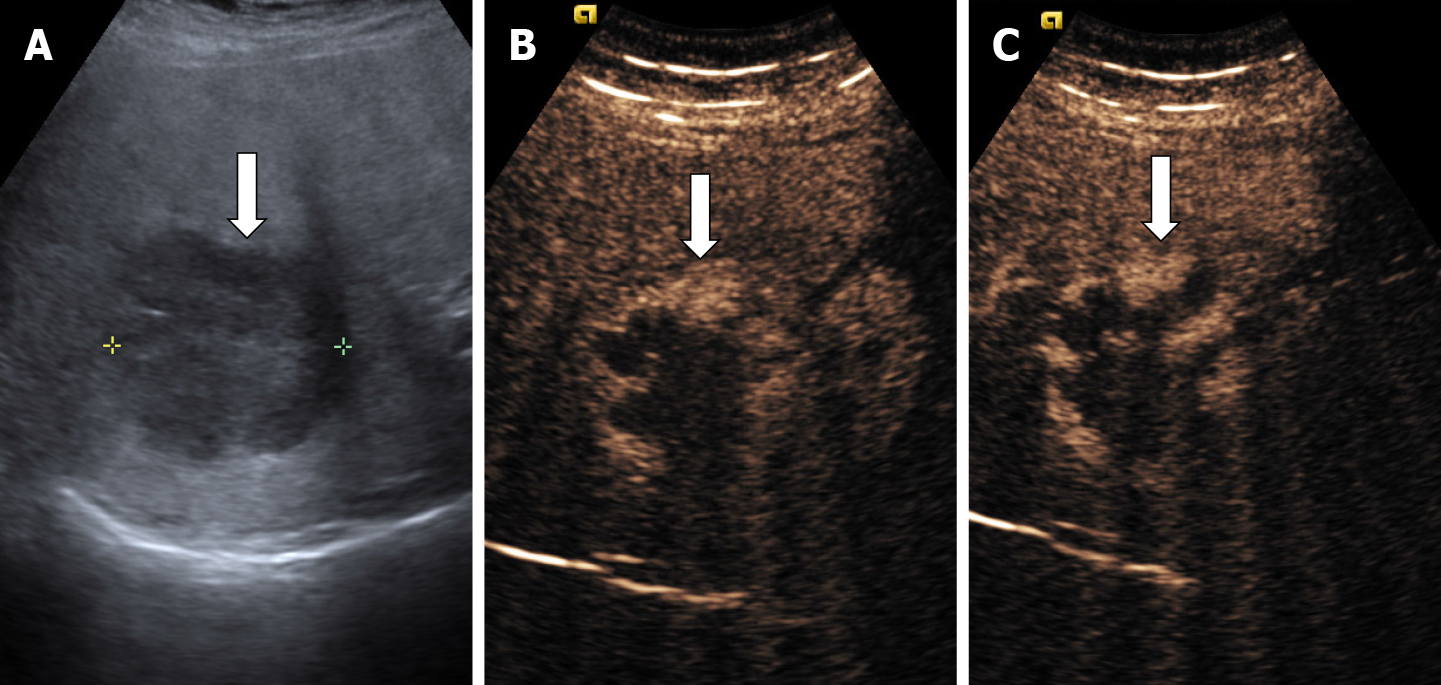
Figure 22 A case of cavernous hemangioma detected in a 64-yr-old man with liver cirrhosis.
A: On B mode ultrasound is observed a hyperechoic inhomogeneous liver and a hypoechoic large lesion in the right liver lobe; B: On contrast enhanced ultrasound, the liver lesion shows a typical early, peripheral, globular enhancement; C: In the late phase incomplete enhancement is noticed.
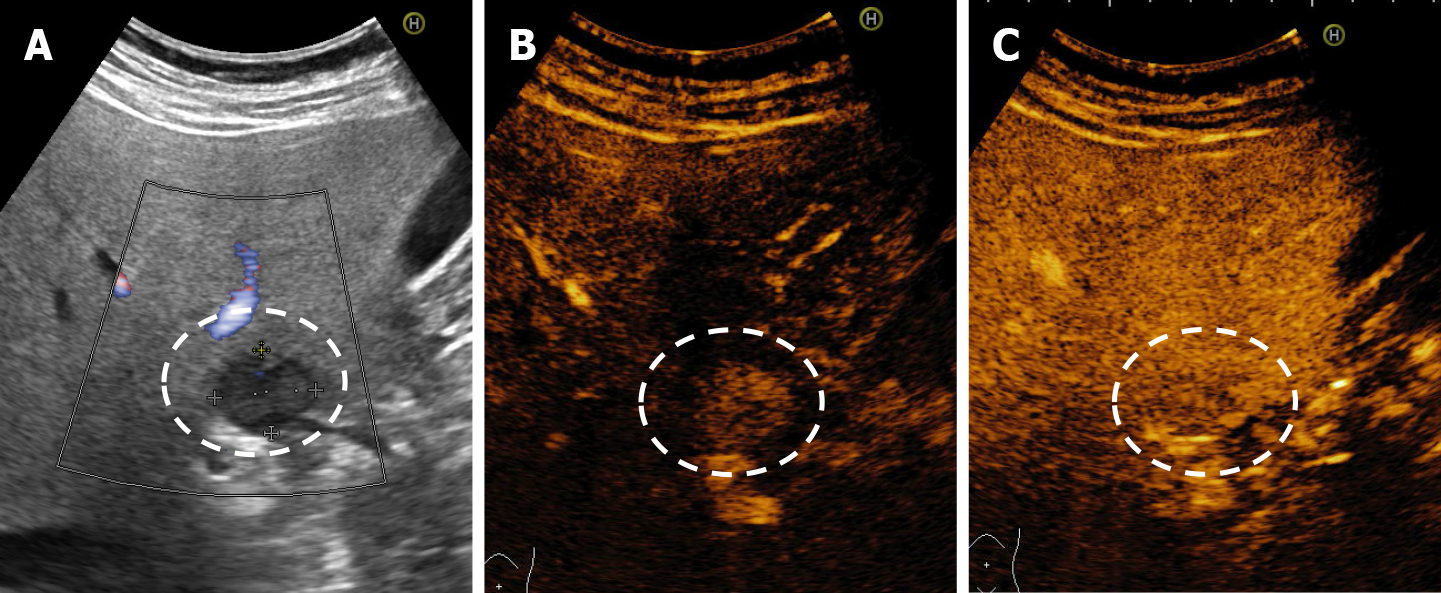
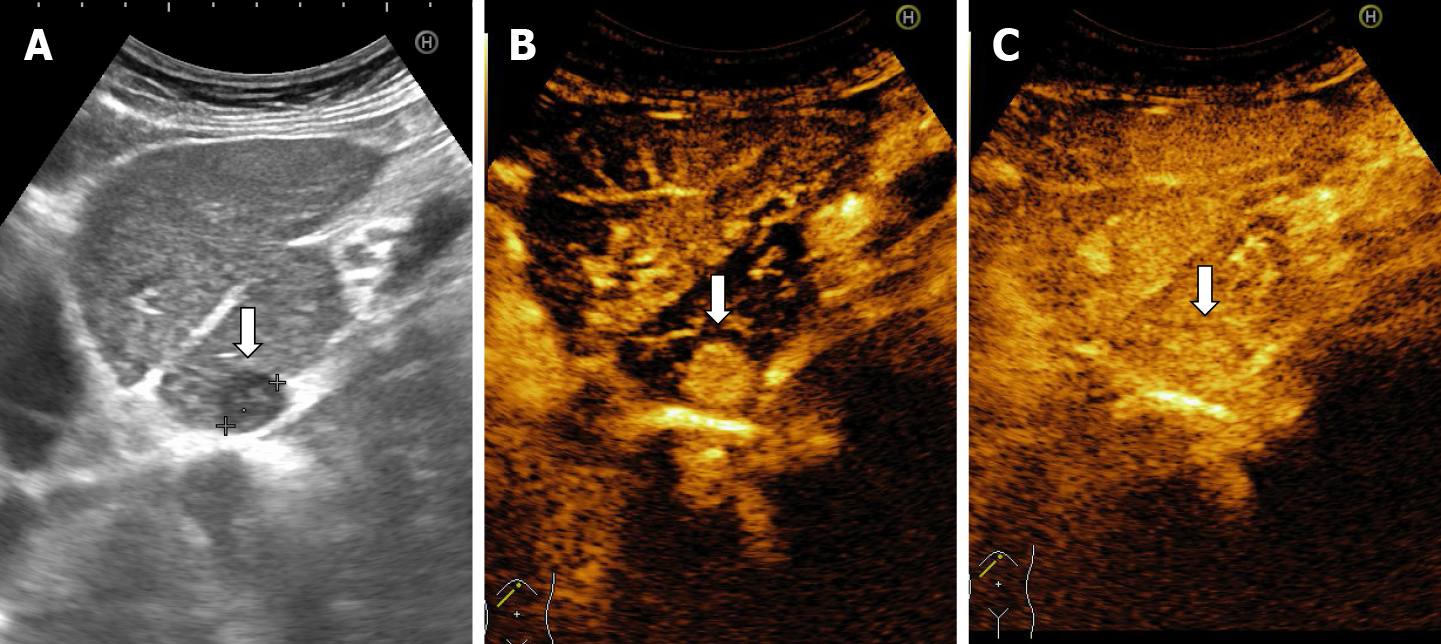
Figure 23 A difficult diagnosis in a case of a flash-filling hemangioma in a woman with hepatitis C liver cirrhosis.
A: On B mode ultrasound is observed inhomogeneous liver structure and enlargement of caudate lobe. A small hypoechoic lesion is detected in the caudate lobe; B: Flash-filling enhancement in arterial phase is noticed that is similar to the enhancement of an hepatocellular carcinoma; C: Even in the late phase the liver lesion had the same enhancement comparative with liver, the segmental resection was performed. On histopathological exam the conclusion was: liver hemangioma.
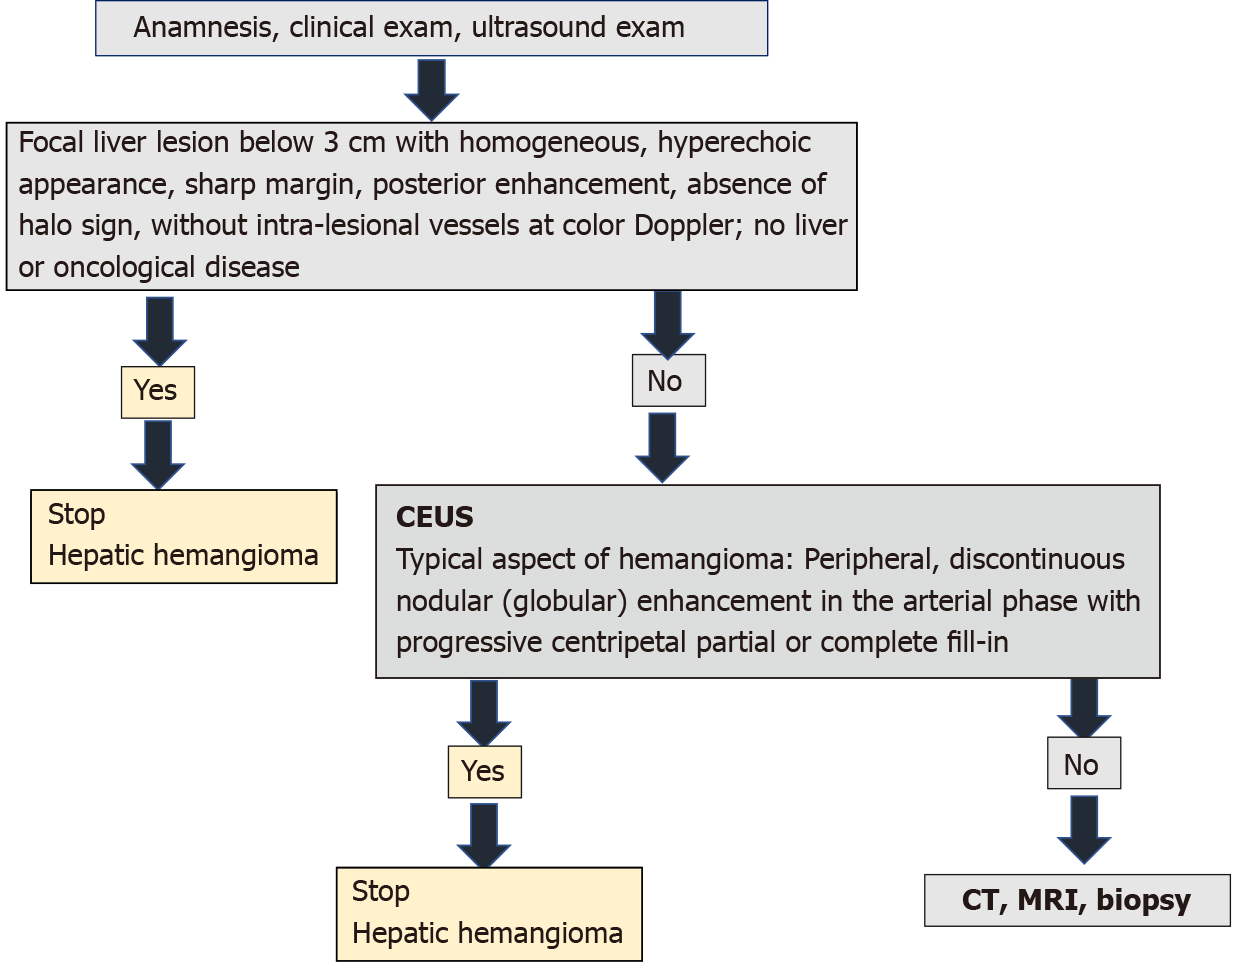
Figure 24 One stop shop approach for the diagnosis of liver hemangioma.
Algorithm for diagnosing hepatic hemangioma in the consulting room, adapted according to the latest guidelines of European Association for the Study of the Liver and World Federation for Ultrasound in Medicine and Biology. CEUS: Contrast enhanced ultrasound; CT: Computed tomography; MRI: Magnetic resonance imaging.
- Citation: Sandulescu LD, Urhut CM, Sandulescu SM, Ciurea AM, Cazacu SM, Iordache S. One stop shop approach for the diagnosis of liver hemangioma. World J Hepatol 2021; 13(12): 1892-1908
- URL: https://www.wjgnet.com/1948-5182/full/v13/i12/1892.htm
- DOI: https://dx.doi.org/10.4254/wjh.v13.i12.1892


