Copyright
©The Author(s) 2021.
World J Hepatol. Oct 27, 2021; 13(10): 1394-1404
Published online Oct 27, 2021. doi: 10.4254/wjh.v13.i10.1394
Published online Oct 27, 2021. doi: 10.4254/wjh.v13.i10.1394
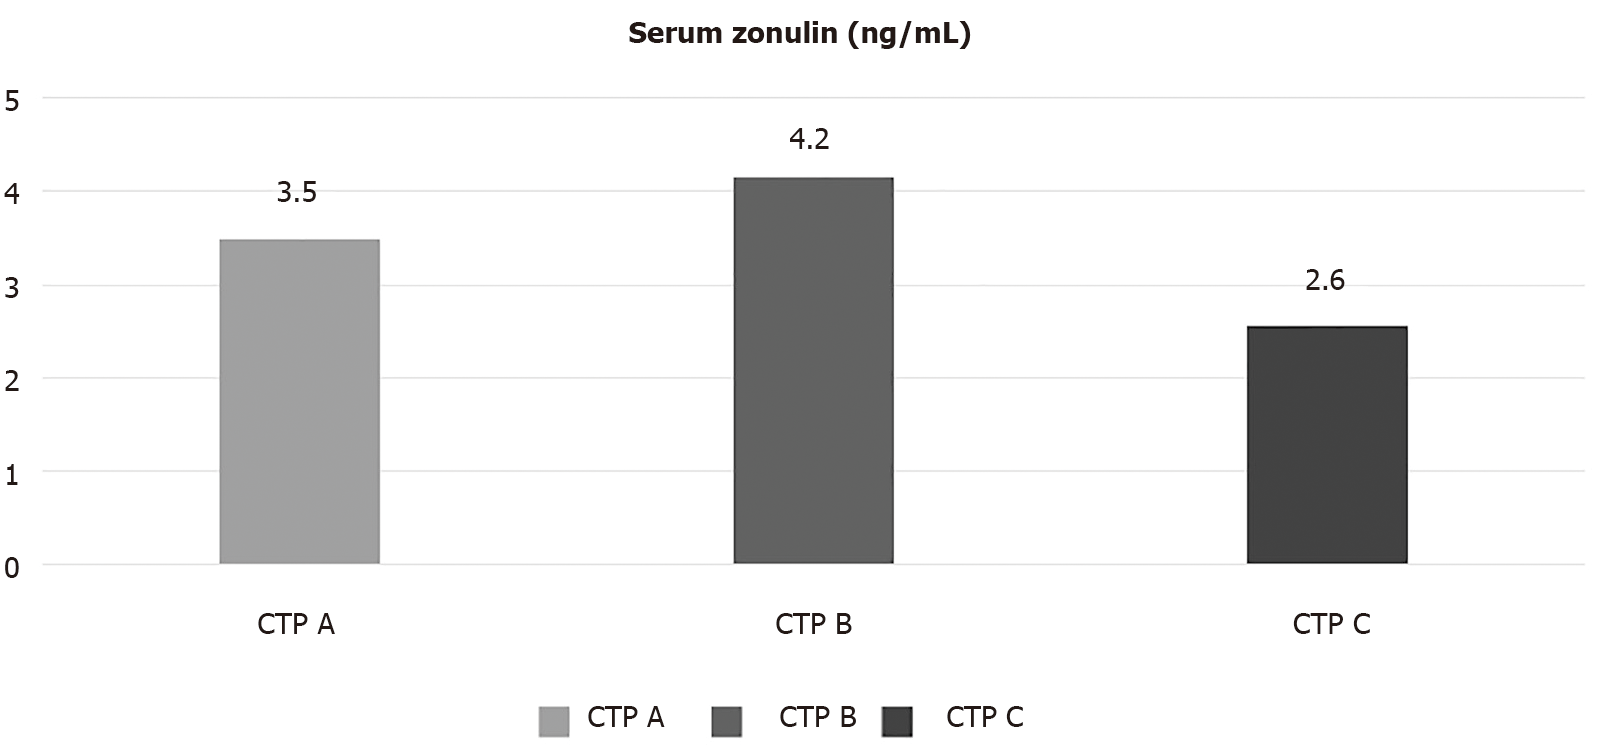
Figure 1 Mean serum zonulin levels (ng/mL) among different Child-Turcotte-Pugh classes.
Serum zonulin levels (expressed in ng/mL as mean) according to Child-Turcotte-Pugh stage. CTP: Child-Turcotte-Pugh.
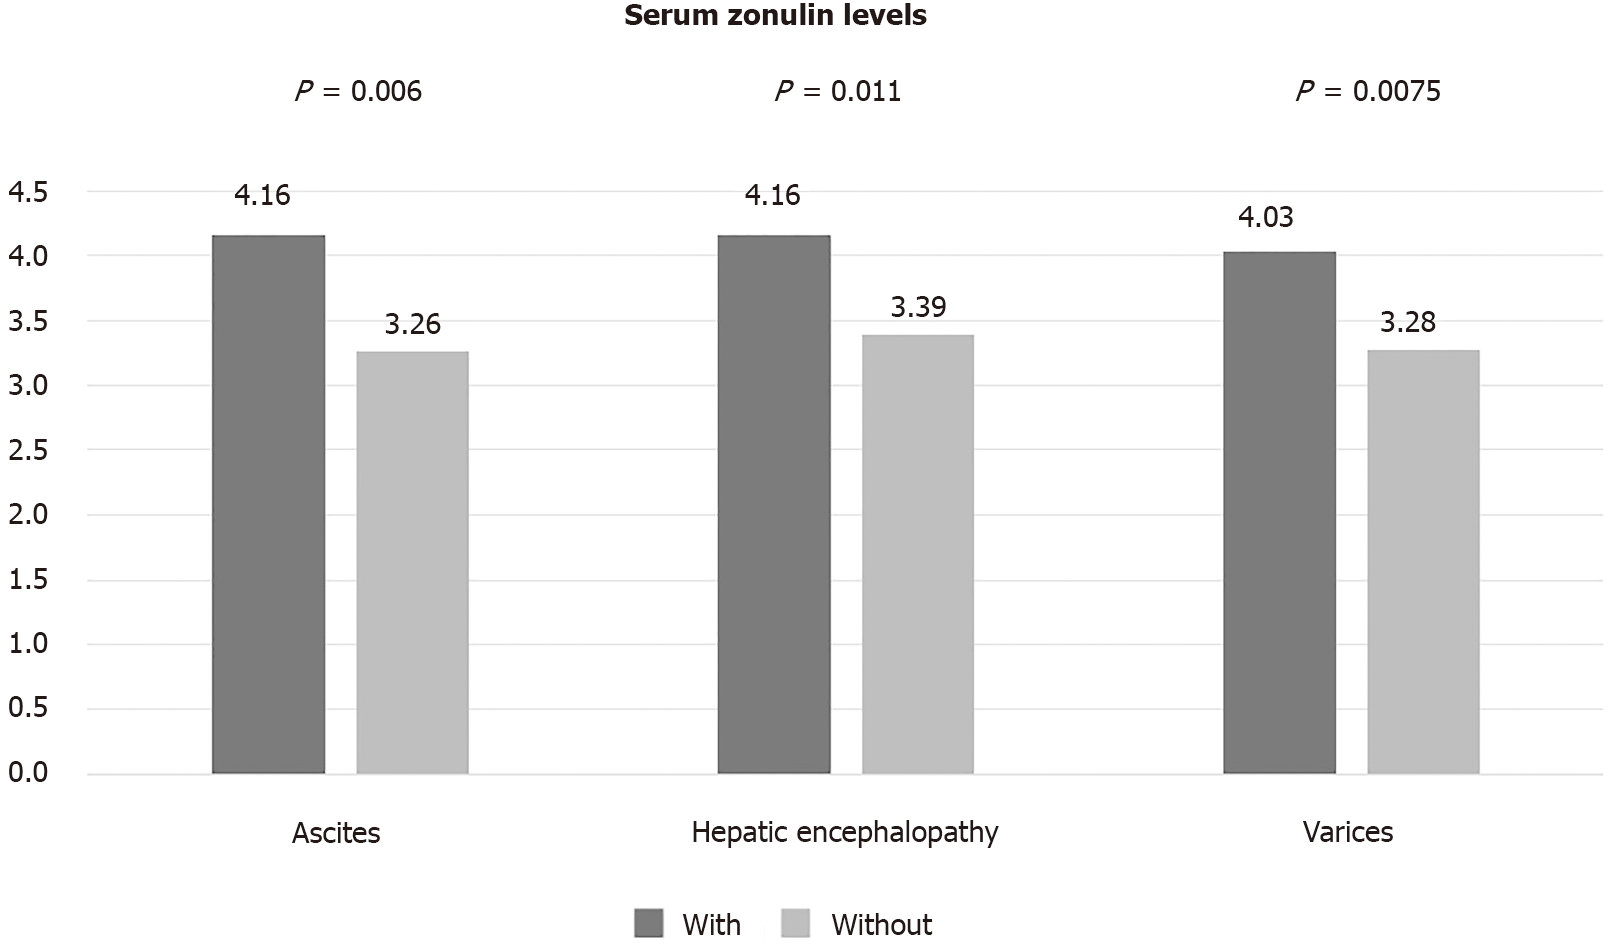
Figure 2
Mean serum zonulin levels (ng/mL) among different manifestations of advanced liver disease.
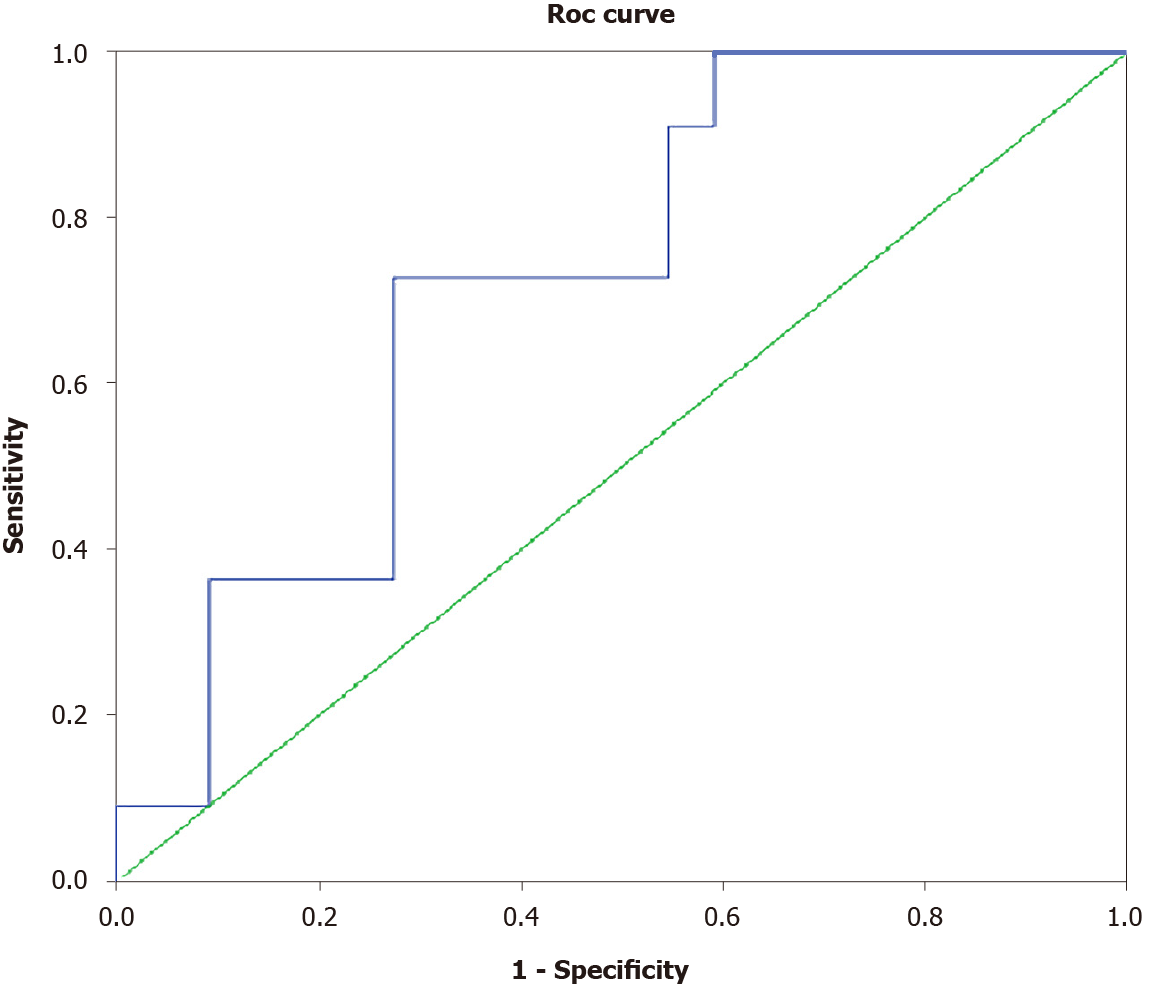
Figure 3 Receiver operating characteristic curve displacing baseline serum zonulin levels in predicting liver disease decompensation.
Area under the receiver operating characteristic curve: 0.723, P = 0.039. ROC: Receiver operating characteristic.
- Citation: Voulgaris TA, Karagiannakis D, Hadziyannis E, Manolakopoulos S, Karamanolis GP, Papatheodoridis G, Vlachogiannakos J. Serum zonulin levels in patients with liver cirrhosis: Prognostic implications. World J Hepatol 2021; 13(10): 1394-1404
- URL: https://www.wjgnet.com/1948-5182/full/v13/i10/1394.htm
- DOI: https://dx.doi.org/10.4254/wjh.v13.i10.1394


