Copyright
©The Author(s) 2020.
World J Hepatol. Jul 27, 2020; 12(7): 399-405
Published online Jul 27, 2020. doi: 10.4254/wjh.v12.i7.399
Published online Jul 27, 2020. doi: 10.4254/wjh.v12.i7.399
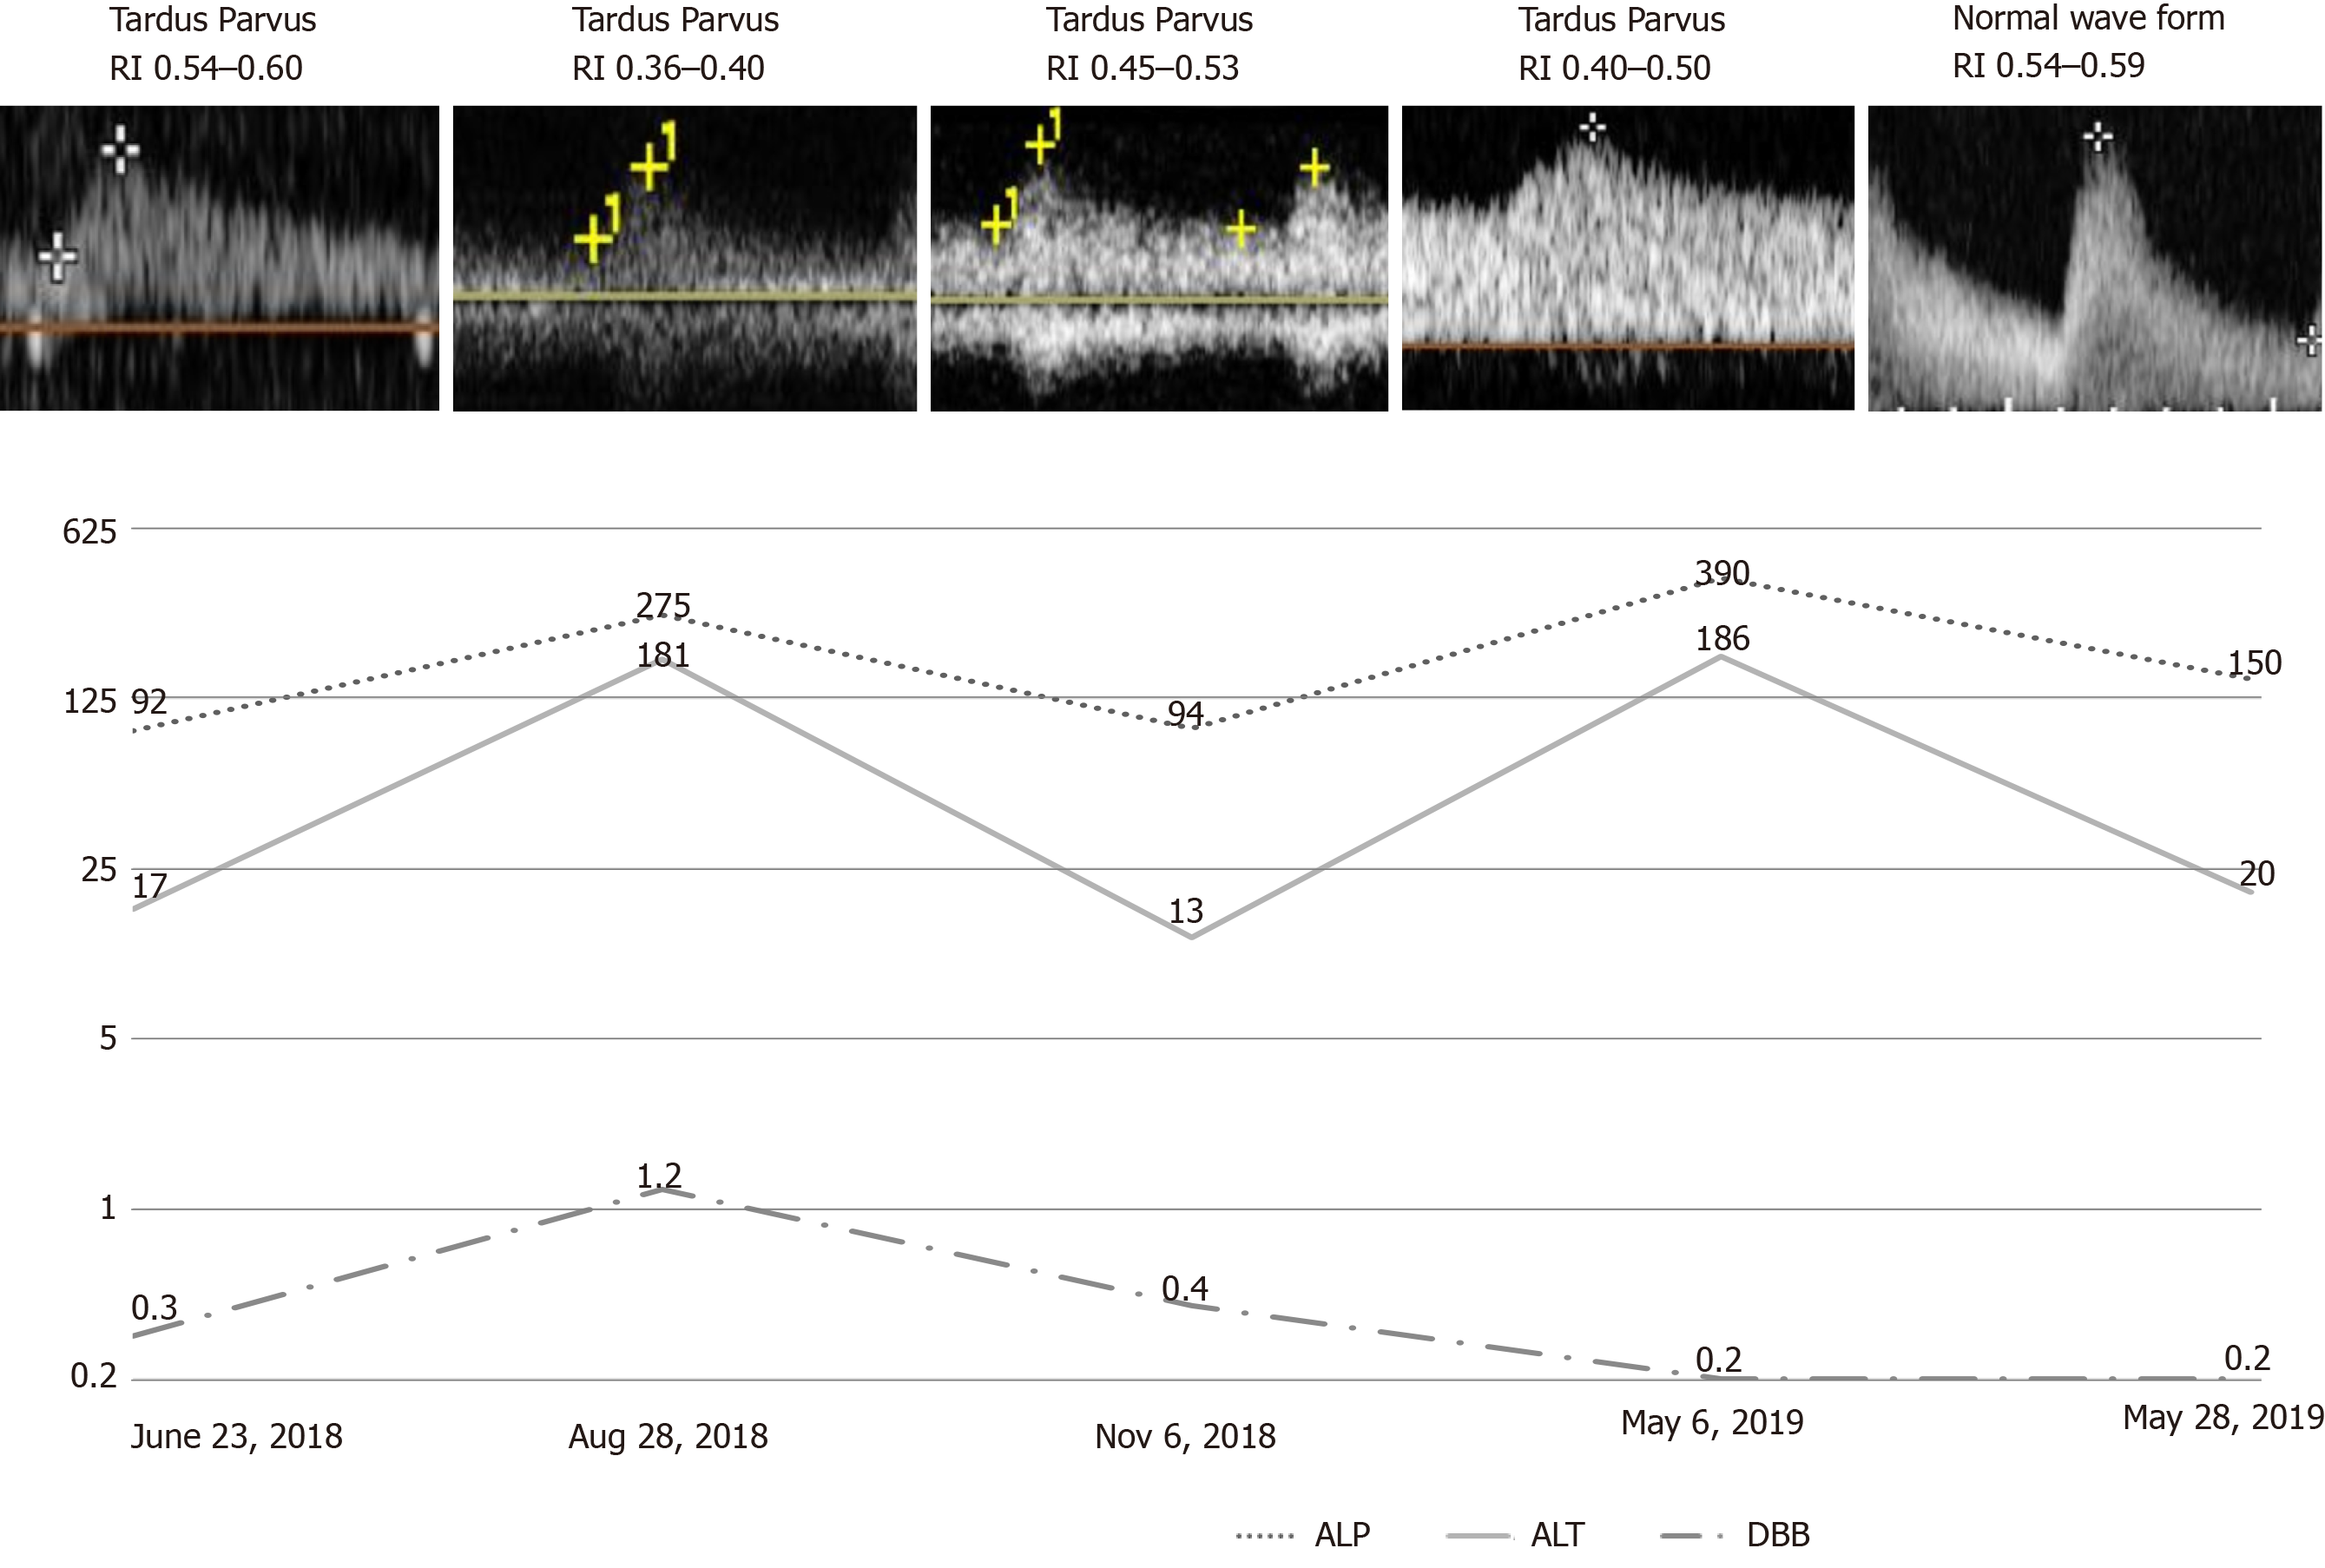
Figure 1 Graphic showing patient’s serum levels of direct bilirubin (mg/dL), alkaline phosphatase (U/L) and alanine aminotransferase (U/L); Doppler wave forms and resistive index along time.
DBB: Direct bilirubin; ALP: Alkaline phosphatase; ALT: Alanine aminotransferase; RI: Resistance index.
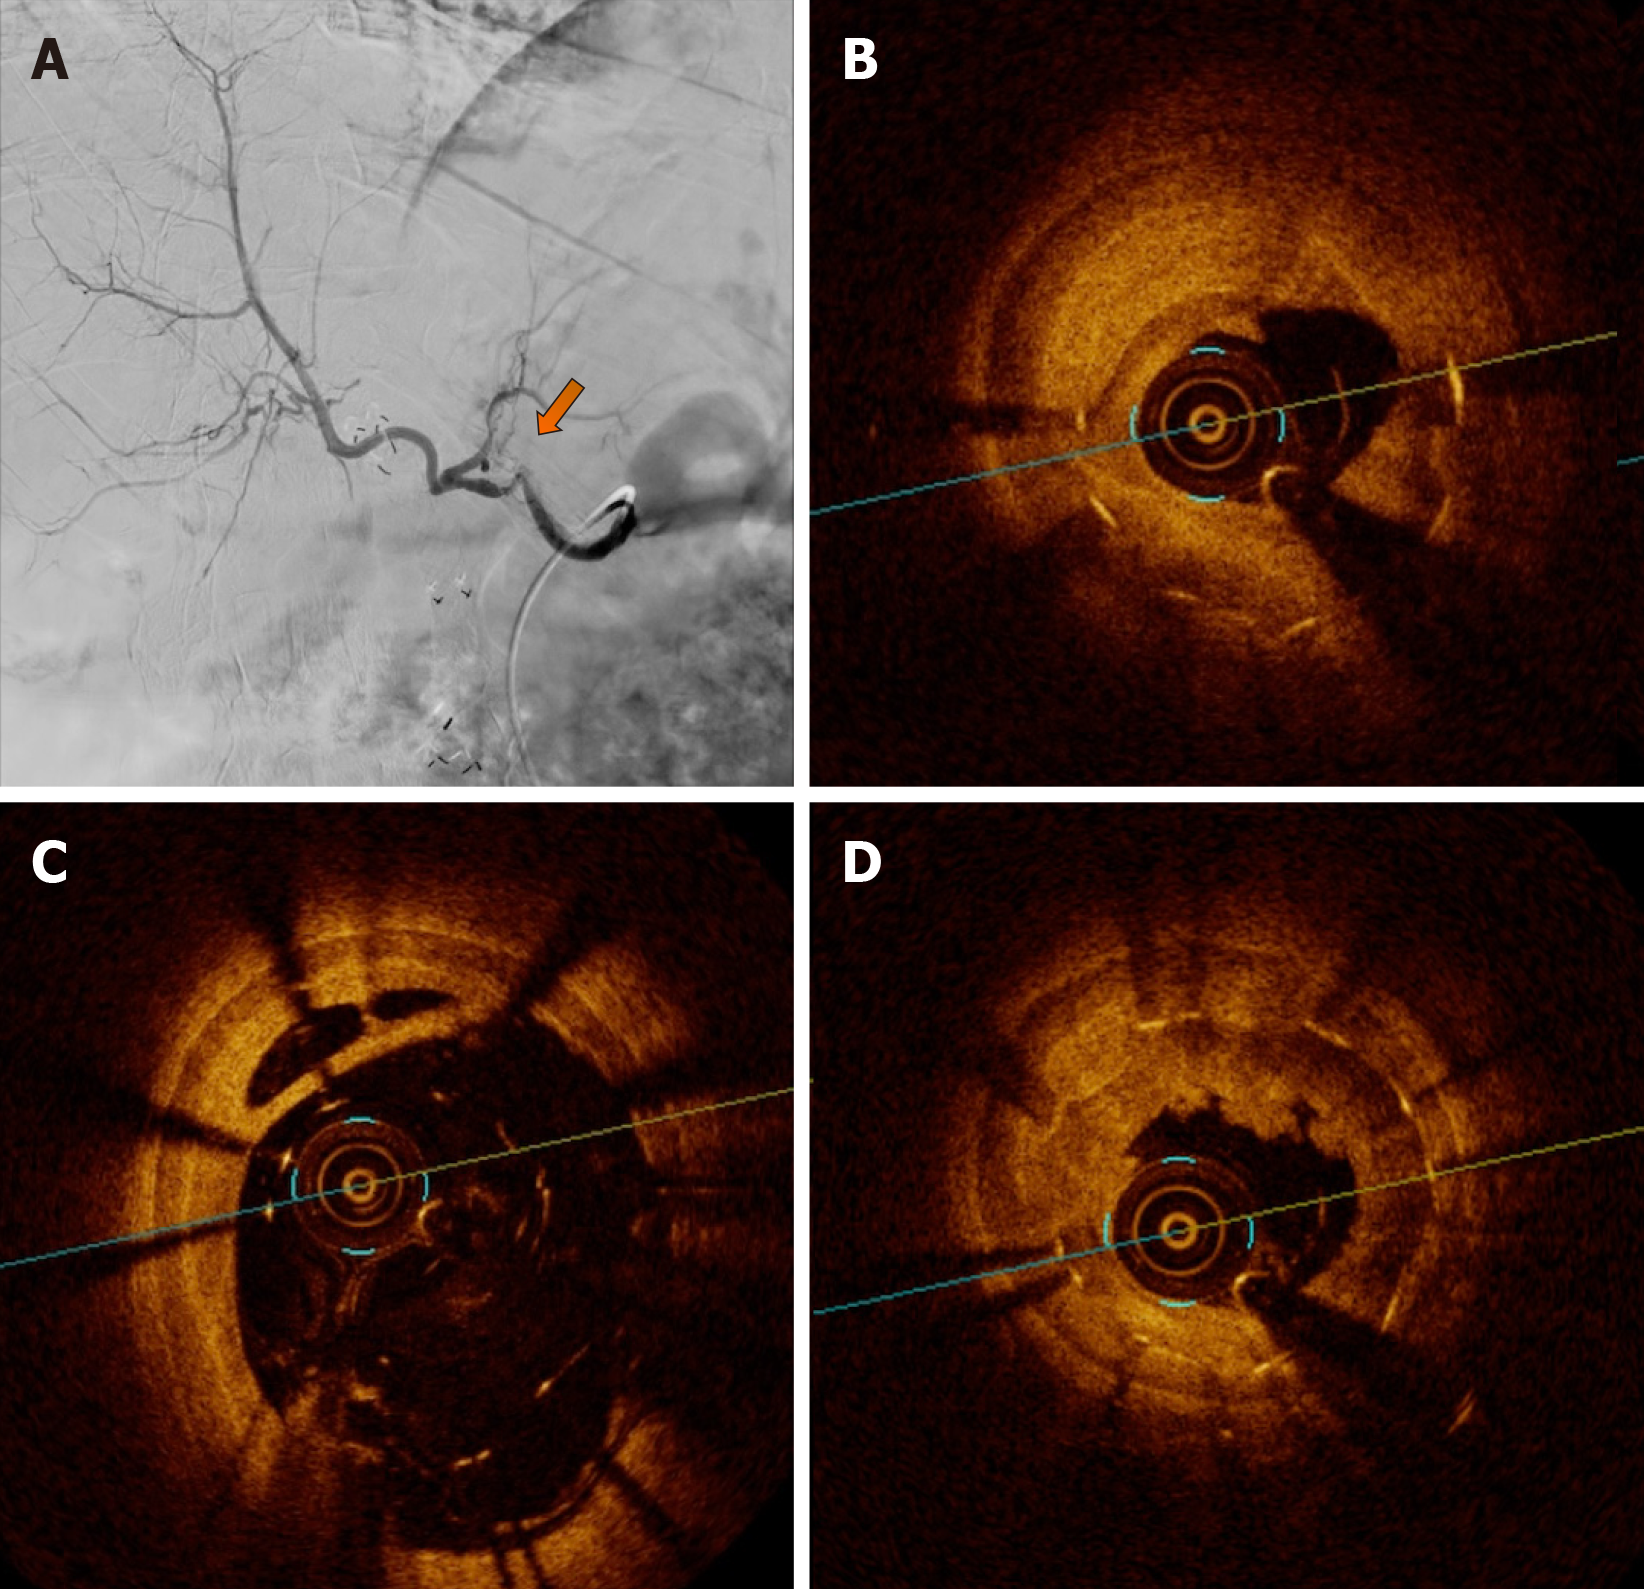
Figure 2 Visceral arteriography and optical coherence tomography.
A: Visceral arteriography diagnosis with hepatic artery tortuosity and doubtful significant intra-stent diameter reduction and intrahepatic flow reduction. The yellow arrow indicates the possible stenosis area, to be confirmed further with an intravascular method; B: OCT diagnosis of severe stenosis due neointimal hyperplasia and focal and partial stent fracture; C: OCT diagnosis of stent late malapposition; D: OCT diagnosis of in-stent neointimal hyperplasia and neoatherosclerosis. OCT: Optical coherence tomography.
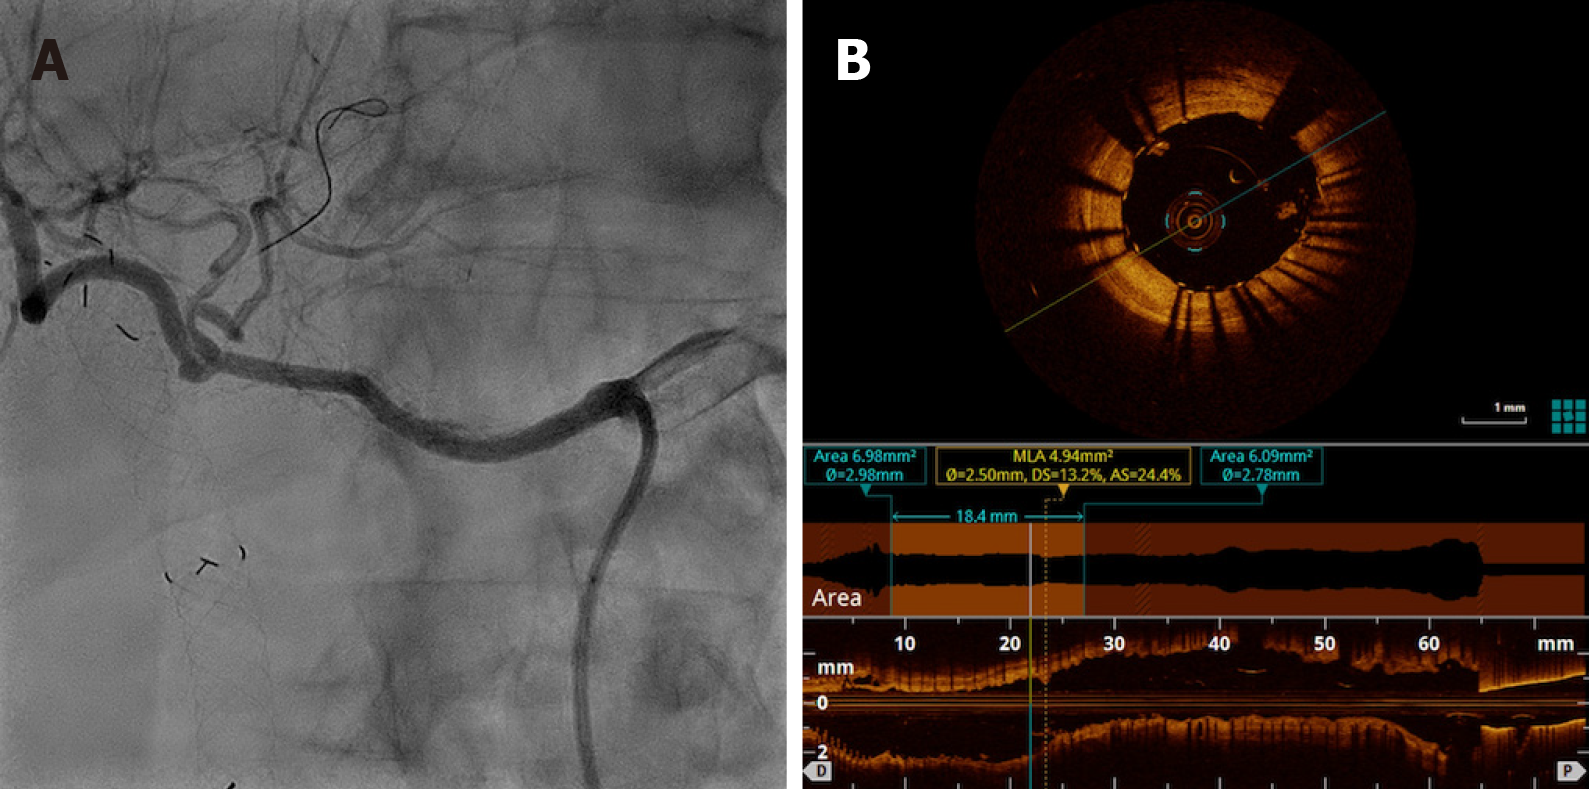
Figure 3 Visceral arteriography after percutaneous transluminal angioplasty and optical coherence tomography posttreatment.
A: Visceral arteriography after percutaneous transluminal angioplasty with drug-eluting stent (Sirolimus) Orsiro 3 mm × 30 mm (Biotronik) showing complete resolution of restenosis and improvement in intrahepatic perfusion; B: Optical coherence tomography posttreatment showing acute gain in luminal area due to complete stent expansion.
- Citation: Galastri FL, Gilberto GM, Affonso BB, Valle LGM, Falsarella PM, Caixeta AM, Lima CA, Silva MJ, Pinheiro LL, Baptistella CDPA, Almeida MD, Garcia RG, Wolosker N, Nasser F. Diagnosis and management of hepatic artery in-stent restenosis after liver transplantation by optical coherence tomography: A case report. World J Hepatol 2020; 12(7): 399-405
- URL: https://www.wjgnet.com/1948-5182/full/v12/i7/399.htm
- DOI: https://dx.doi.org/10.4254/wjh.v12.i7.399


