Copyright
©The Author(s) 2020.
World J Hepatol. Oct 27, 2020; 12(10): 775-791
Published online Oct 27, 2020. doi: 10.4254/wjh.v12.i10.775
Published online Oct 27, 2020. doi: 10.4254/wjh.v12.i10.775
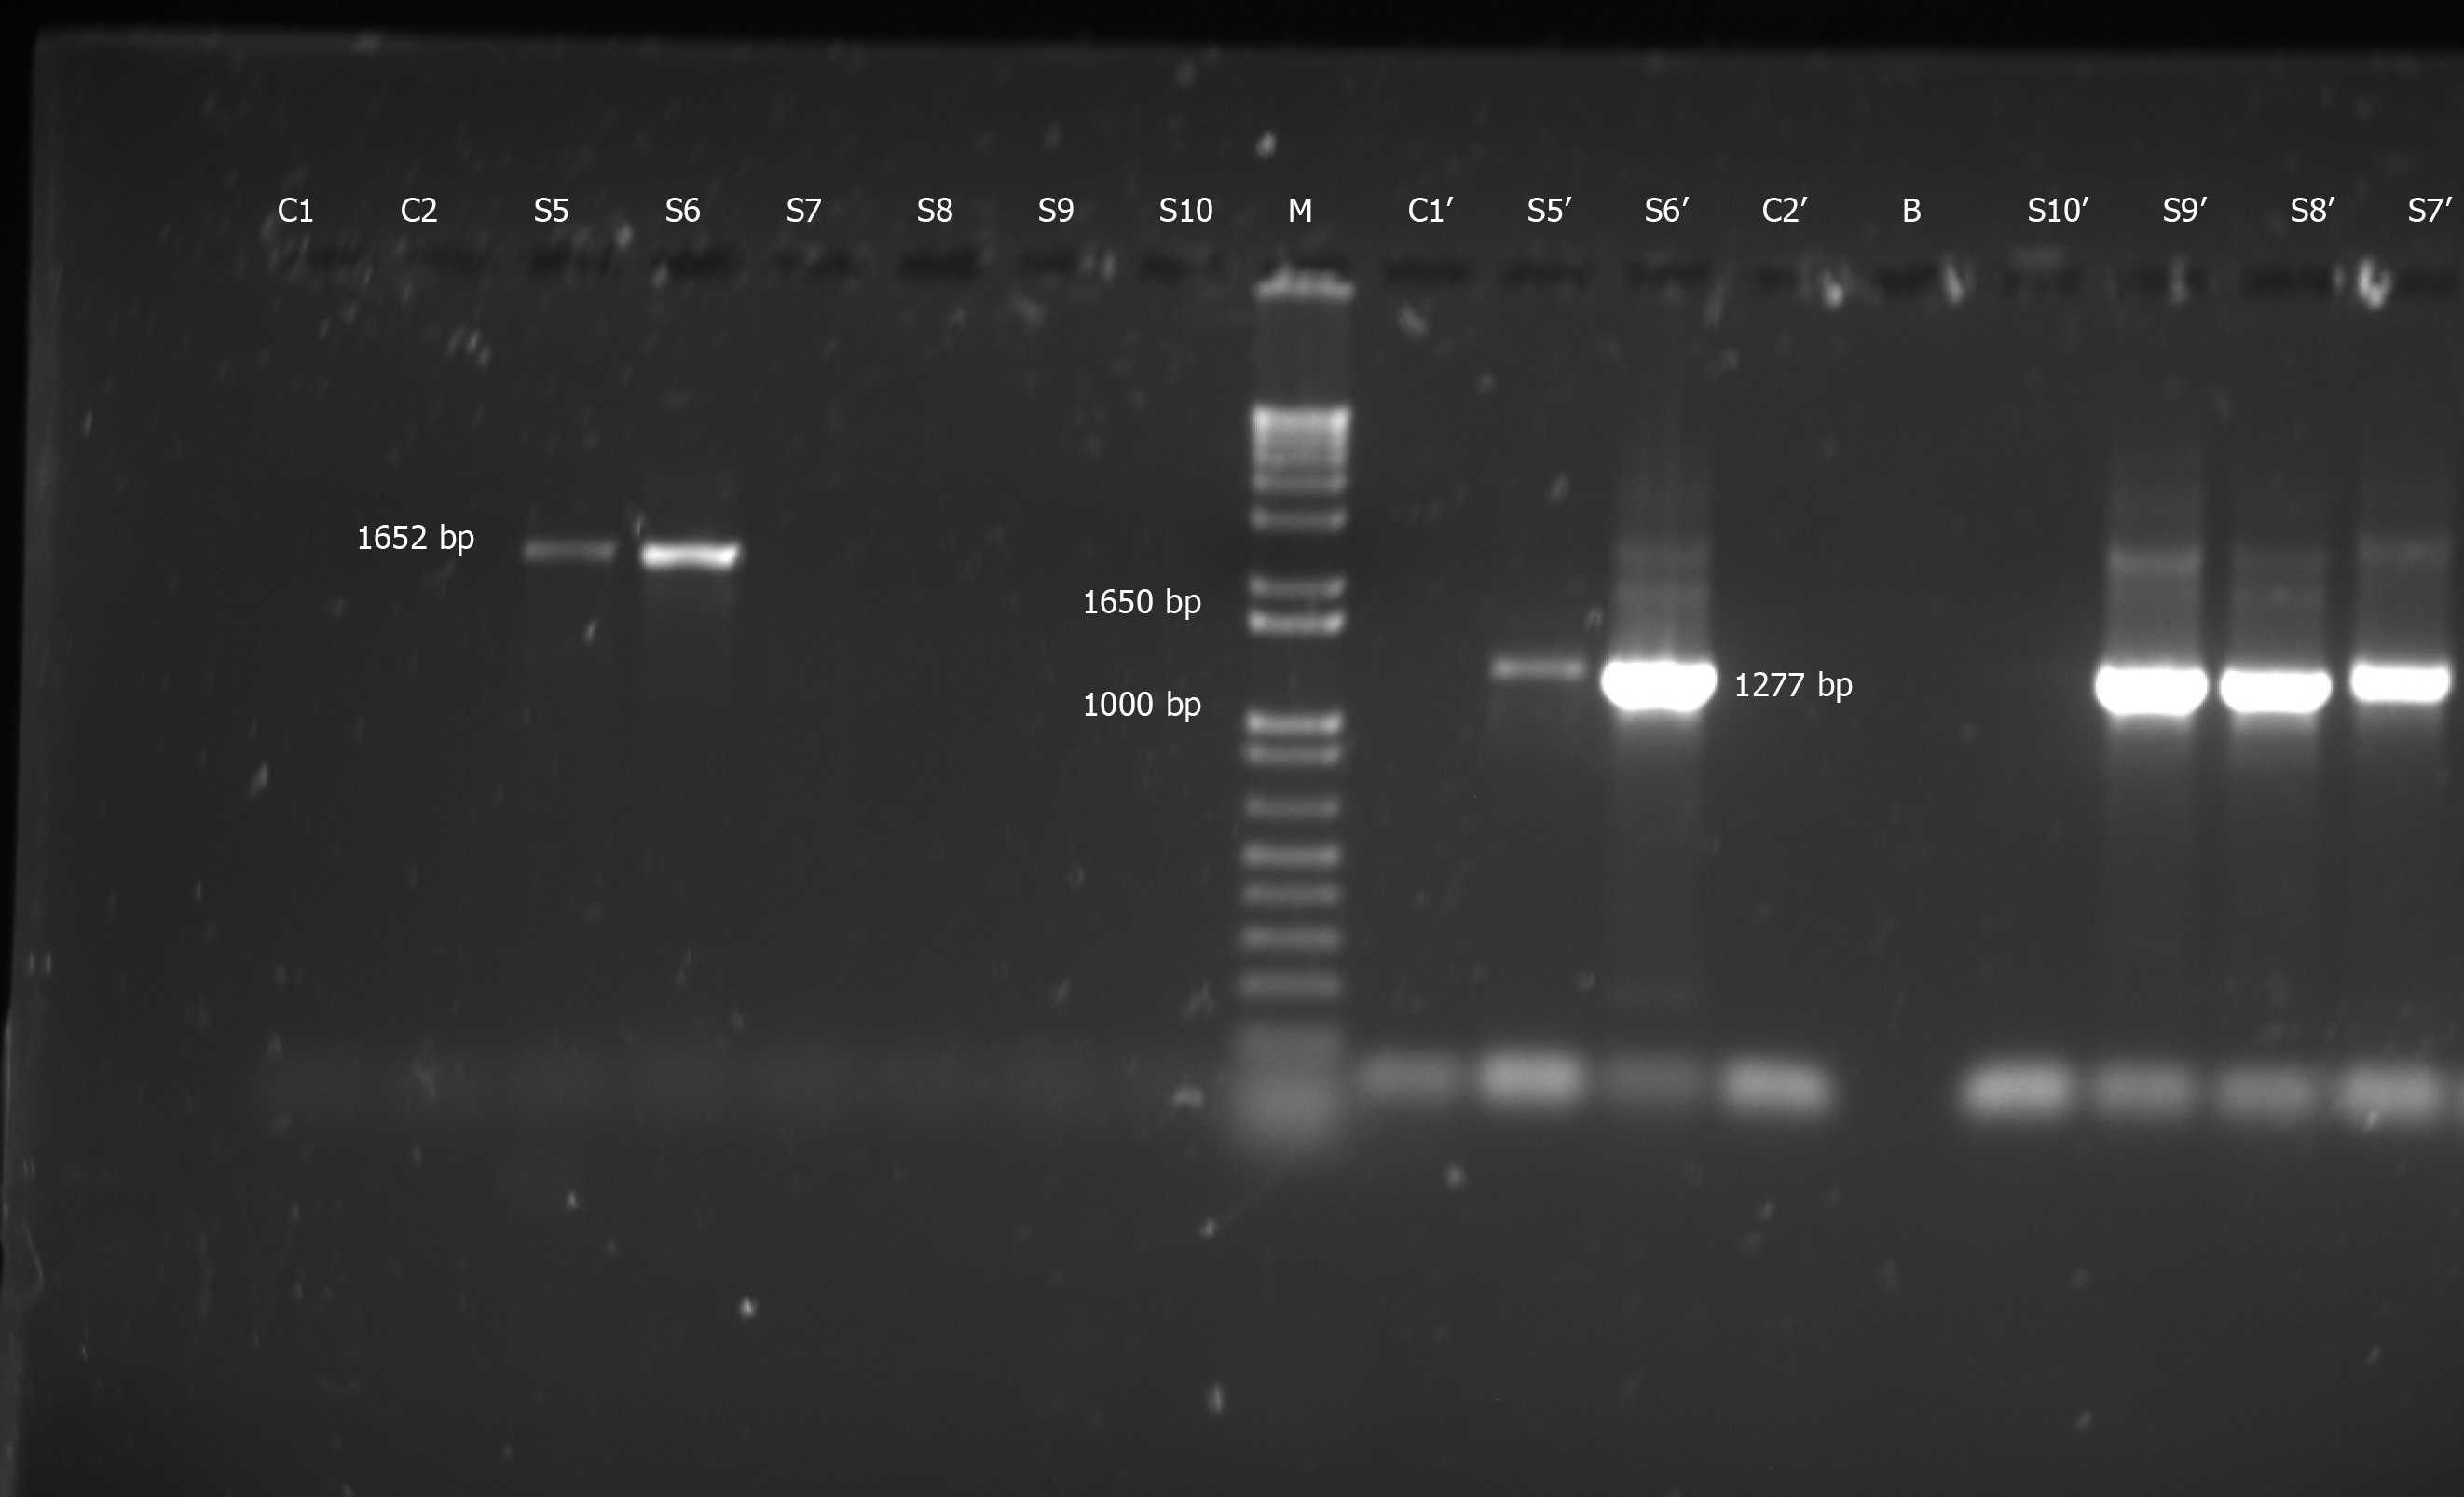
Figure 1 Representative gel electrophoresis on 1.
5% agarose gels depicting hepatitis B virus “S” gene-specific polymerase chain reaction products and relevant controls. This proves that none of the lab reagents/equipment were contaminated with hepatitis B virus: Negative control with nuclease-free water used for sample polymerase chain reactions (PCR (C1), negative control for primers SPL-3 & SPL-2, using fresh nuclease-free water (C2), nested SPL-4-5 PCR product with C1 (C1’), SPL-4-5 nested PCR product with C2 (C2’), first round PCR with SPL-3-2 primers yielding 1652 bp band (S5 and S6), SPL-3-2 PCR yielding no bands (S7-S10); second round nested PCRs with SPL-4-5 primers with S5-9 yielding 1277 bp band (S5’-S9’), SPL-4-5 nested PCR yielding no band (S10’) and a well left blank (i.e. loaded with no sample) (B). M is the molecular weight marker.
Figure 2 Hepatitis B virus S protein (partial) multiple sequence alignment of the test samples (S5-S9) with hepatitis B virus D2 sequences retrieved from GenBank.
The retrieved sequences are identified by their GenBank accession numbers on the figure. Gene sequences pertaining to nucleotide positions 155 to 835 (coding for the full S protein) as in hepatitis B virus 34 genotype D2 isolate (accession number KC875340) are used for comparing with the test samples.
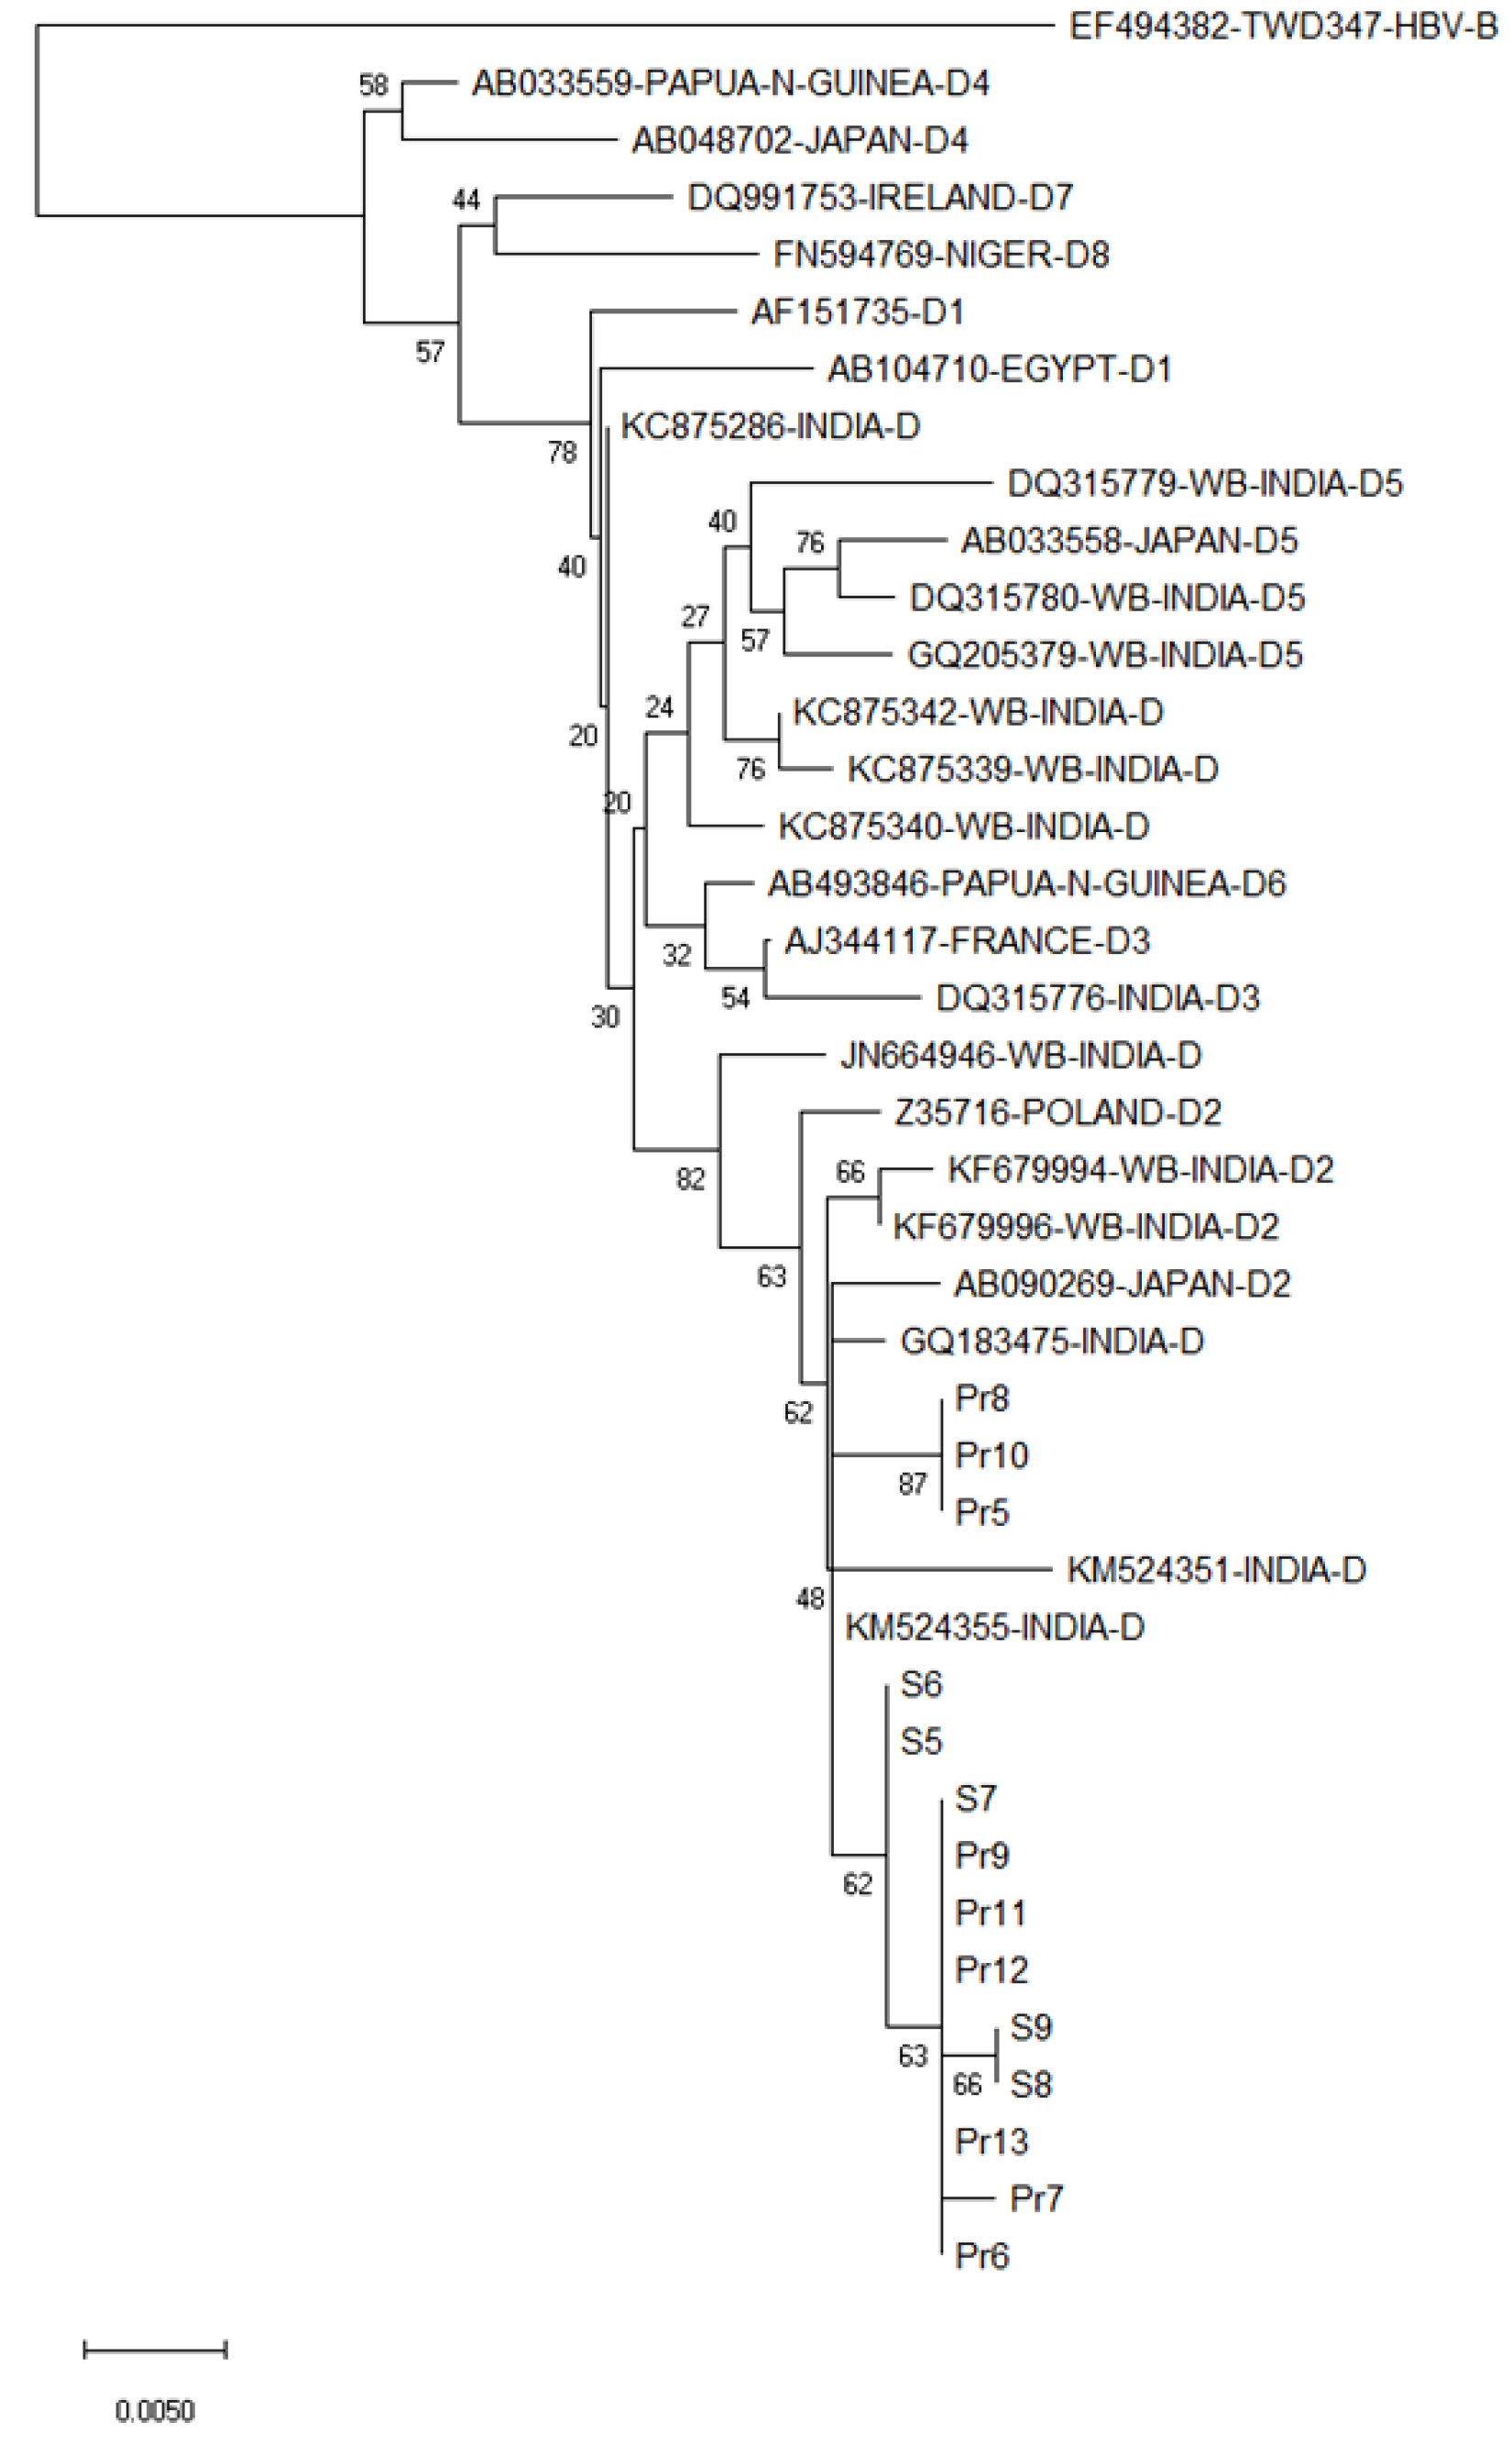
Figure 3 Phylogenetic analysis of the hepatitis B virus S gene (partial) of the hepatitis B virus isolates from the currency notes relative to several other hepatitis B virus isolates of genotype D.
The analysis was based on variability in 510 nucleotides (nt), pertaining to nt positions 326-835 as in in hepatitis B virus 34 genotype D2 isolate, accession number KC875340, West Bengal, India. Hepatitis B virus sequences and their place of origin, retrieved from GenBank for comparing with hepatitis B virus sequences in the present study, are identified by their GenBank accession numbers. The numbers shown next to the branches of the phylogenetic tree represent the percentage of replicate trees in which the associated taxa grouped together in the bootstrap test (2000 replicates). The scale bar indicates genetic distance in terms of nucleotide substitution/site/year.
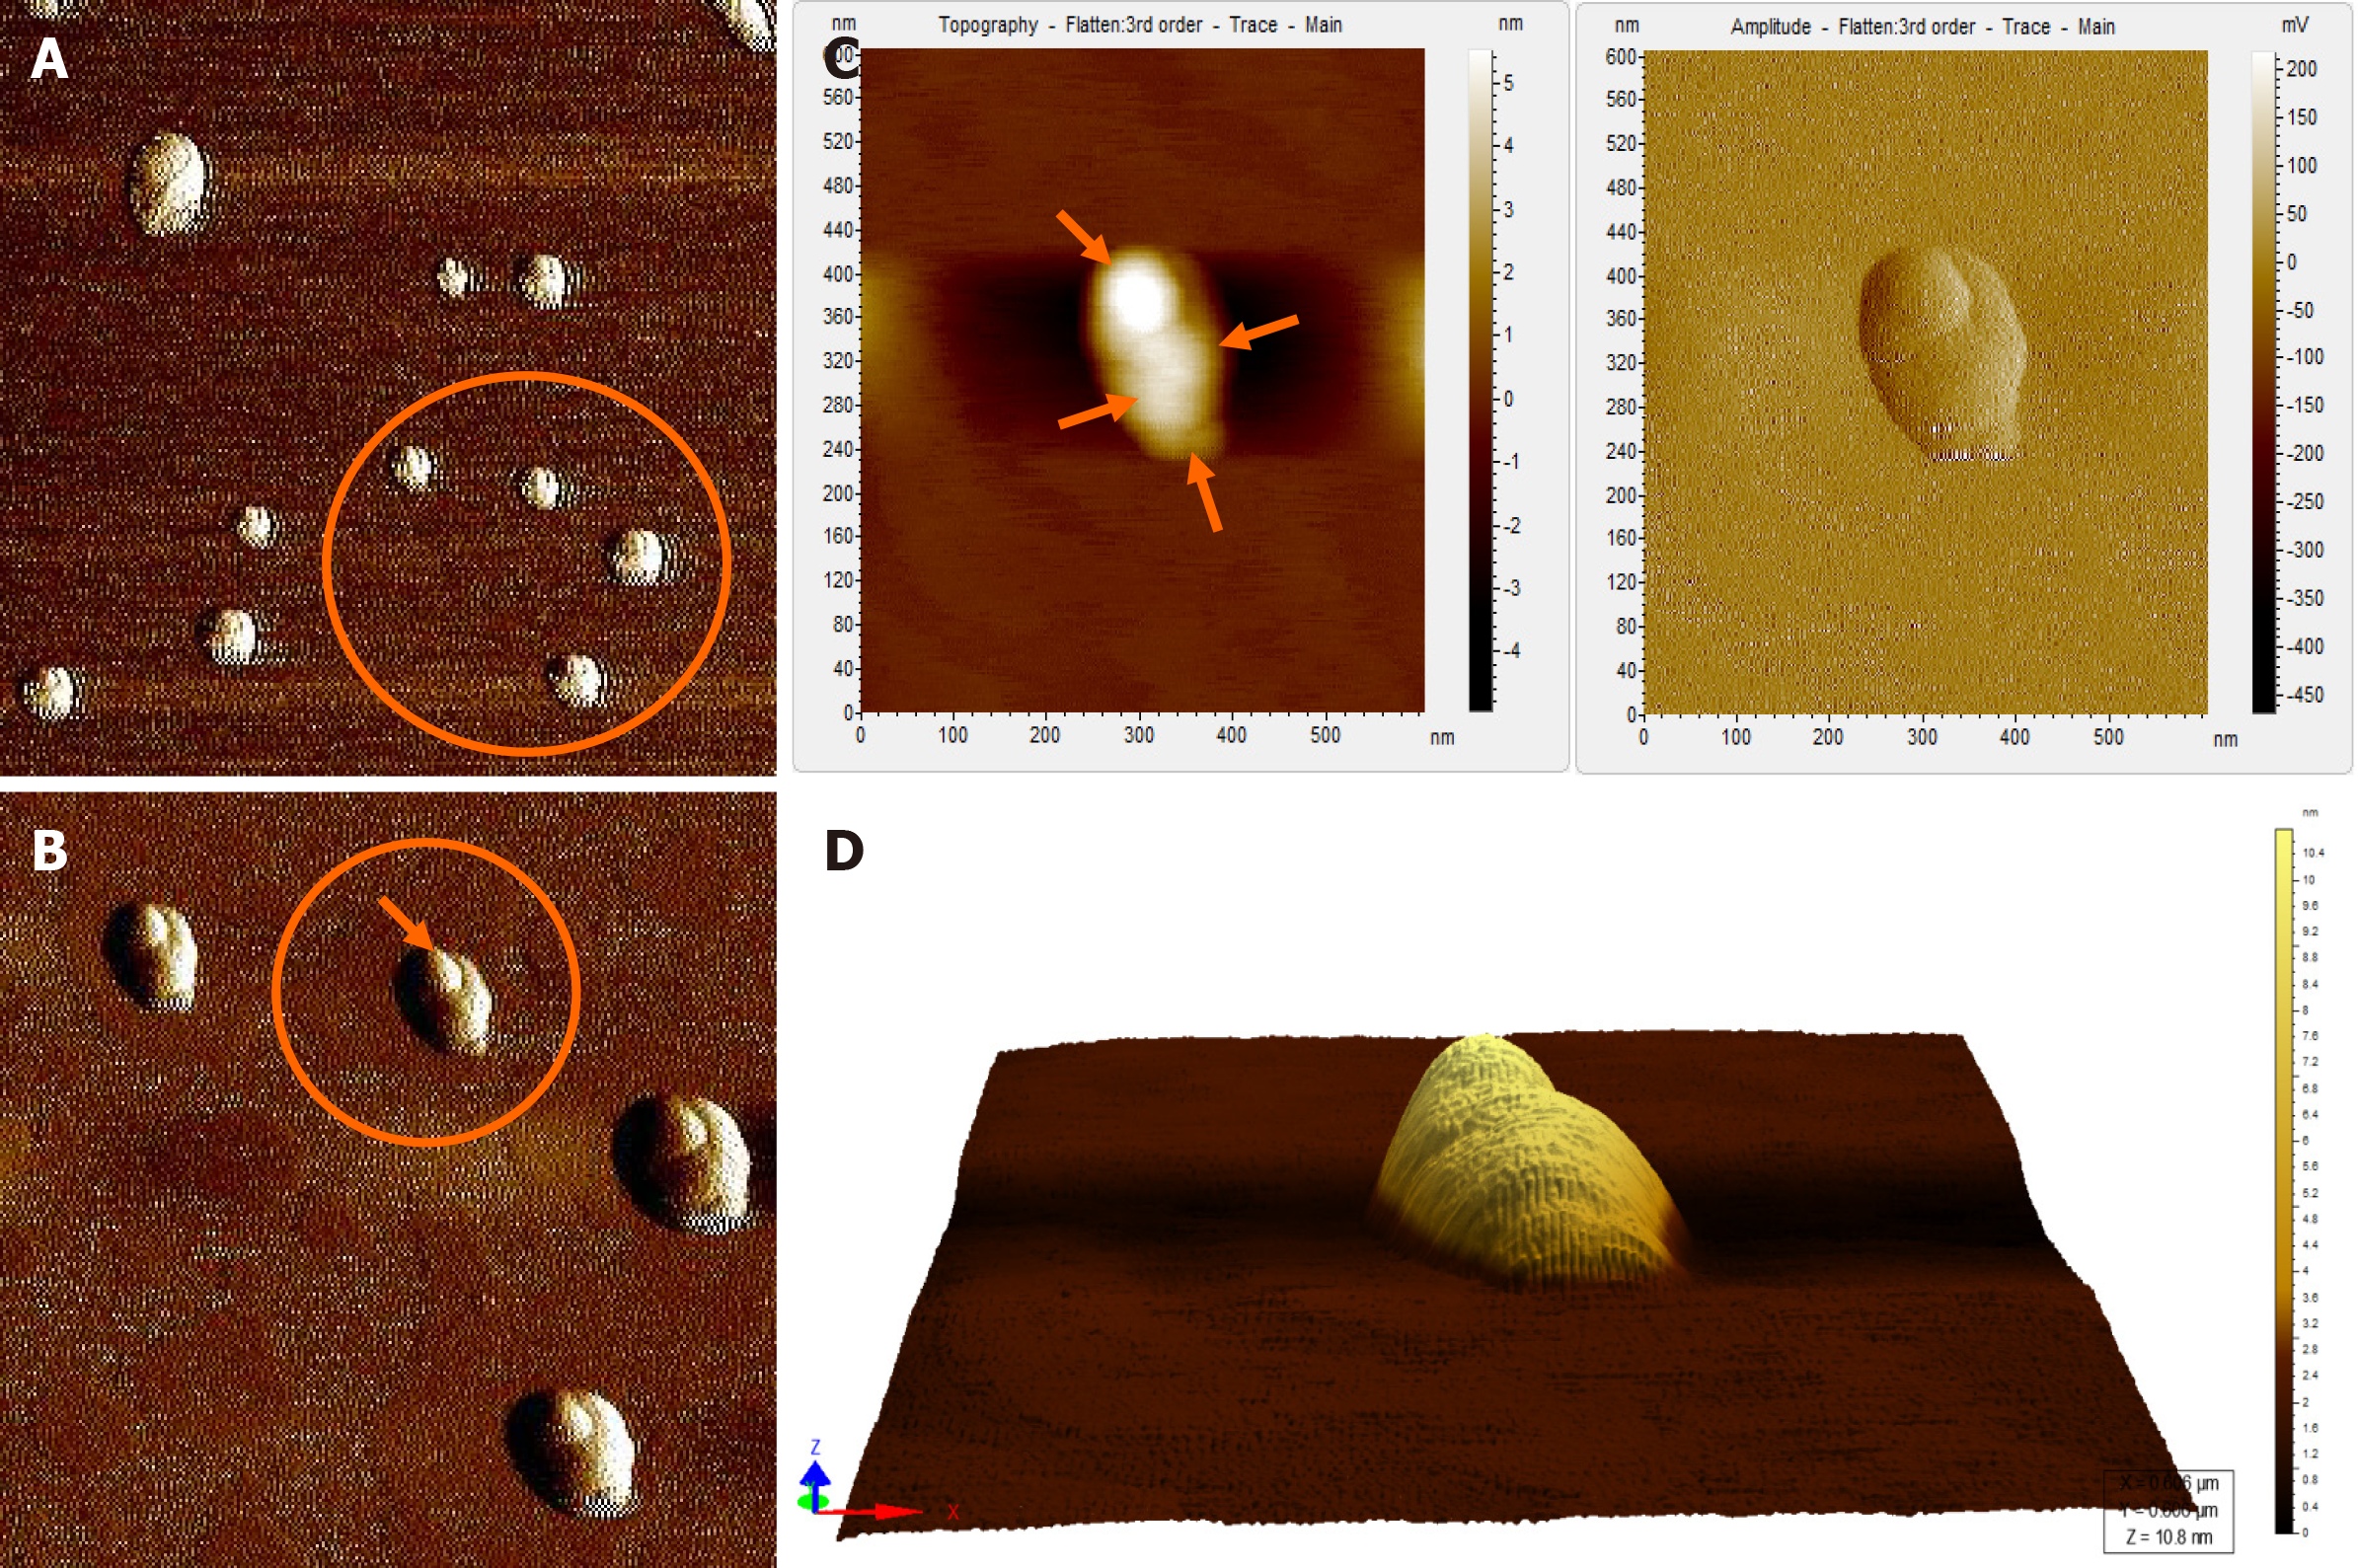
Figure 4 Atomic force microscopy images of hepatitis B virus-positive sample S8.
A: Wider field of view for the sample; B: Magnified view of the encircled area marked in Figure 4A; The encircled area illustrates representative cluster of virion particles. The arrow points to a single particle in the cluster; C: Magnified view of encircled area shown in Figure 4B in two different contrasts. The arrows show the individual intact virion particle of approximately 42 nm diameter; D: Three-dimensional (3D) view of the individual clusters seen in Figure 4C.
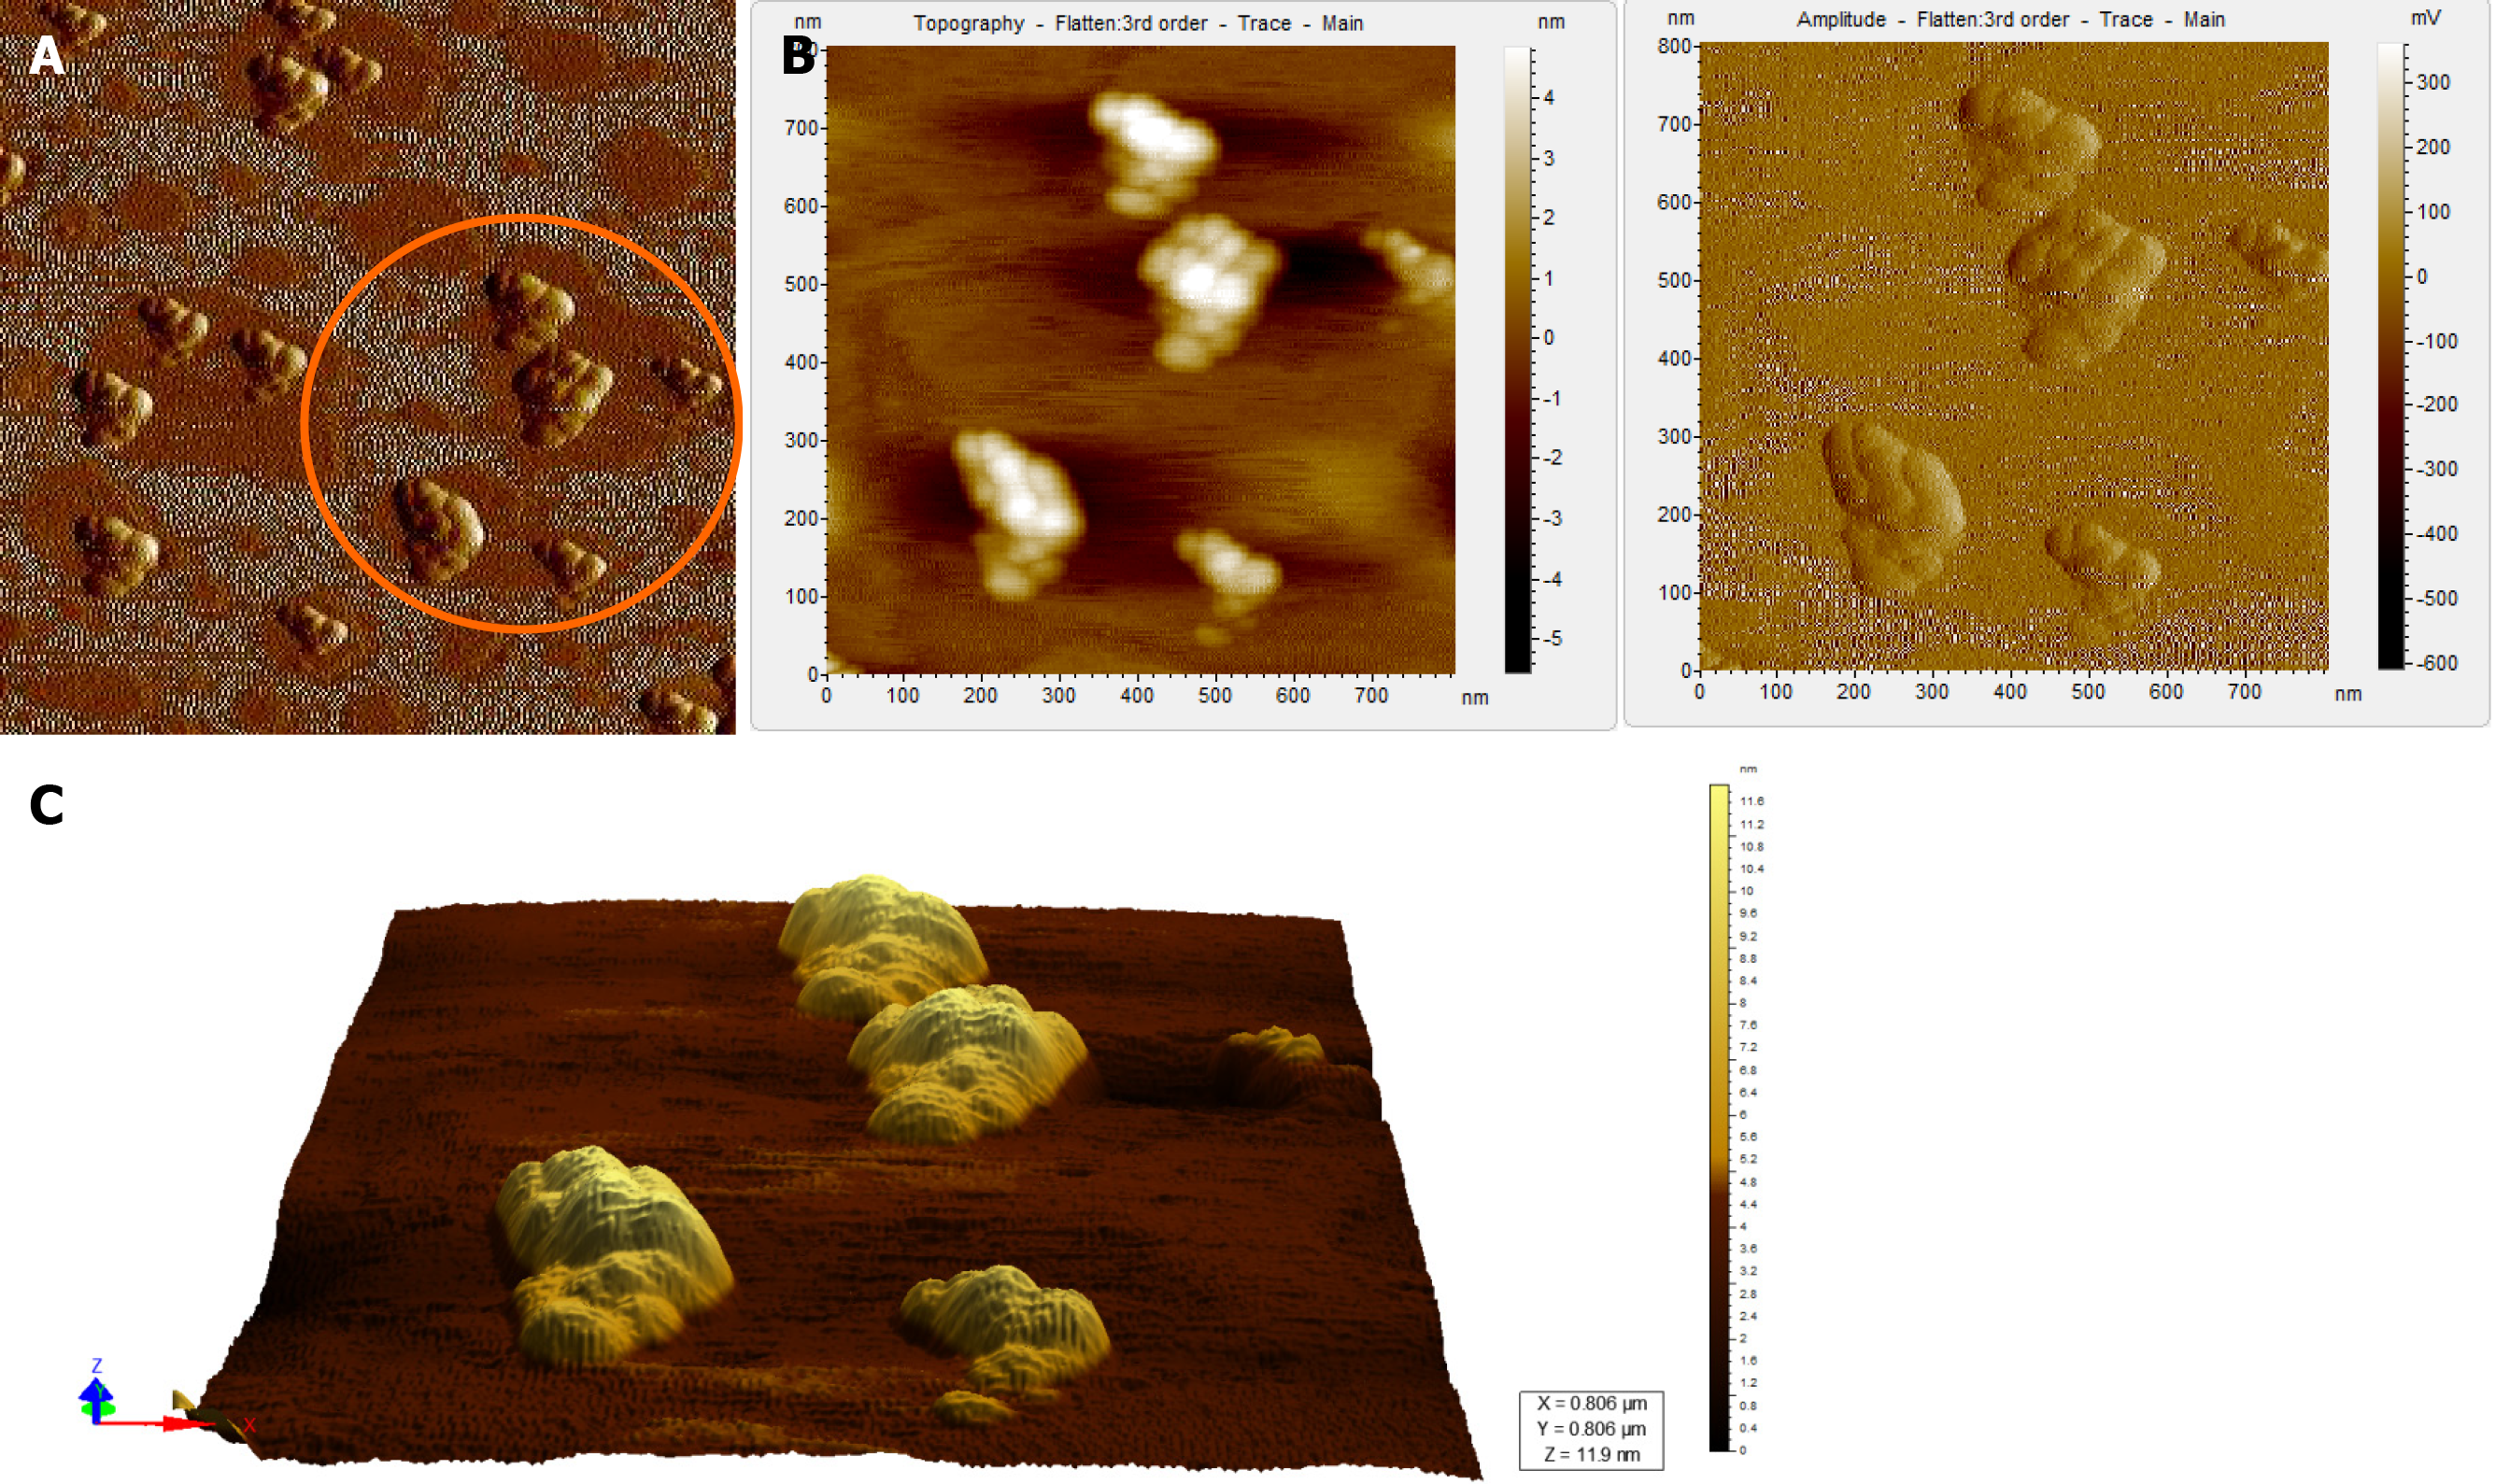
Figure 5 Atomic force microscopy images of a hepatitis B virus-negative sample.
A: Wide field of view of clumps of globular structures that look different from that seen in Figure 4A. These clumps share no resemblance with the structure of hepatitis B virus particles; B: Magnified view of the encircled region in Figure 5A in two different contrasts; C: 3D view of the clumps.
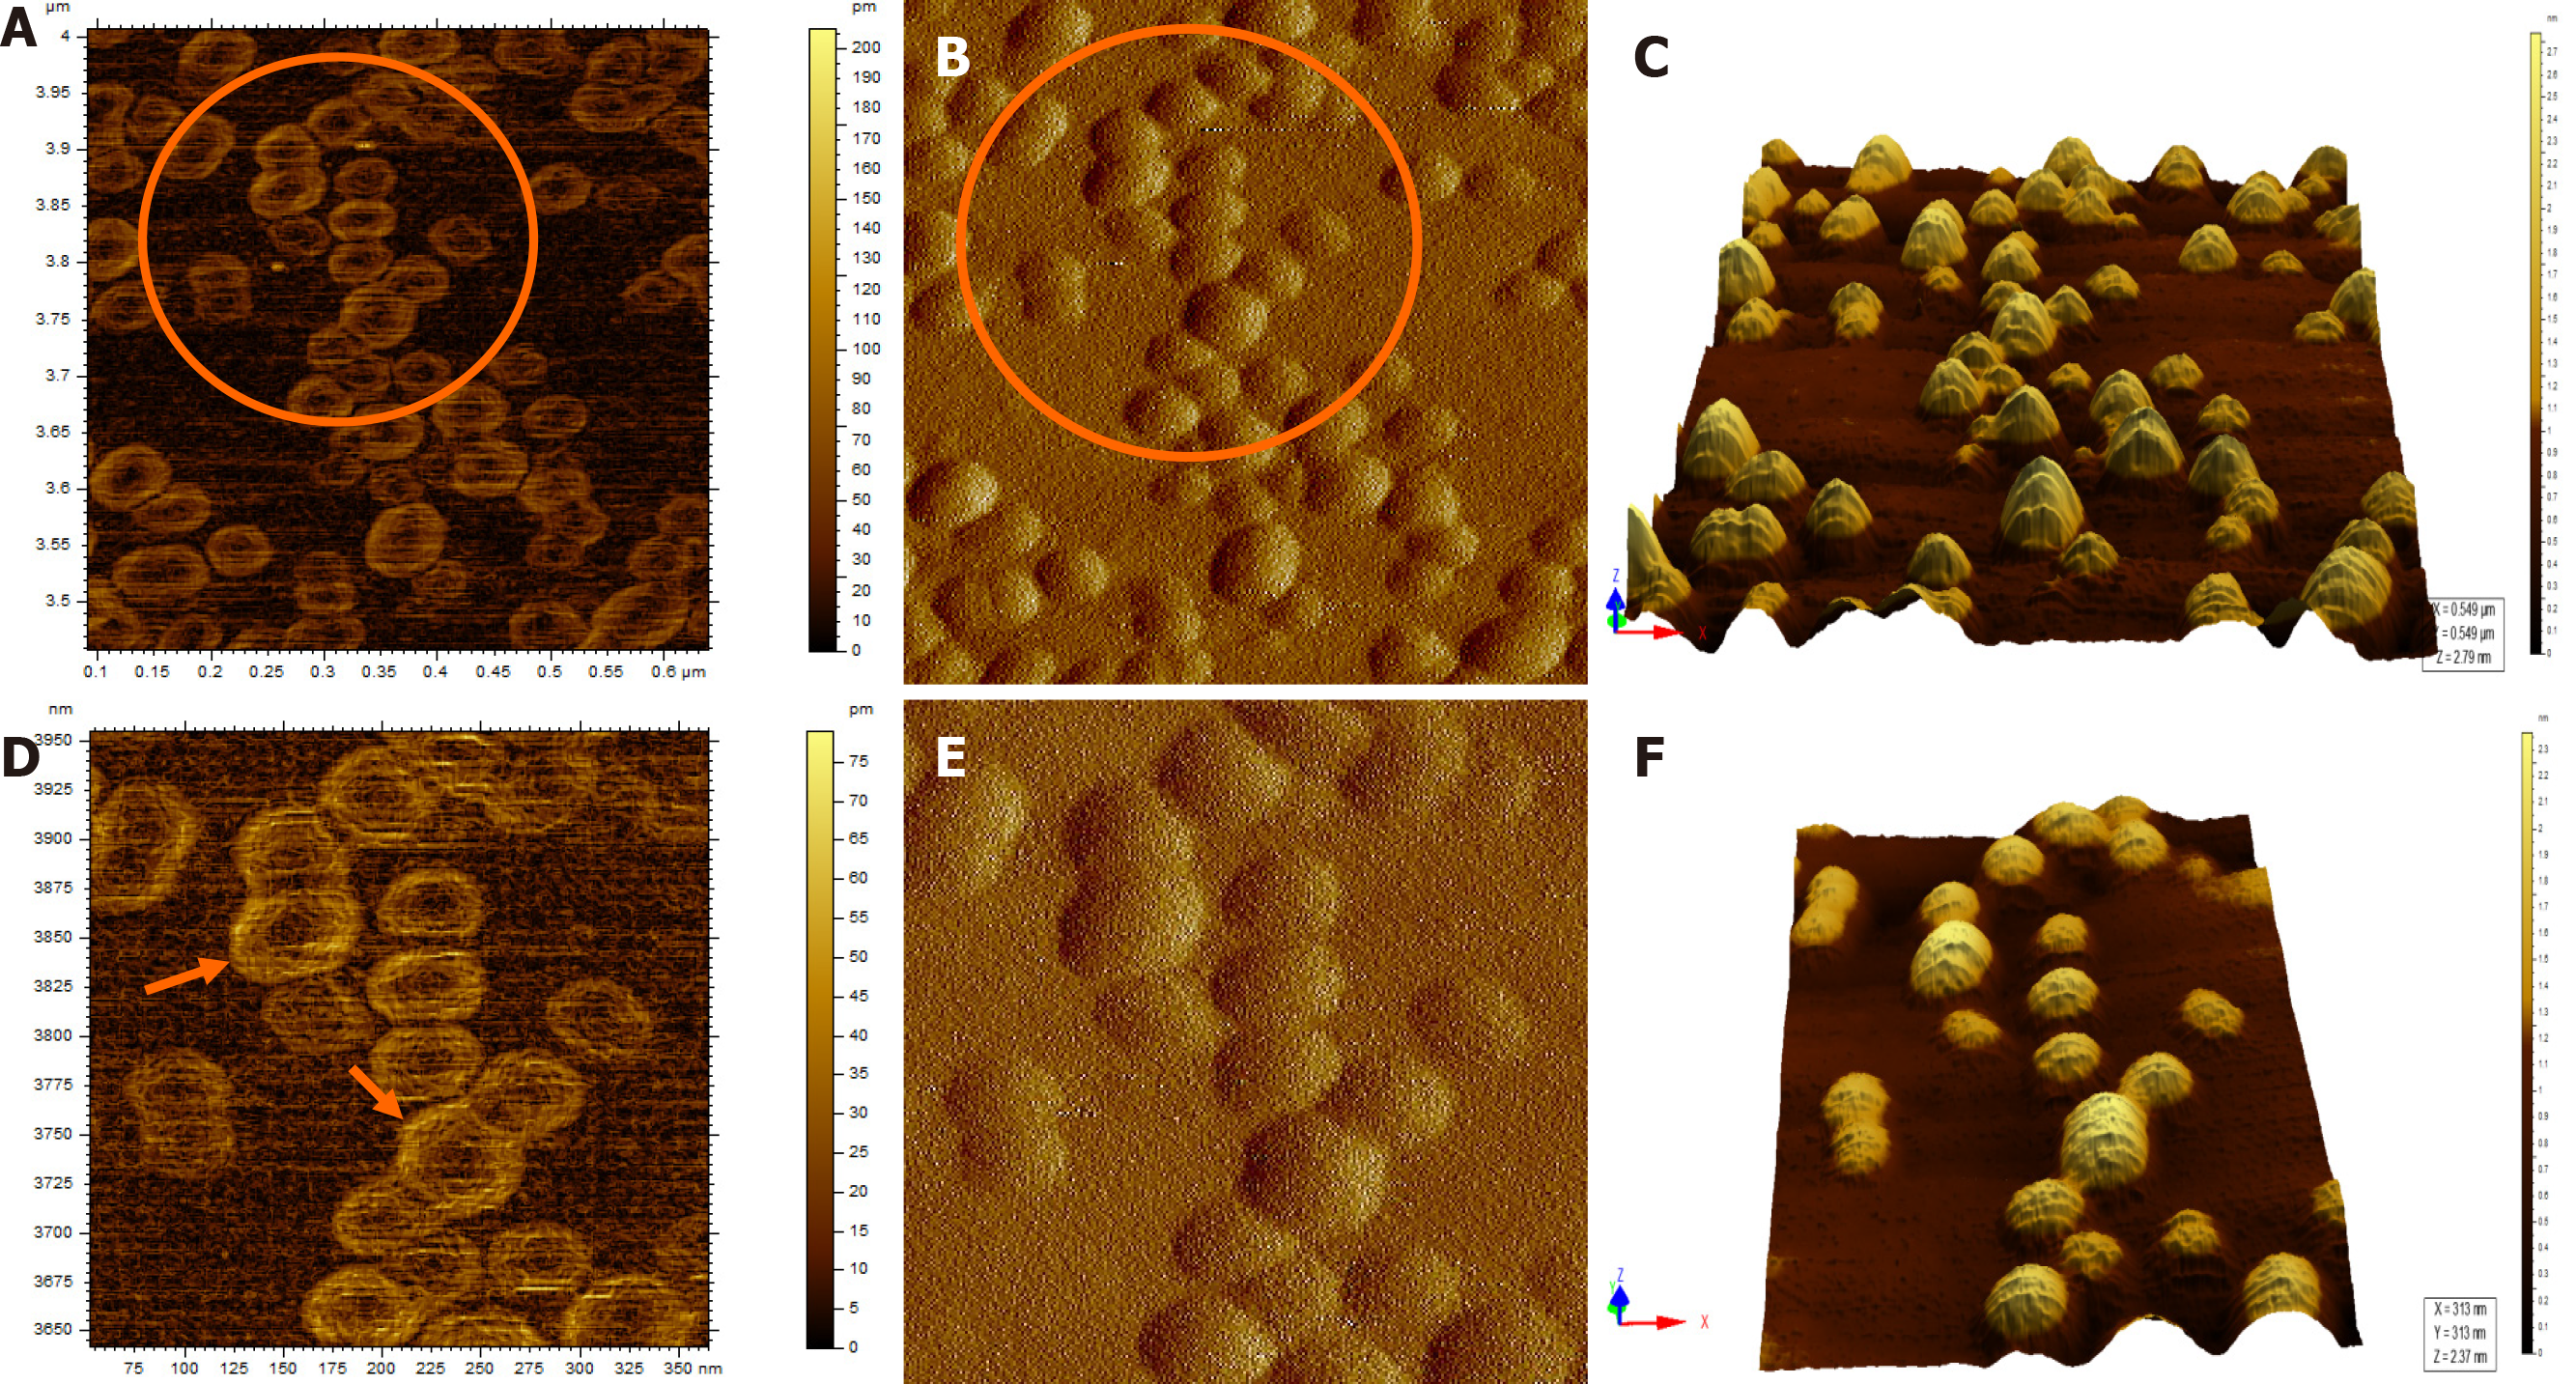
Figure 6 Atomic force microscopy images of sample S8 after immunoprecipitation and Triton X treatment.
A and B: Typical icosahedral particles, plausibly hepatitis B virus core particles. Triton X-100 treatment followed by sonication led to partial/complete disintegration of virus envelope, thus exposing the core particles; D and E: Magnified images of the region encircled in Figure 6A and B, respectively. The arrows mark the icosahedral hepatitis B virus core particles; C and F: 3D images of the hepatitis B virus core particles seen in Figure 6B and E, respectively.
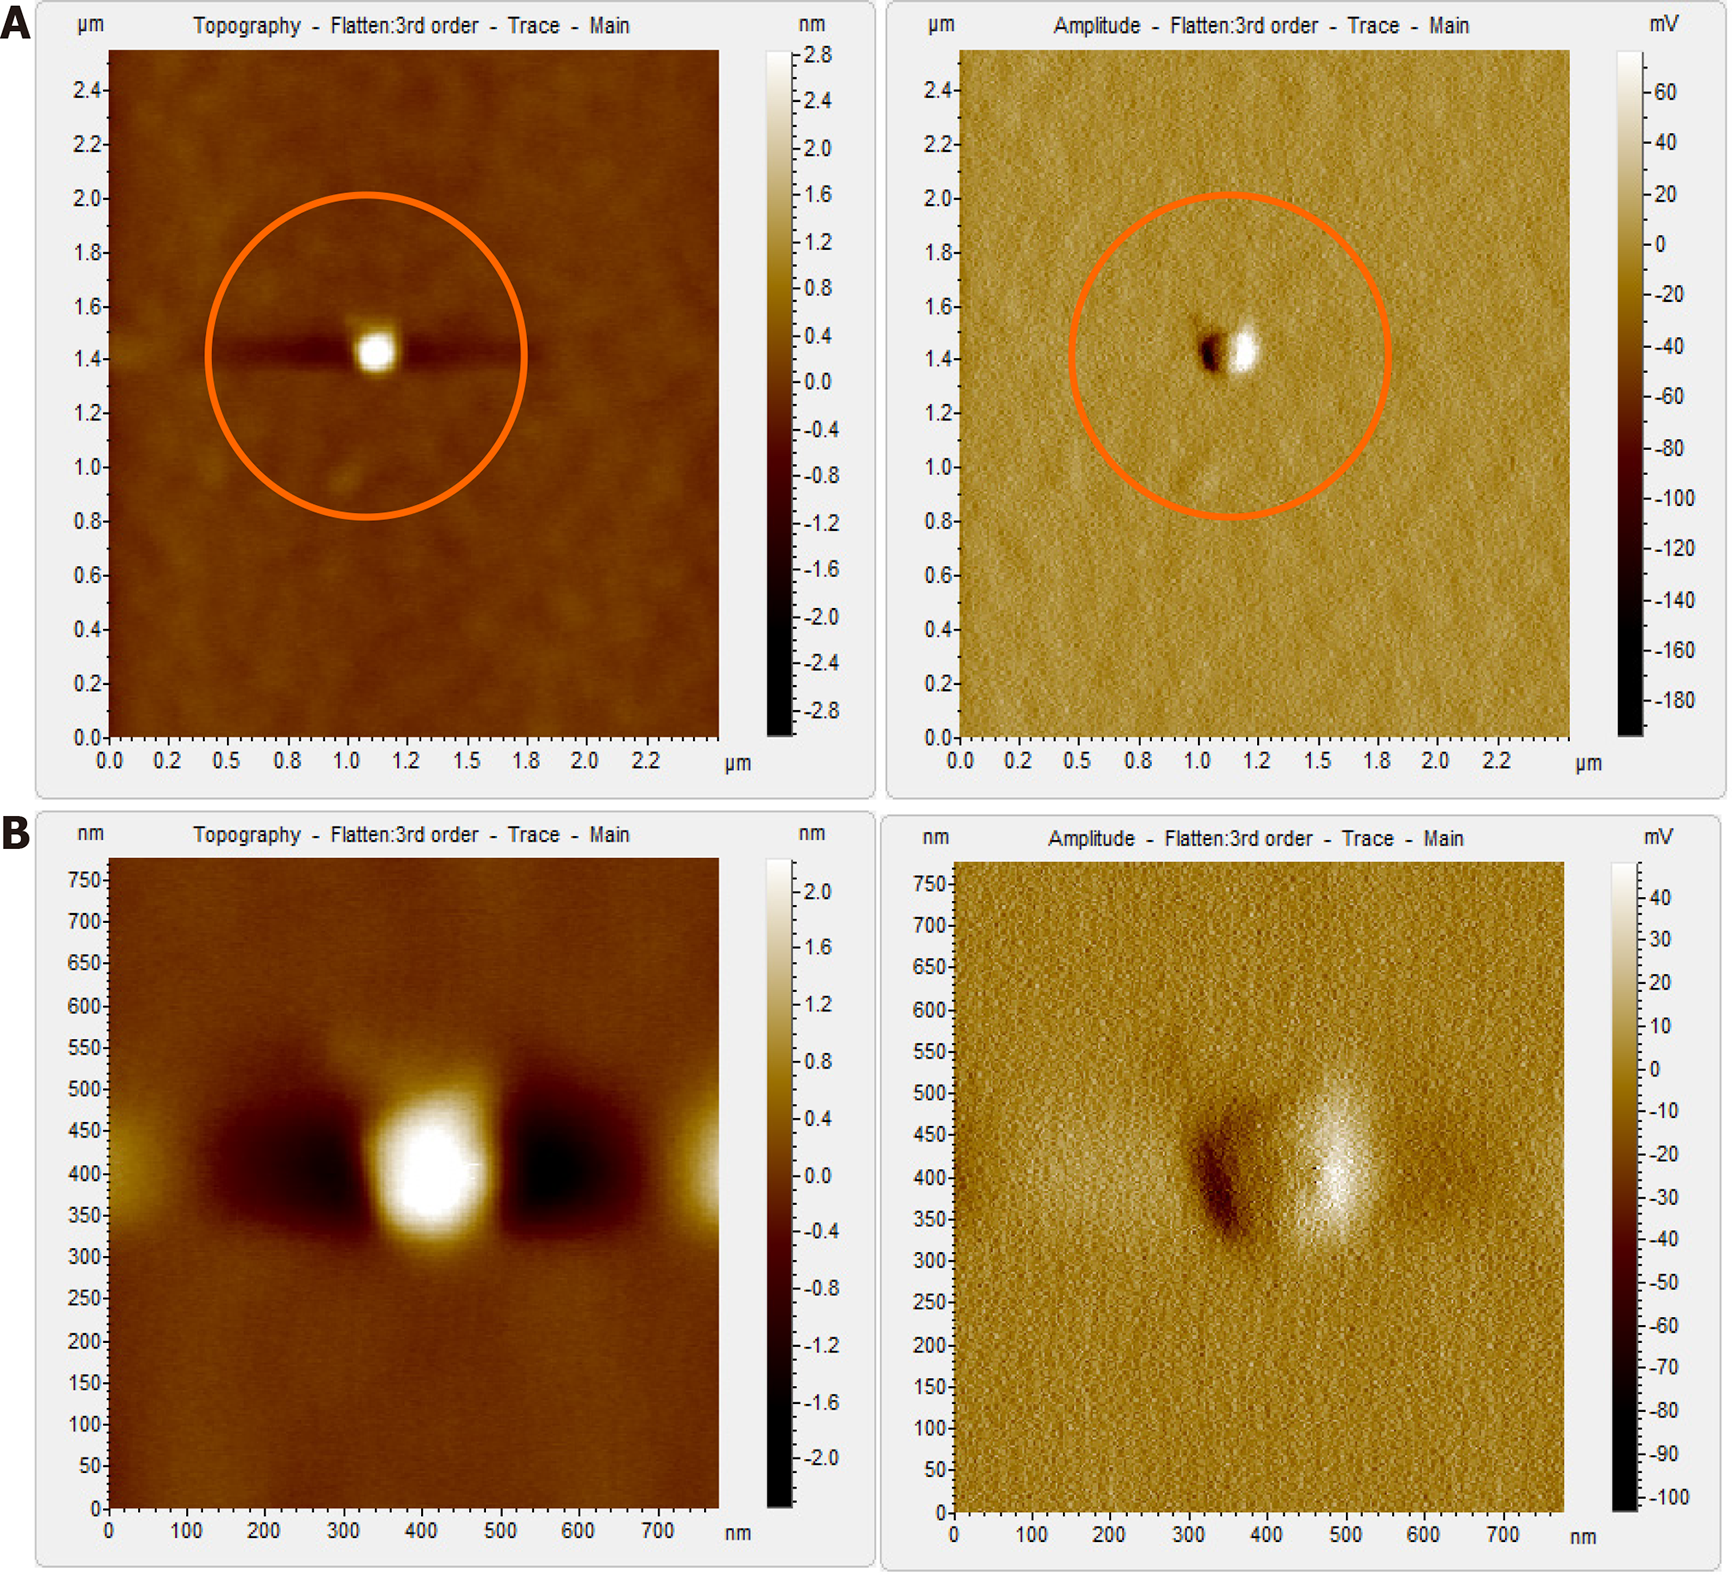
Figure 7 Atomic force microscopy images of hepatitis B virus-deoxyribonucleic acid negative sample, S12 after immunoprecipitation and Triton X treatment.
A: Clear field with no previously observed globular structures. Triton X treatment led to the disruption of clumps seen in Figure 5A and was removed during the washing steps; B: Magnified view of the encircled area in Figure 7A, which shows no hepatitis B virus-like particles even at higher magnification.
- Citation: Das P, Supekar R, Chatterjee R, Roy S, Ghosh A, Biswas S. Hepatitis B virus detected in paper currencies in a densely populated city of India: A plausible source of horizontal transmission? World J Hepatol 2020; 12(10): 775-791
- URL: https://www.wjgnet.com/1948-5182/full/v12/i10/775.htm
- DOI: https://dx.doi.org/10.4254/wjh.v12.i10.775


