Copyright
©The Author(s) 2019.
World J Hepatol. Jun 27, 2019; 11(6): 531-541
Published online Jun 27, 2019. doi: 10.4254/wjh.v11.i6.531
Published online Jun 27, 2019. doi: 10.4254/wjh.v11.i6.531
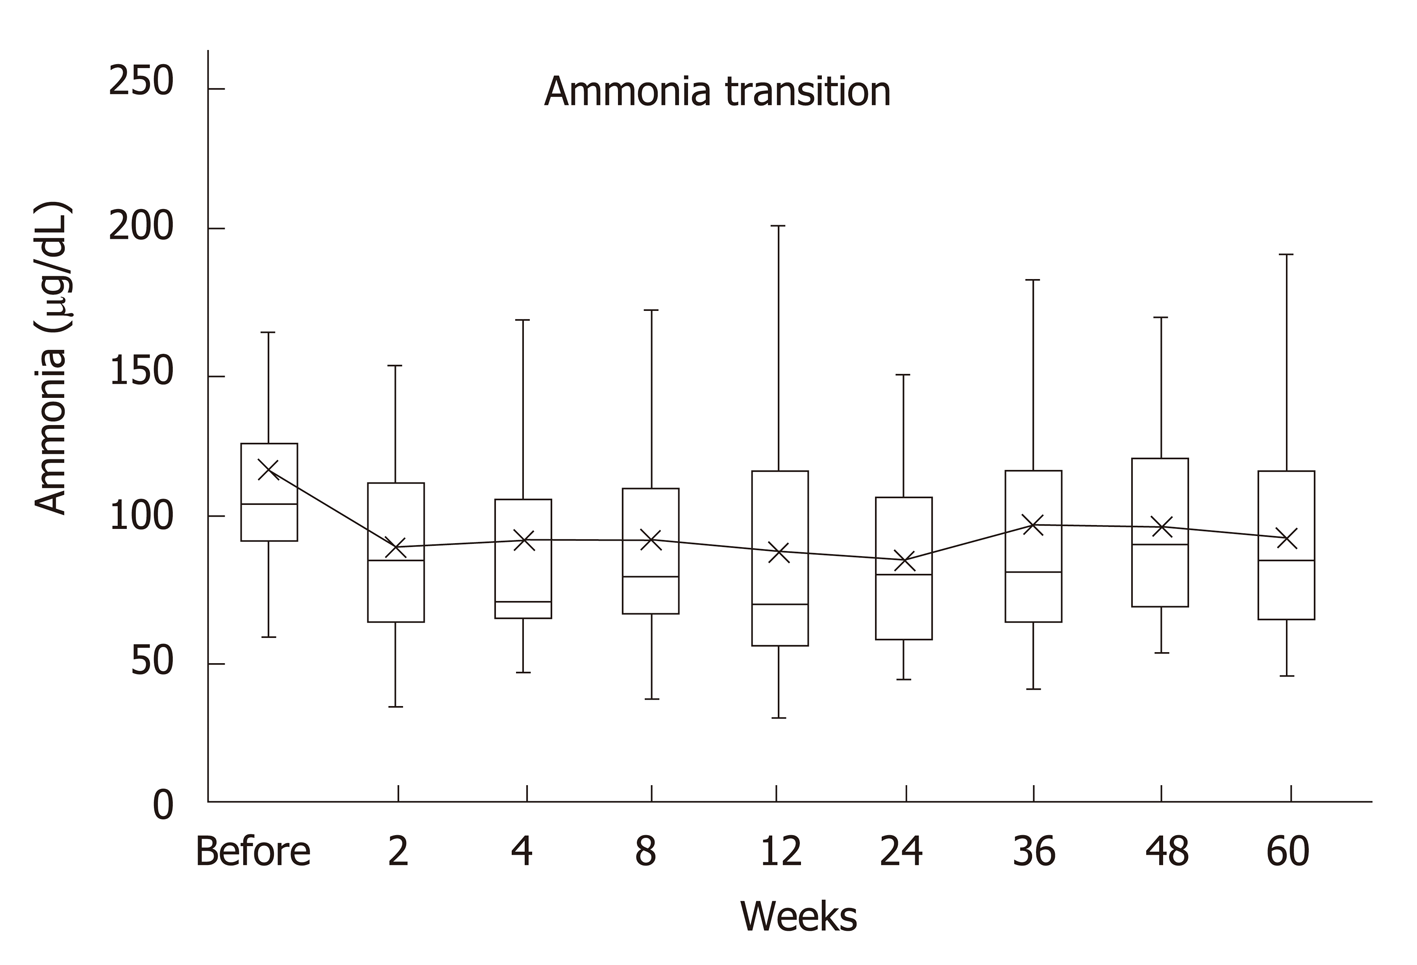
Figure 1 Serum ammonia levels.
Before rifaximin treatment, median of blood ammonia level was 104 μg/dL (range, 59-297 μg/dL), whereas two weeks after the treatment it decreased to 85 μg/dL (34-153), showing a significant difference (P = 0.002). The median values were 71 μg/ dL (47-341) after 4 wk, 79.5 μg/ dL (37-215) after 8 wk, 70 μg/ dL (31-221) after 12 wk, 80.5 μg/dL (44-150) after 24 wk, 81 μg/dL (20-298) after 36 wk, 91 μg/dL (53-169) after 48 wk, and eventually 85 μg/dL (45-192) after 60 wk. Decrease was noted at all the points after the start of the treatment when compared with the ones before it.
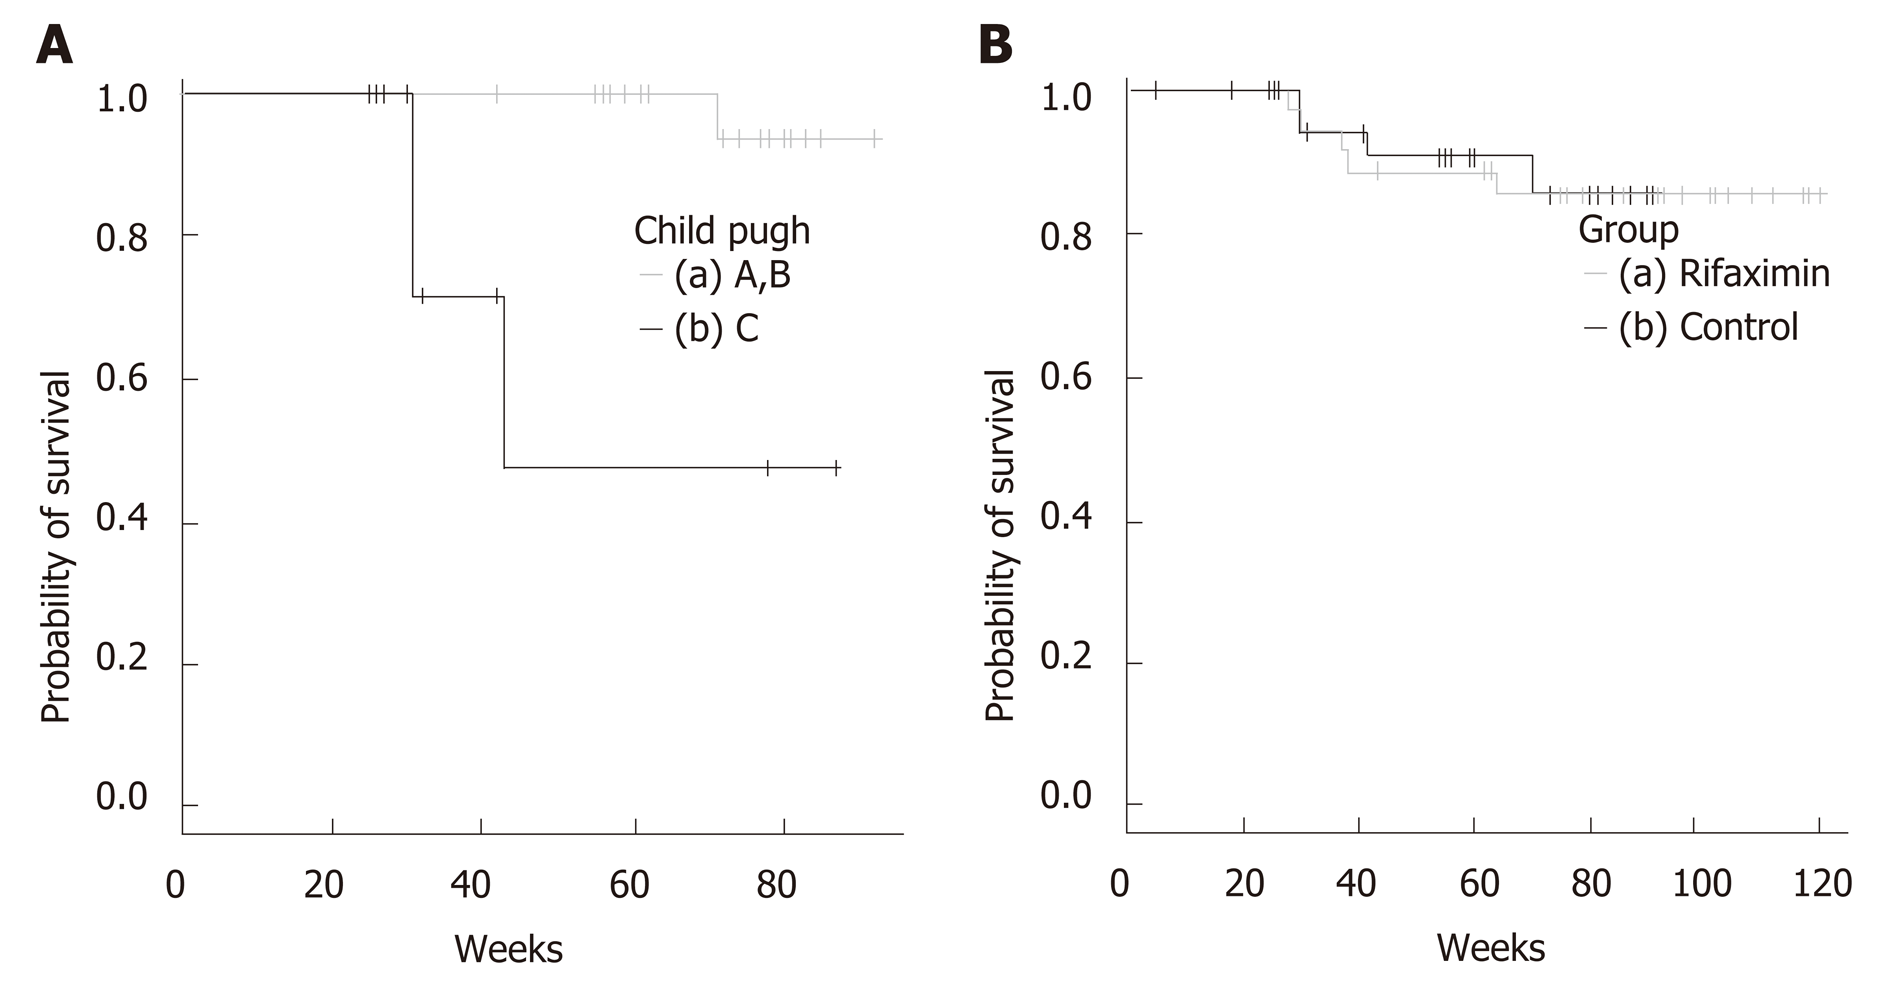
Figure 2 Kaplan-Meir survival curves.
A: Results from log-rank test showed significant differences in Child-Pugh A and B vs Child-Pugh C. a: Survival data of patients with Child-Pugh A and B (n = 30), b: Survival data of patients with Child-Pugh C (n = 8). Median survival time was 43 wk; B: Results from log-rank test showed no significant differences of rifaximin group vs control group. a: Survival data of rifaximin group (n = 38), b: Survival data of control group (n = 34).
- Citation: Nishida S, Hamada K, Nishino N, Fukushima D, Koyanagi R, Horikawa Y, Shiwa Y, Saitoh S. Efficacy of long-term rifaximin treatment for hepatic encephalopathy in the Japanese. World J Hepatol 2019; 11(6): 531-541
- URL: https://www.wjgnet.com/1948-5182/full/v11/i6/531.htm
- DOI: https://dx.doi.org/10.4254/wjh.v11.i6.531


