Copyright
©The Author(s) 2019.
World J Hepatol. May 27, 2019; 11(5): 464-476
Published online May 27, 2019. doi: 10.4254/wjh.v11.i5.464
Published online May 27, 2019. doi: 10.4254/wjh.v11.i5.464
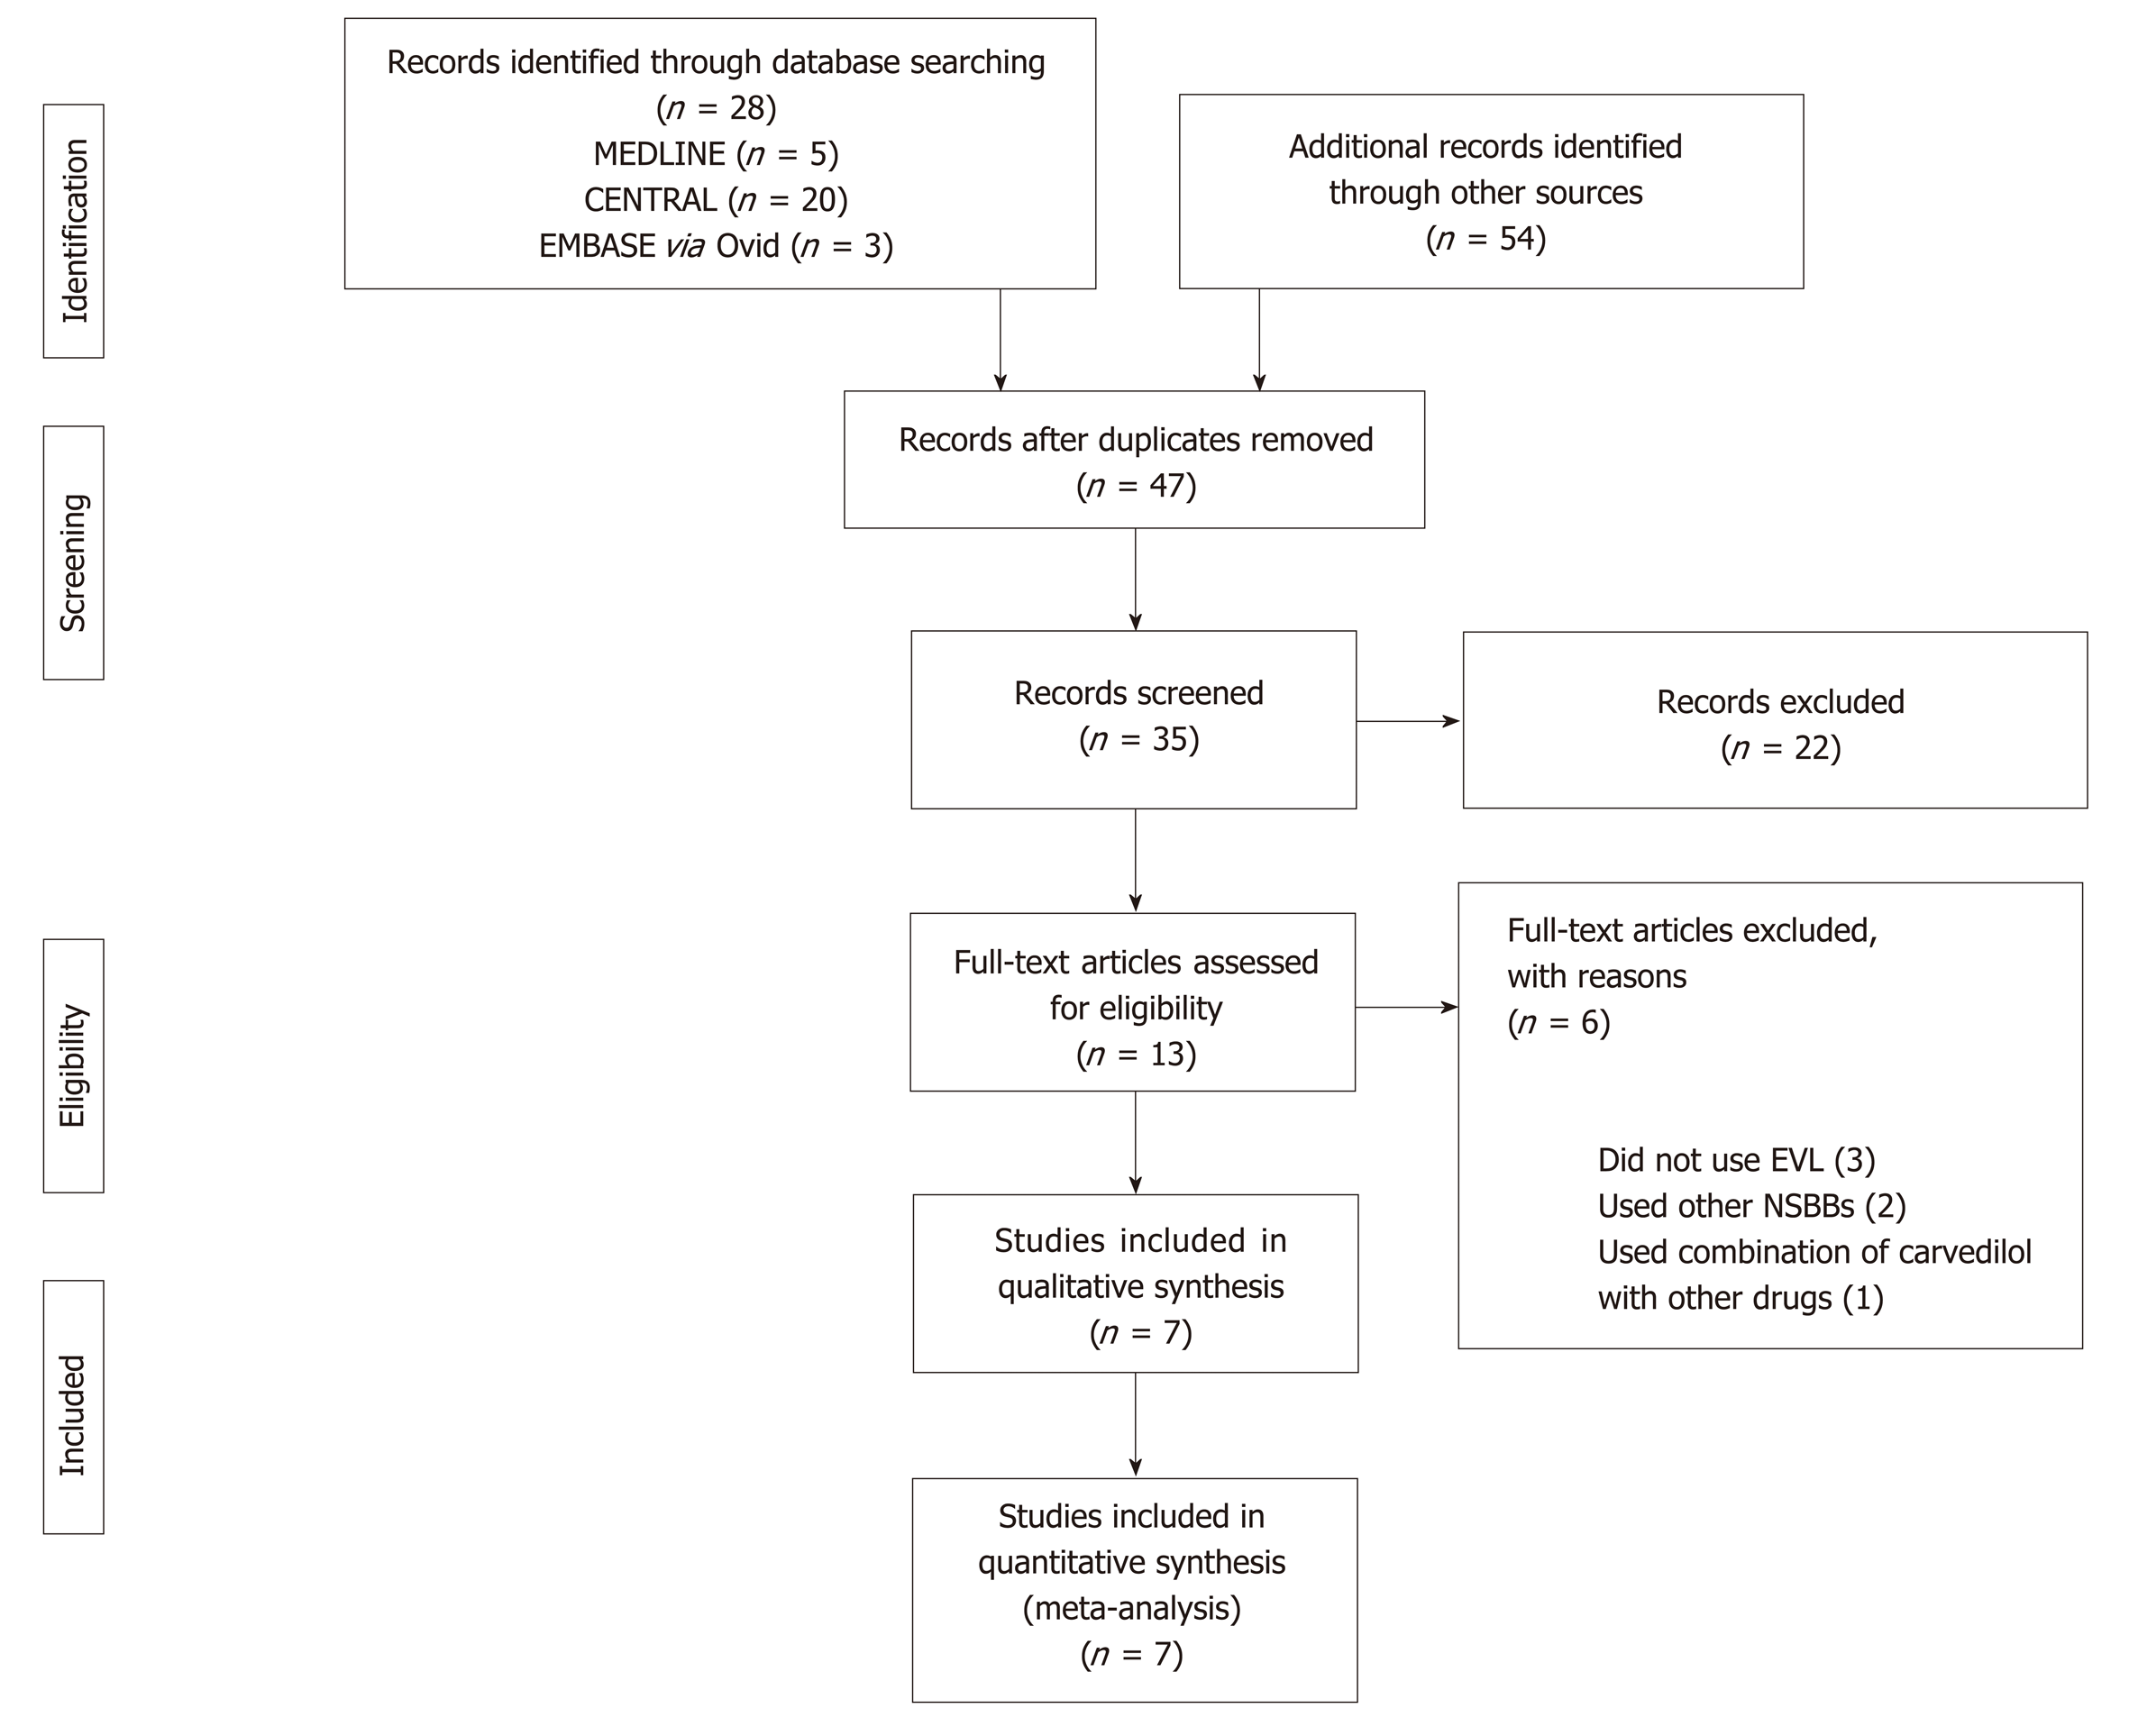
Figure 1 The results of the literature search process used in the current study, depicted using a Preferred Reporting Items for Systematic Reviews and Meta-Analyses flow diagram.
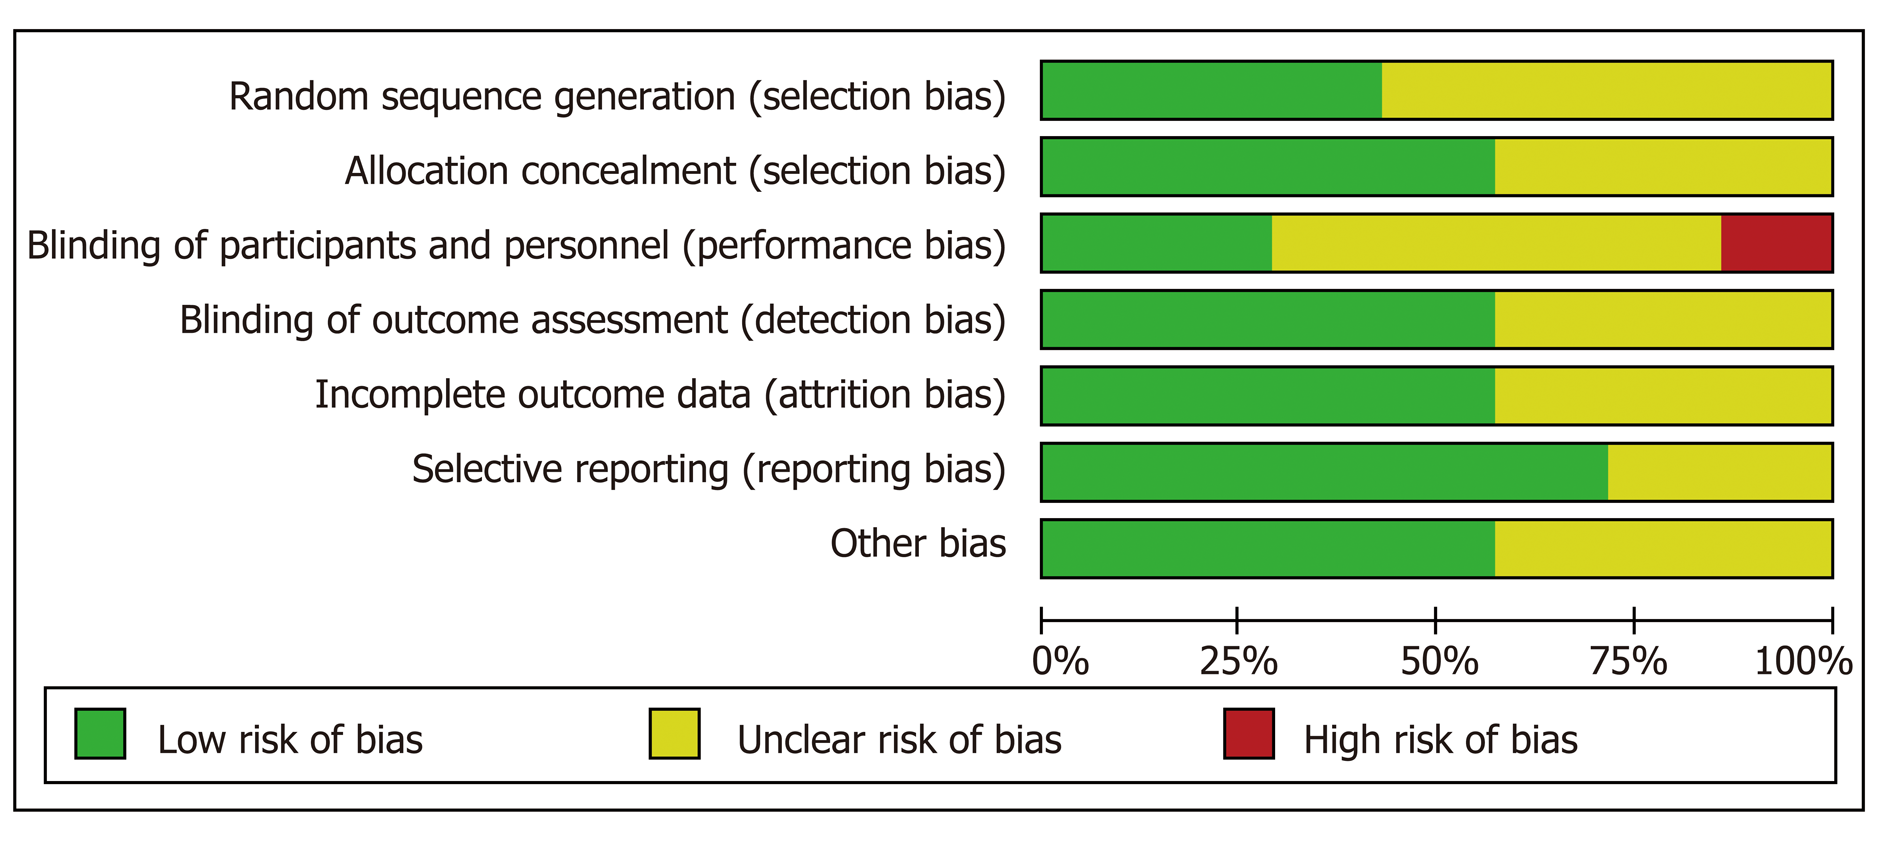
Figure 2 A risk of bias graph showing the researchers’ opinions on each risk of bias item (presented as percentages across all the seven included studies).
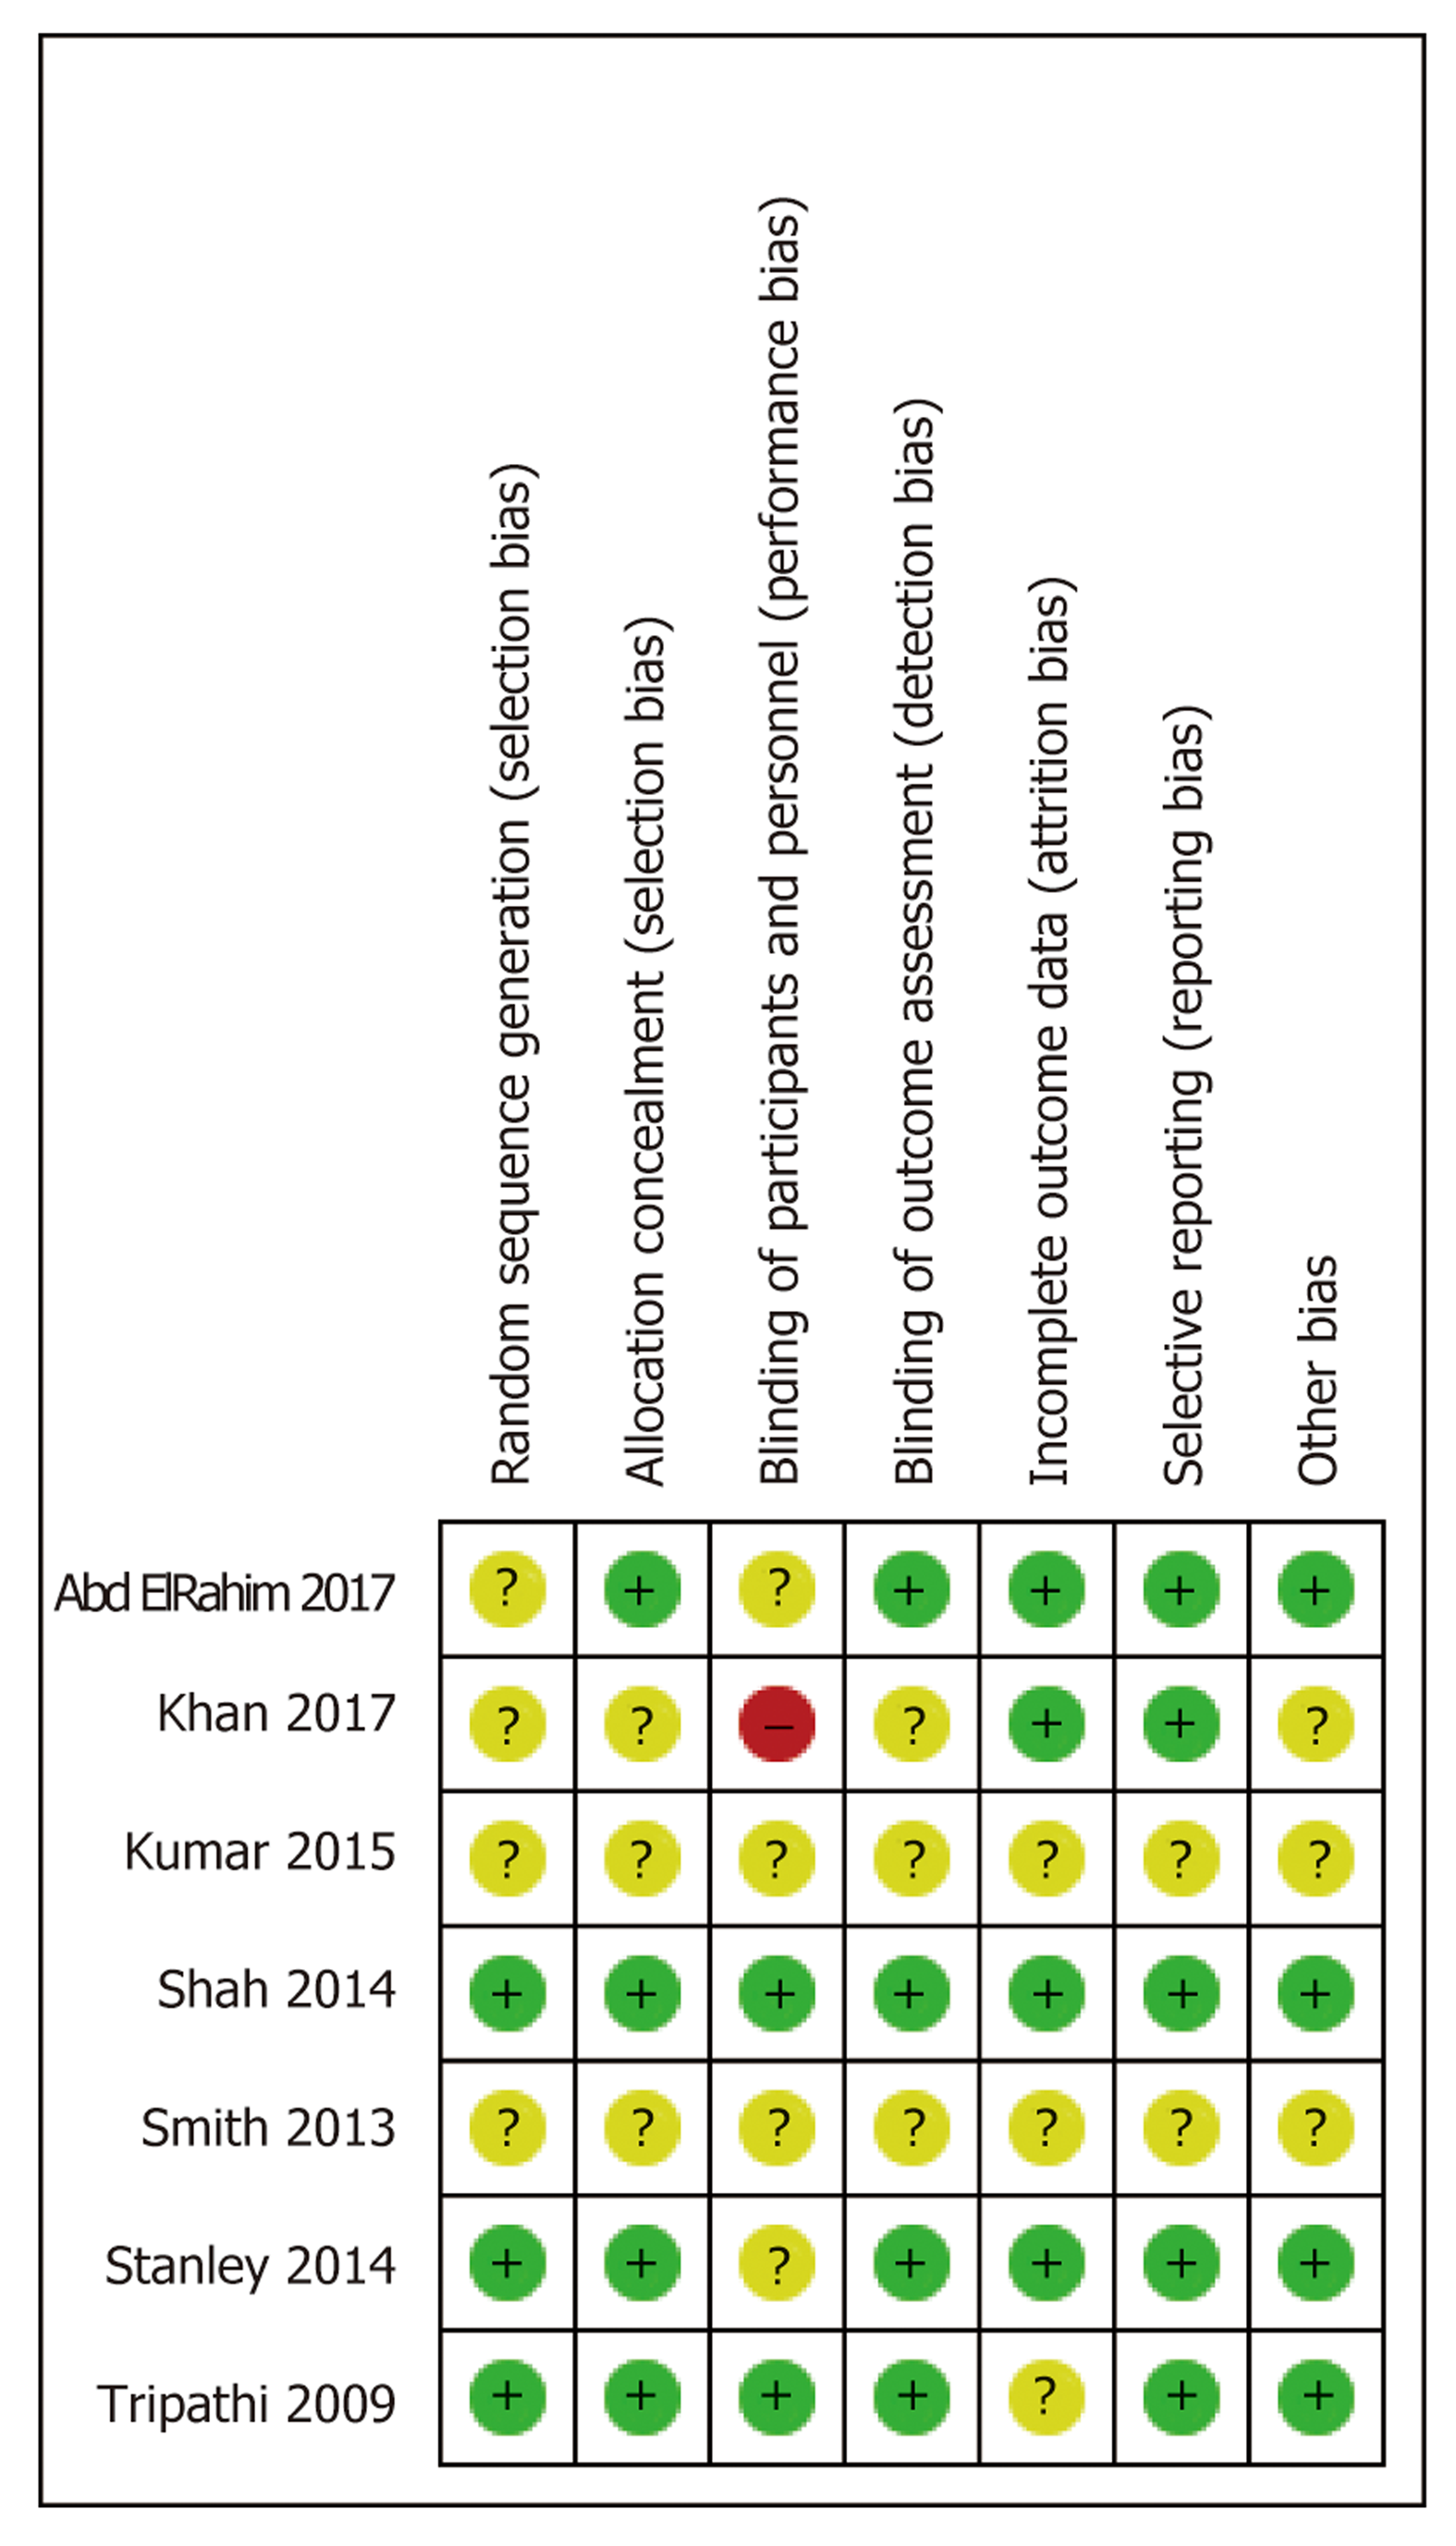
Figure 3 A risk of bias summary showing the researchers’ opinions on each risk of bias item for each of the seven included studies.
Figure 4 Meta-analysis forest plot of primary outcomes in primary prevention studies.
A: Variceal bleeding; B: All-cause mortality; C: Bleeding-related mortality.
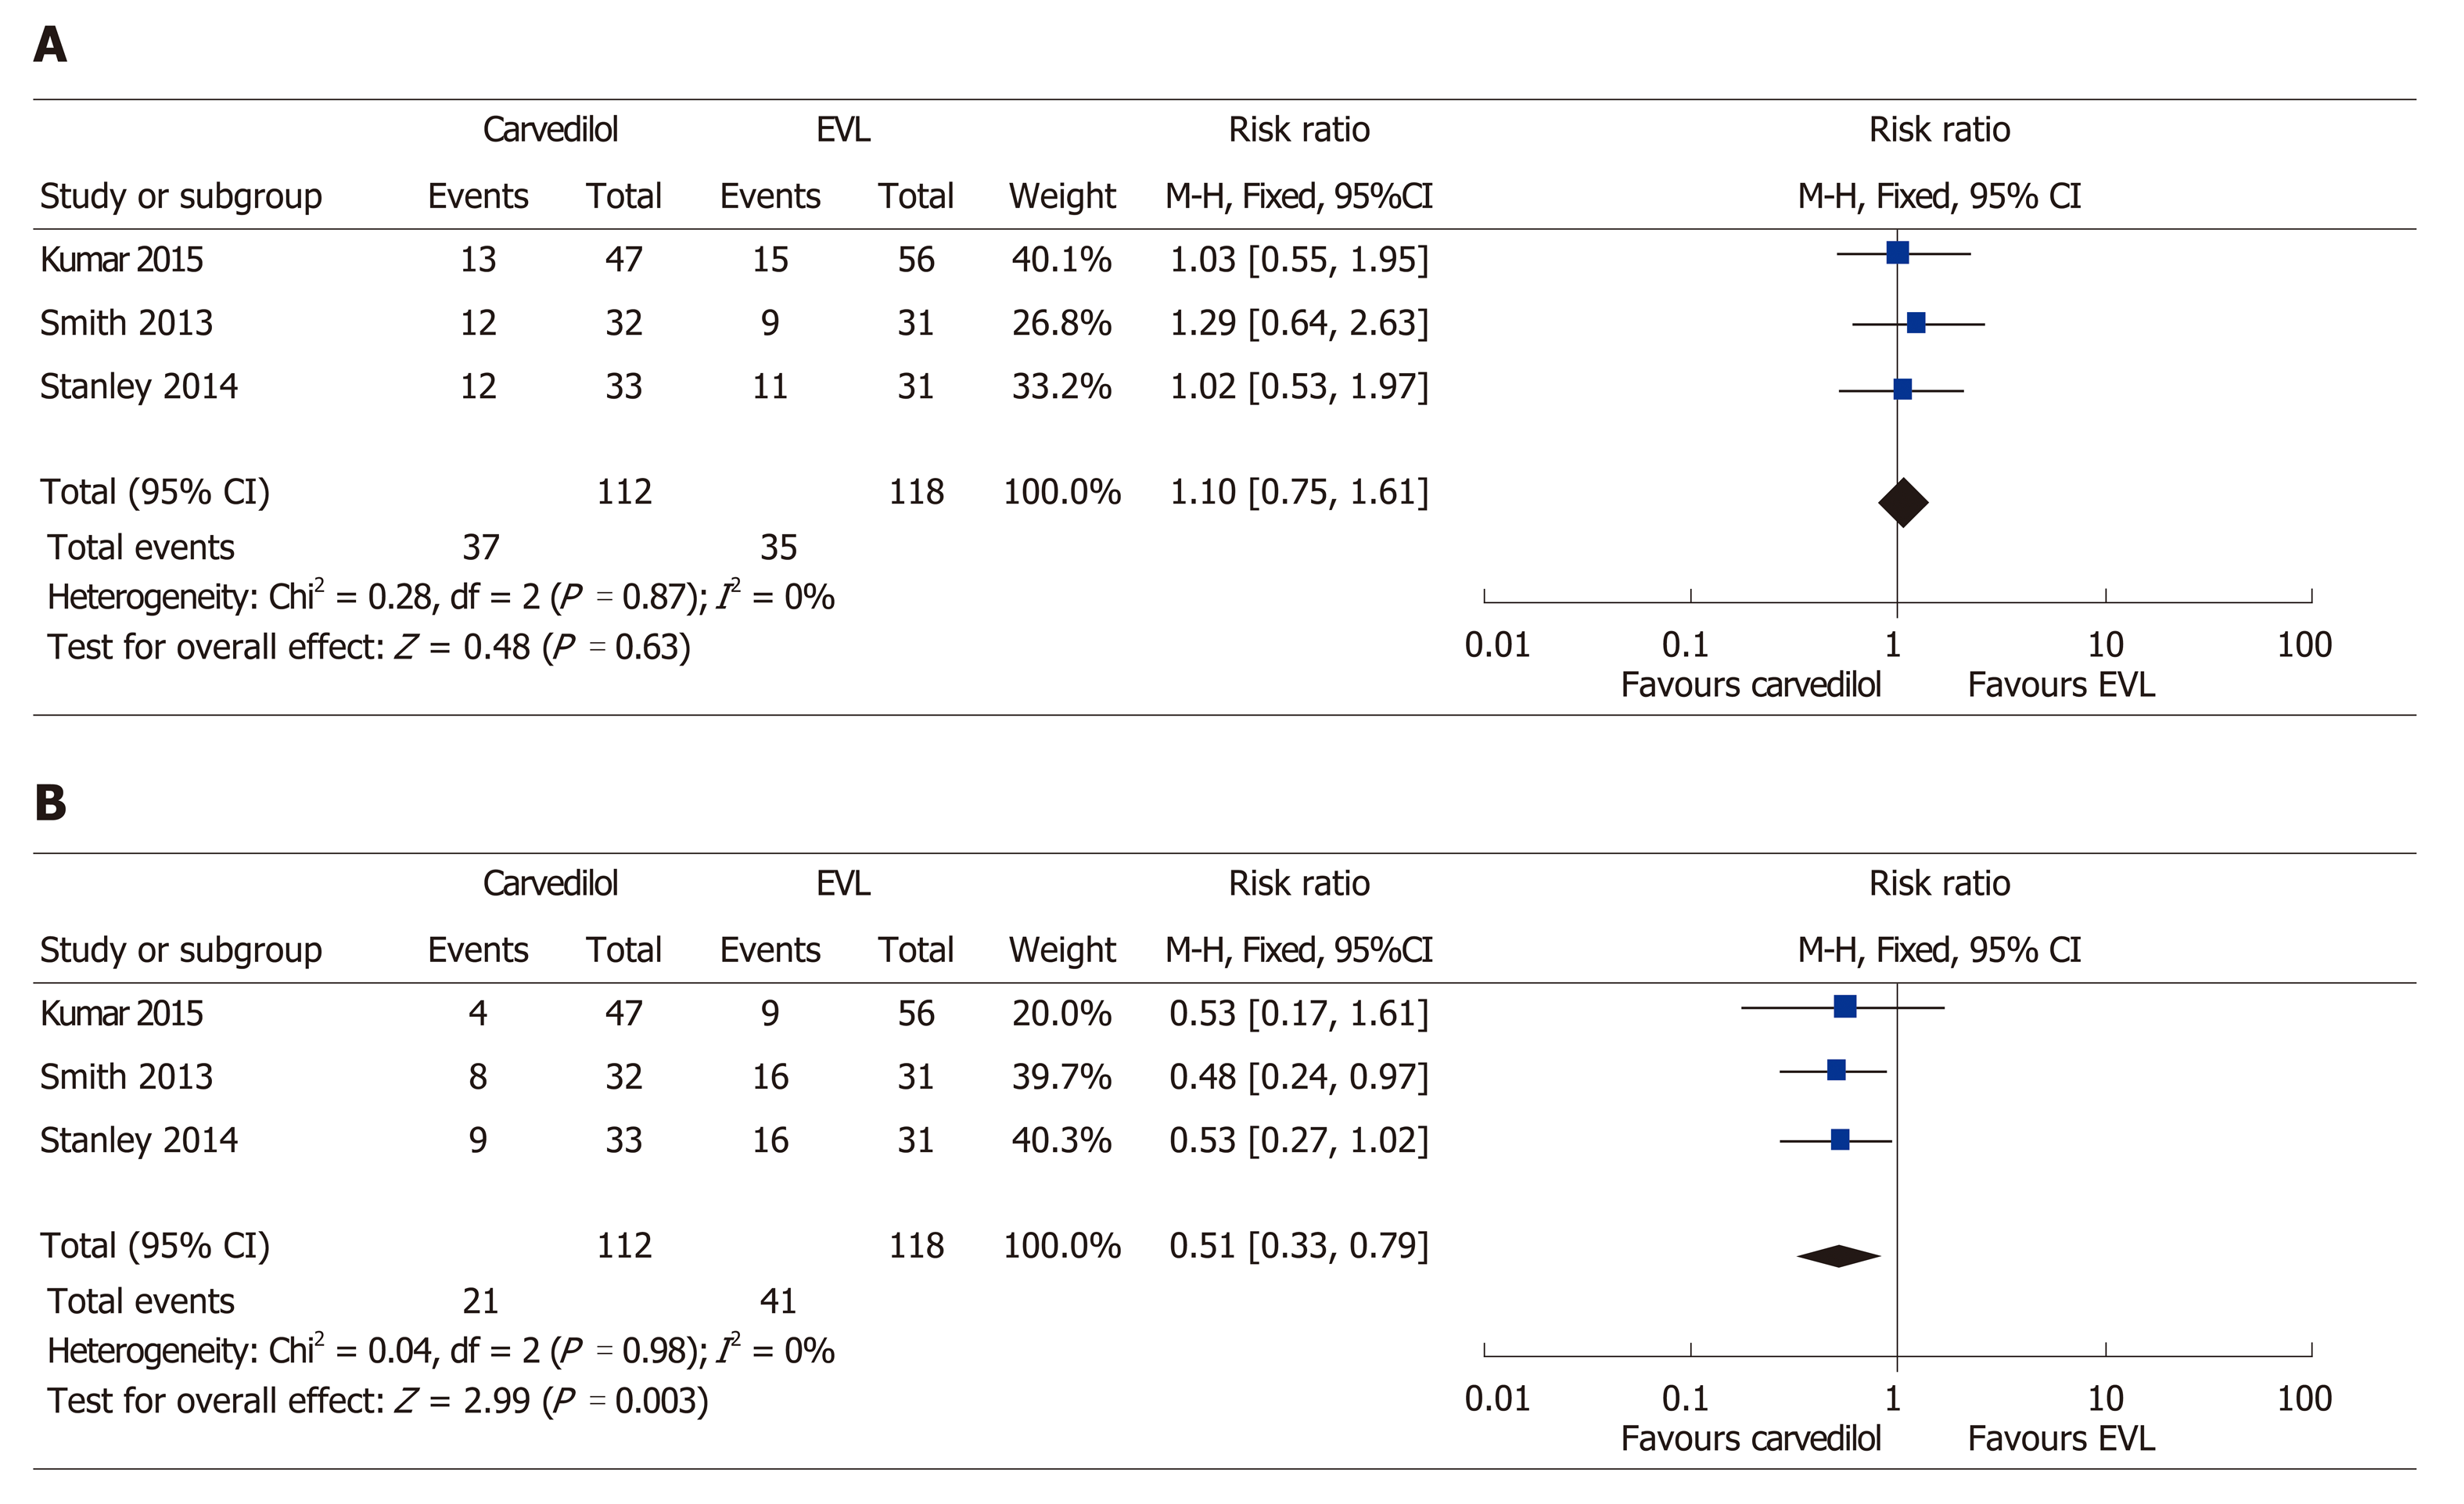
Figure 5 Meta-analysis forest plot of secondary outcomes in primary prevention studies.
A: Side-effects of treatment; B: Compliance.
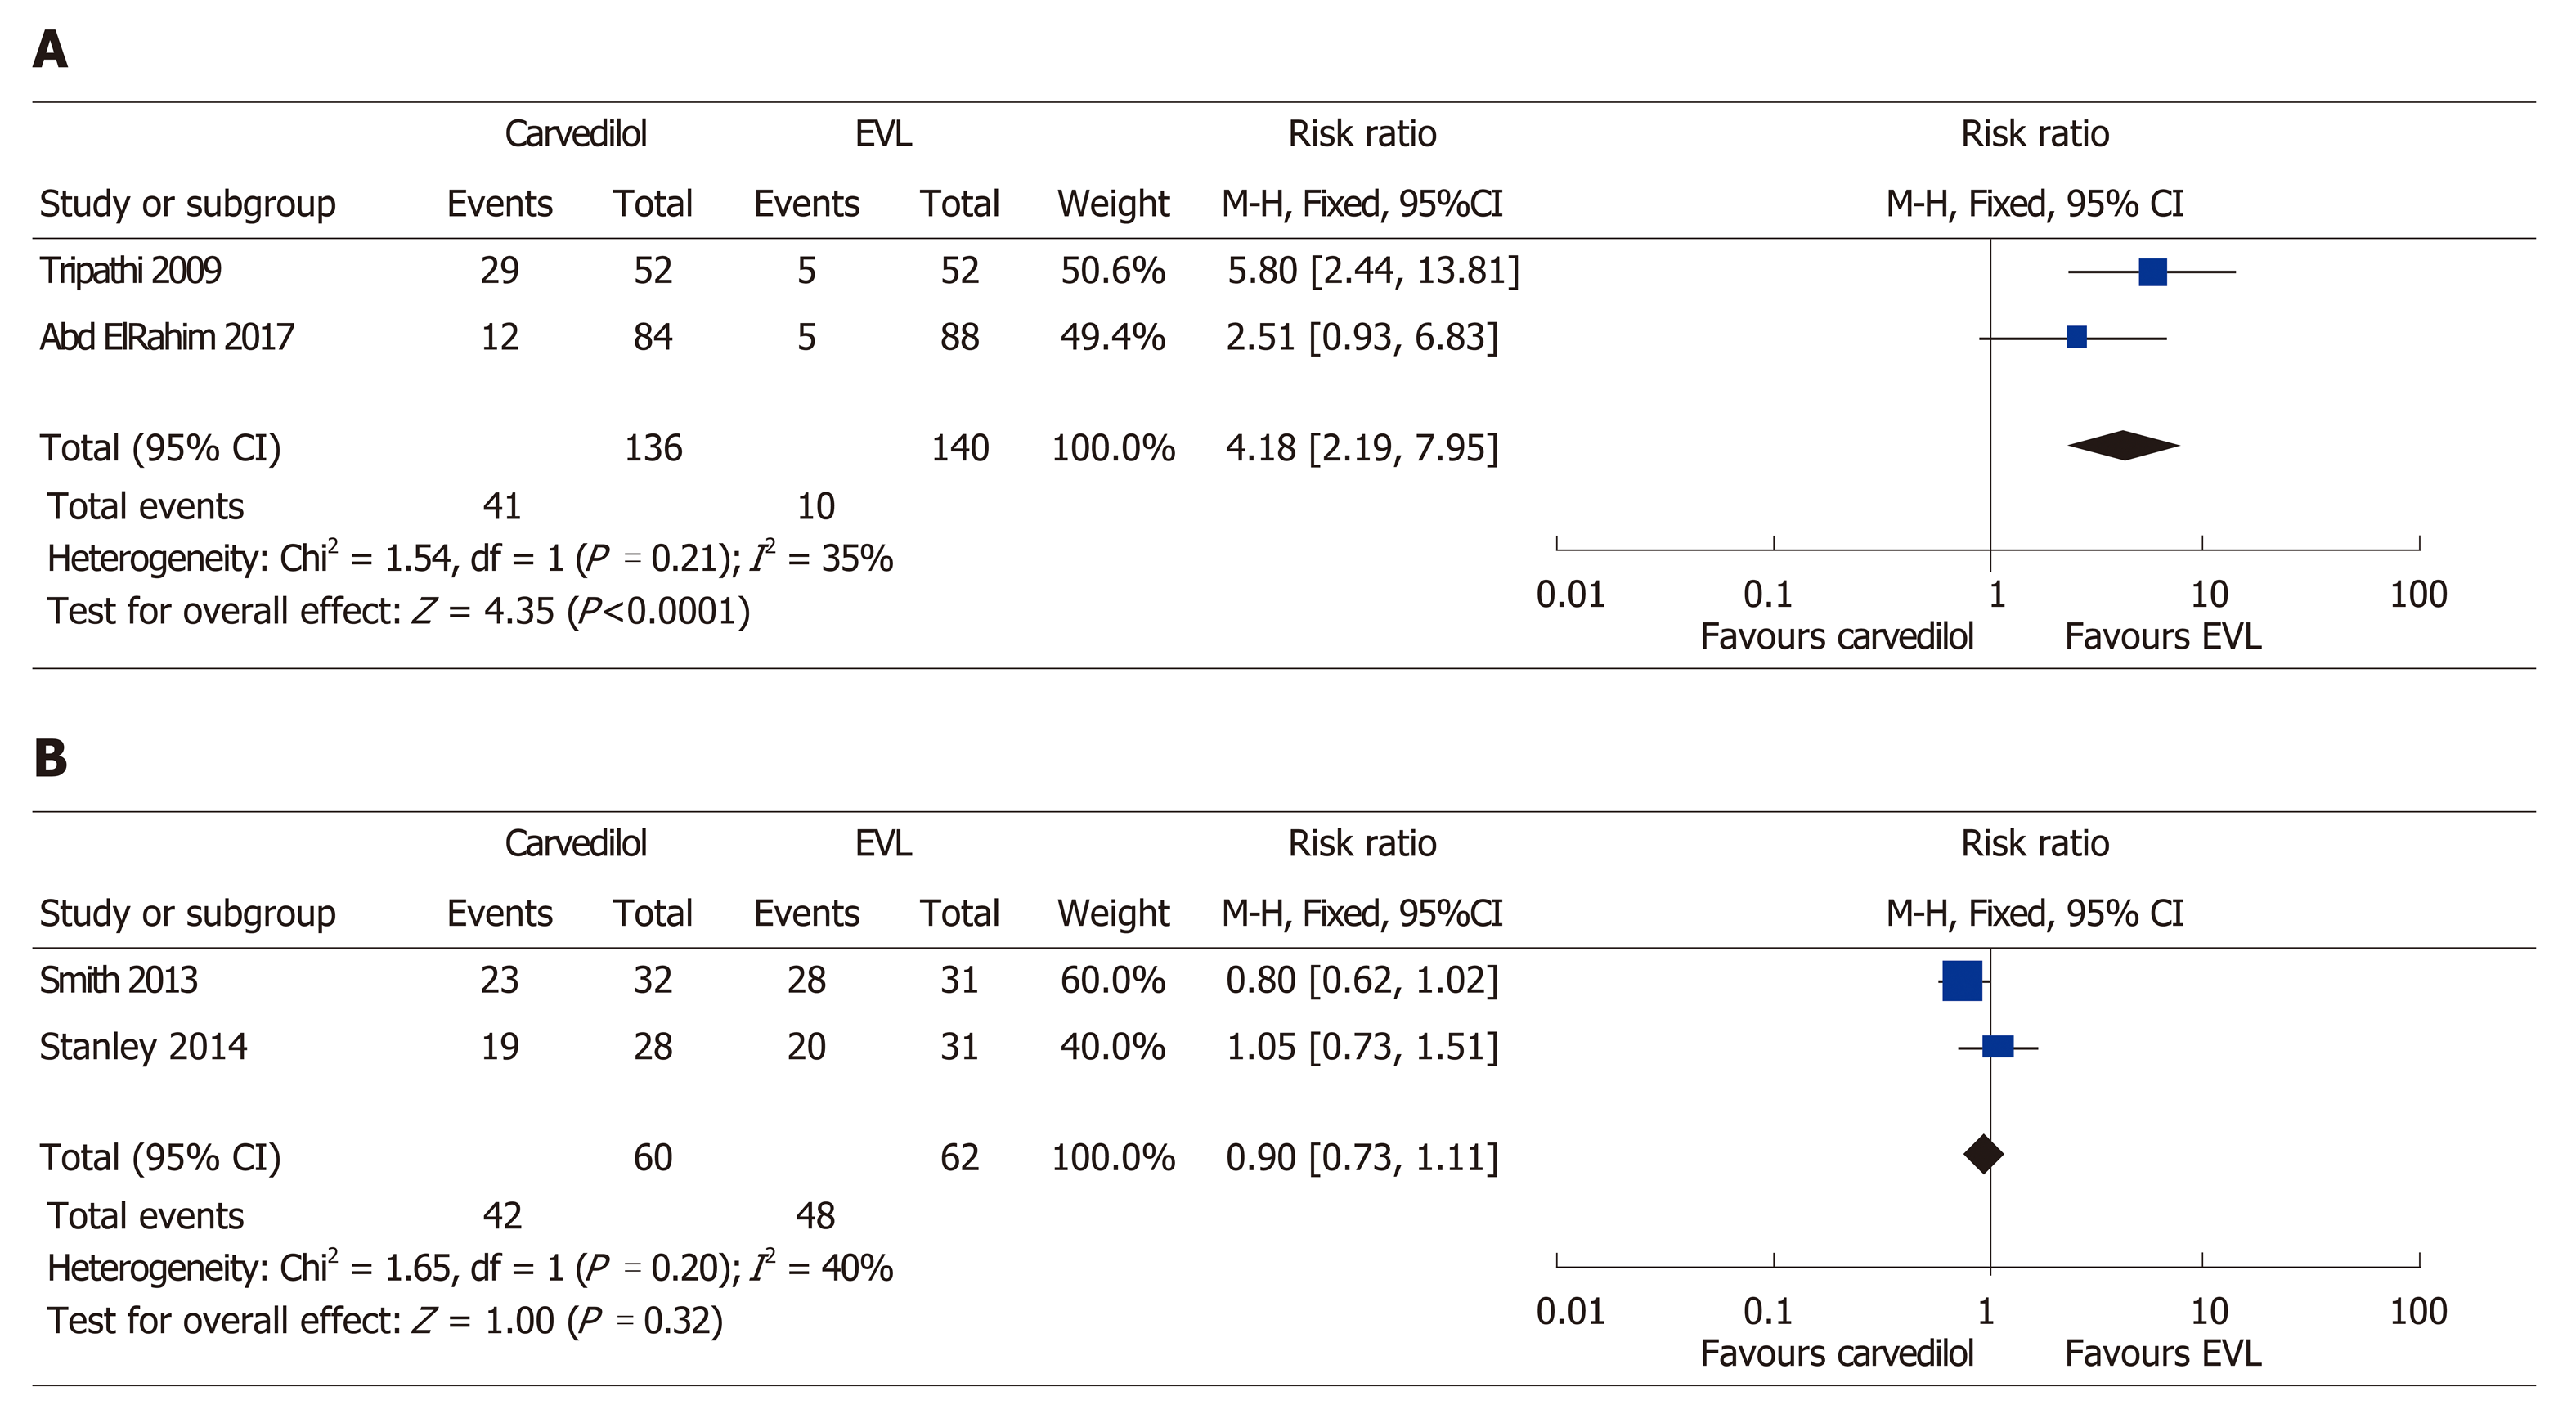
Figure 6 Meta-analysis forest plot of primary outcomes in secondary prevention studies.
A: Variceal rebleeding; B: All-cause mortality.
- Citation: Dwinata M, Putera DD, Adda’i MF, Hidayat PN, Hasan I. Carvedilol vs endoscopic variceal ligation for primary and secondary prevention of variceal bleeding: Systematic review and meta-analysis. World J Hepatol 2019; 11(5): 464-476
- URL: https://www.wjgnet.com/1948-5182/full/v11/i5/464.htm
- DOI: https://dx.doi.org/10.4254/wjh.v11.i5.464


