Copyright
©The Author(s) 2018.
World J Hepatol. Jul 27, 2018; 10(7): 462-473
Published online Jul 27, 2018. doi: 10.4254/wjh.v10.i7.462
Published online Jul 27, 2018. doi: 10.4254/wjh.v10.i7.462
Figure 1 Schematic representation showing pre-contrast magnetic resonance imaging features of cirrhotic nodules such as siderotic (iron reach), glicogen rich and fatty nodule.
T1 IP: T1-weighted in-phase image; T1 OP: T1-weighted out-of-phase image.
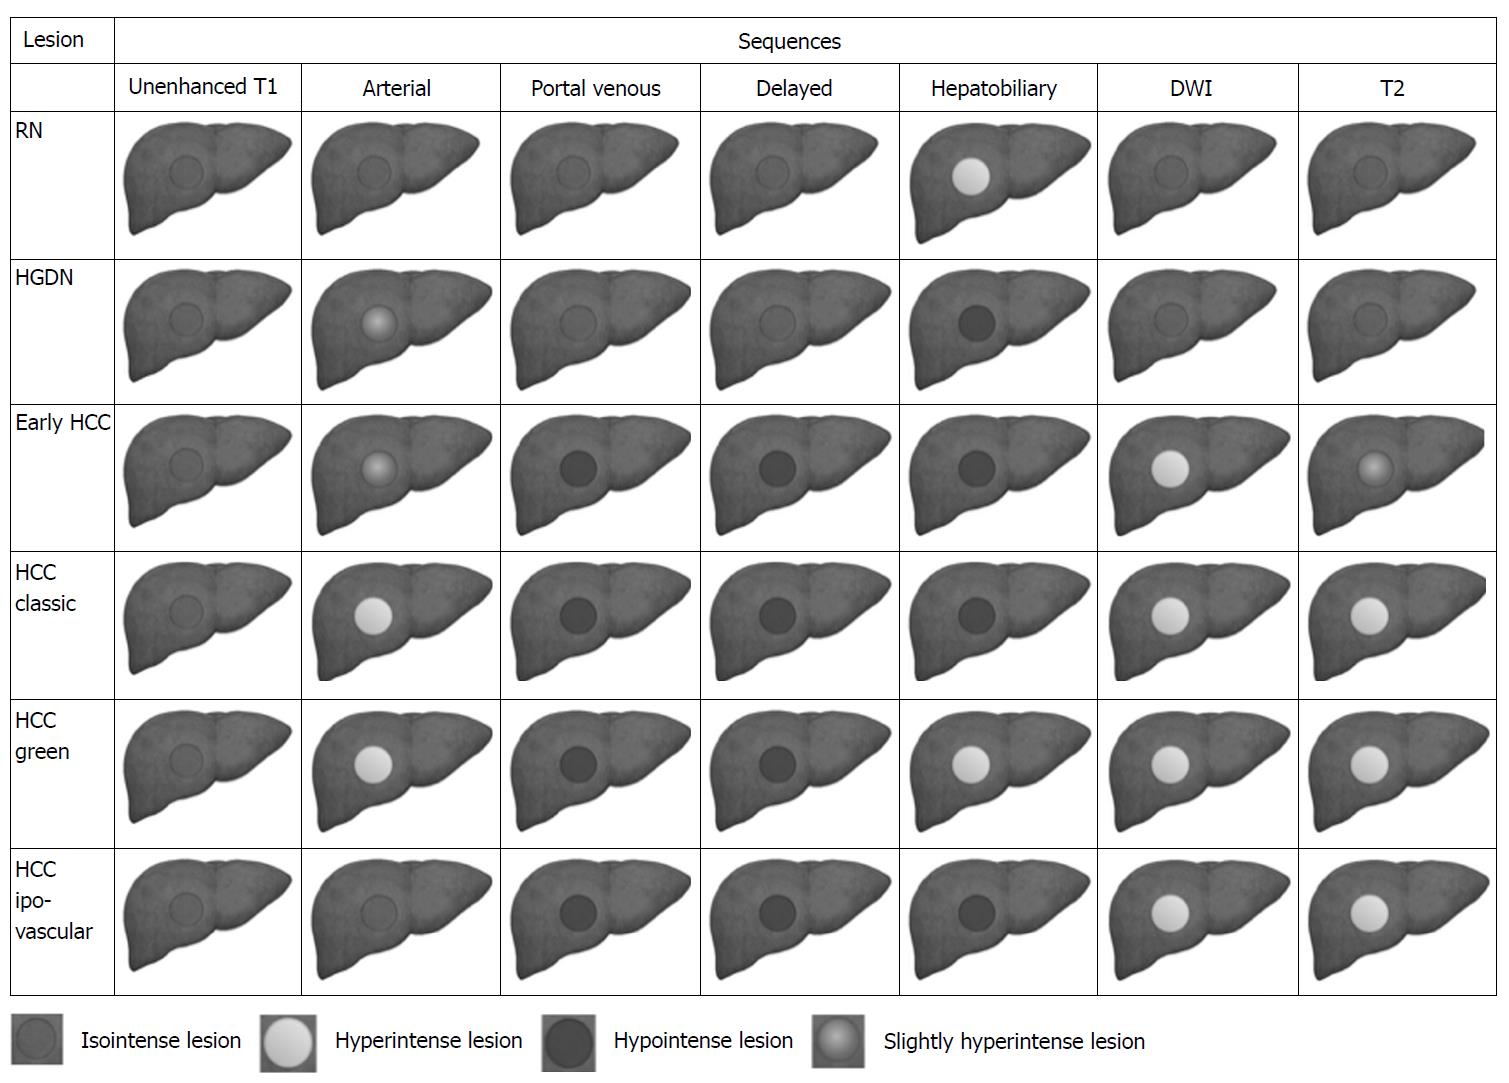
Figure 2 Schematic representation showing dynamic, diffusion weighted images and T2-weighted features, of regenerative nodules, high-grade dysplastic nodule, early hepatocellular carcinoma, classic hepatocellular carcinoma, green hepatocellular carcinoma and hypovascular hepatocellular carcinoma.
DWI: Diffusion weighted images; HGDN: High-grade dysplastic nodule; RN: Regenerative nodule; HCC: Hepatocellular carcinoma.
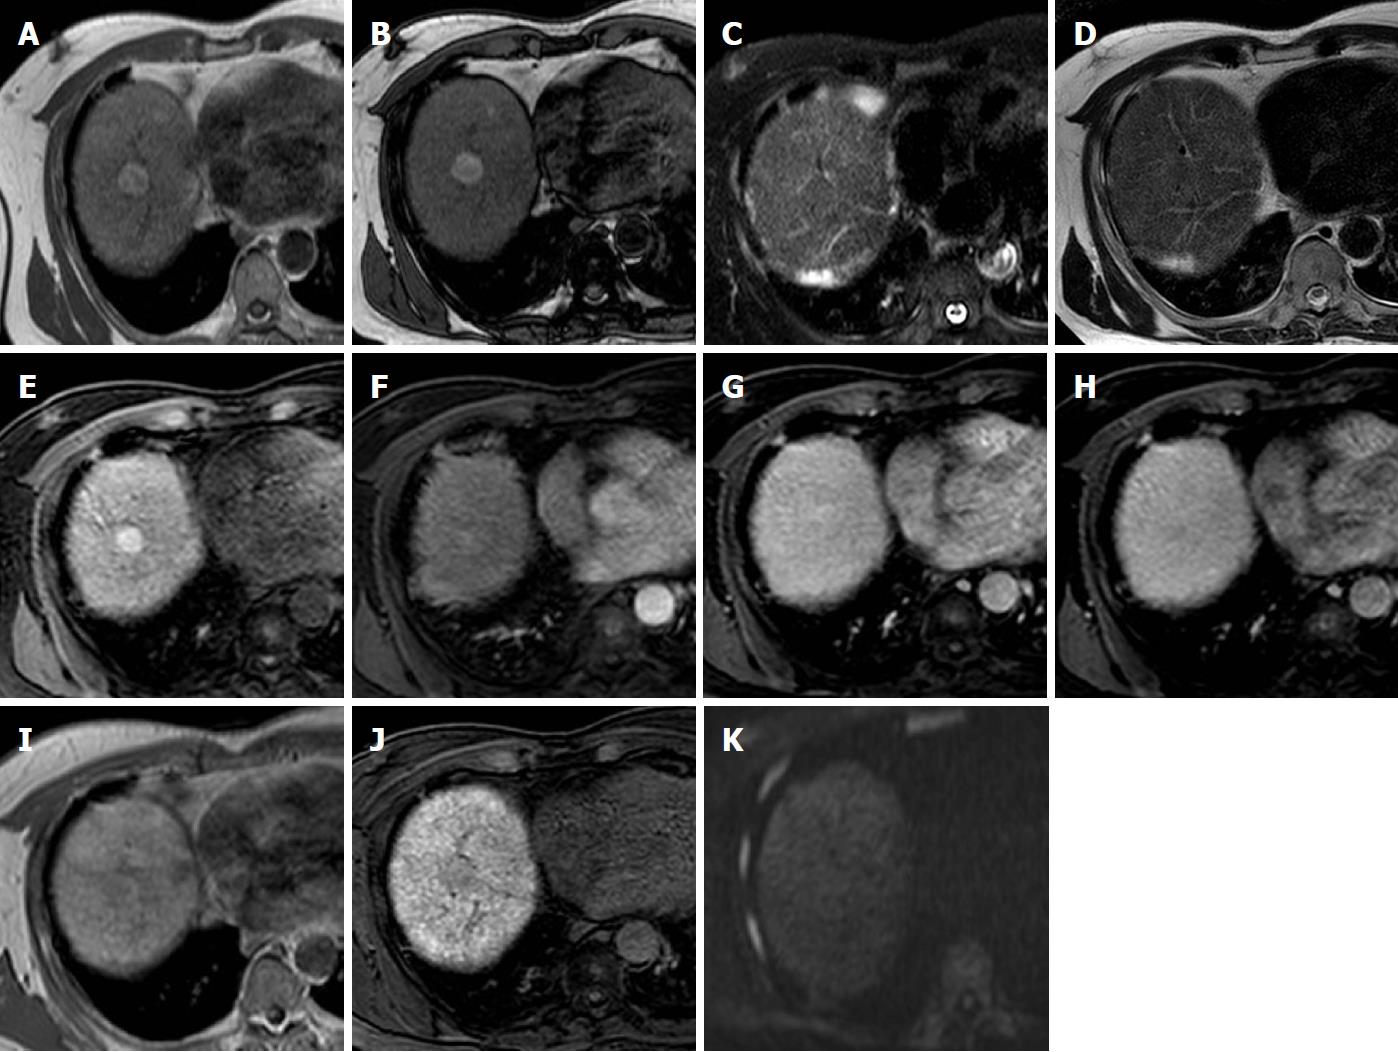
Figure 3 High-grade dysplastic nodule.
Gd-EOB-DTPA enhanced MR images of a 57 years old cirrhotic patient with a liver nodule in the VIII segment. A and B: Axial T1-weighted sequences both ”in phase” and “out of phase” show a hyperintense nodule; C and D: On T2-weighted image with and without fat saturation the nodule appears as isointense; E-H: during the dynamic contrast-enhanced images the nodule shows a slight enhancement in the arterial phase, without wash-out in portal and delayed phases; I and J: Diffusion weighted image demonstrate no restriction to the diffusion; K: In hepatobiliary phase the nodule is hypointense in comparison to the surrounding liver parenchyma. The MRI features, suggestive of high grade dysplastic nodule, have been later confirmed by the histological examination. MRI: Magnetic resonance imaging.
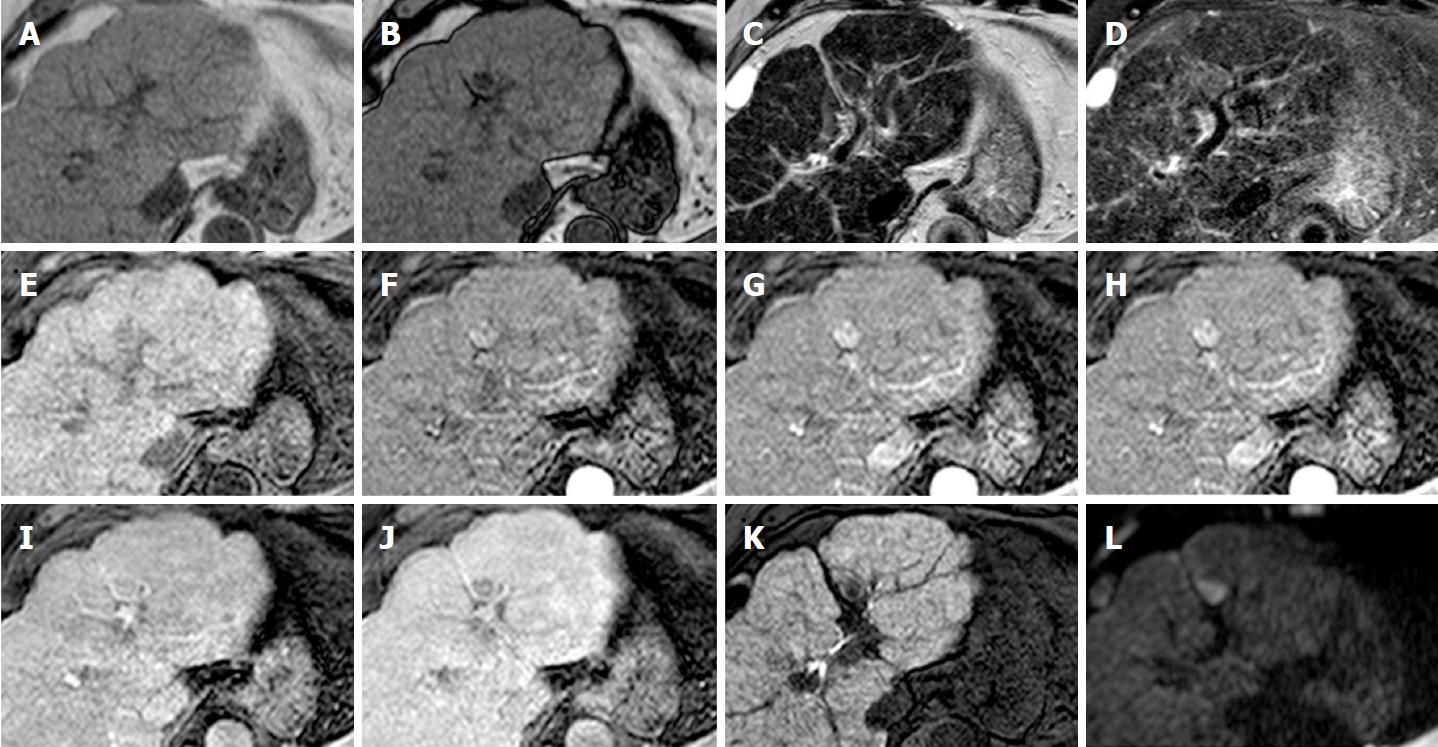
Figure 4 Typical case of lipid-rich hepatocellular carcinoma.
A and B: The signal loss of nodule on opposed-phase compared to in-phase indicates intralesional fat; C and D: There is mild signal intensity on T2 and DWI restriction (L); E: The nodule appears hypointense in pre-contrast phase; G-J: Note the typical arterial phase hyperenhancement (G and H) followed by washout appearance in the portal venous (I) and/or delayed phase (J) that is the key diagnostic feature of HCC; K: The lesion also demonstrate hypointensity in the hepatobiliary phase; F-H: Note how the multi-arterial phase imaging (F and H) able improve the conspicuity of the HCC, especially in the late arterial phase (H). DWI: Diffusion weighted images; HCC: Hepatocellular carcinoma.
Figure 5 Atypical hepatocellular carcinoma.
A and B: There is arterial phase (A) mild hyperenhancement and absence of washout appearance in the portal venous phase (B); C and D: In the delayed phase (C), there is a minimum hypointensity of the nodule, suspected for washout. The nodule resulted hyperintense in hepatobiliary phase (D); E: The lesion was biopsied and the specimen diagnosis was HCC solid-trabecular; G2, pT3a in non-cirrhotic liver with mild (< 5%) macrovescicular steatosis with portal fibrous enlargement and without septae formation.
- Citation: Inchingolo R, Faletti R, Grazioli L, Tricarico E, Gatti M, Pecorelli A, Ippolito D. MR with Gd-EOB-DTPA in assessment of liver nodules in cirrhotic patients. World J Hepatol 2018; 10(7): 462-473
- URL: https://www.wjgnet.com/1948-5182/full/v10/i7/462.htm
- DOI: https://dx.doi.org/10.4254/wjh.v10.i7.462


