Copyright
©The Author(s) 2018.
World J Hepatol. Feb 27, 2018; 10(2): 277-286
Published online Feb 27, 2018. doi: 10.4254/wjh.v10.i2.277
Published online Feb 27, 2018. doi: 10.4254/wjh.v10.i2.277
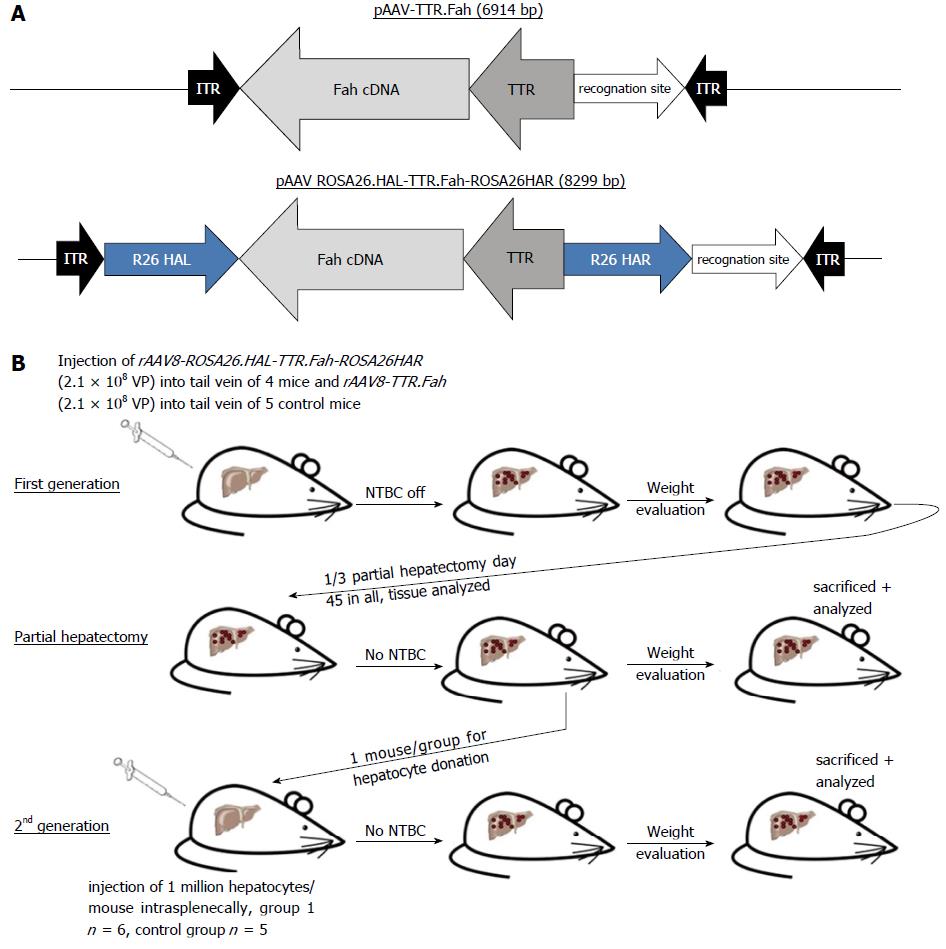
Figure 1 Flowchart of treating mice.
A: Vector map for rAAV8-ROSA26.HAL-TTR.Fah-ROSA26HAR and for rAAV8-TTR.Fah. Fah cDNA is driven by the TTR promotor and for rAAV8-ROSA26.HAL-TTR.Fah-ROSA26HAR located between the homologous arms of the Rosa26 locus. The vector was cloned into an AAV backbone; B: Scheme for the in vivo experiments. First-generation mice (C57BL/6 FAH∆exon5 strain) were injected with rAAV8-ROSA26.HAL-TTR.Fah-ROSA26HAR (group 1, n = 4) or rAAV8-TTR.Fah (control group, n = 5). The NTBC treatment was stopped, and after 45 d, a partial hepatectomy was performed. In each group, one mouse was used as the donor for hepatocyte transplantation into C57BL/6 Fah∆exon5 mice. These recipients were the second generation of mice in our study. NTBC treatment was discontinued after hepatocyte transplantation. TTR: Transthyretin promoter (liver specific); R26 HAL: Homologous arm left for target locus in Rosa26; HAR: Homologous arm right for target locus in Rosa26; ITR: Inverted terminal repeat.
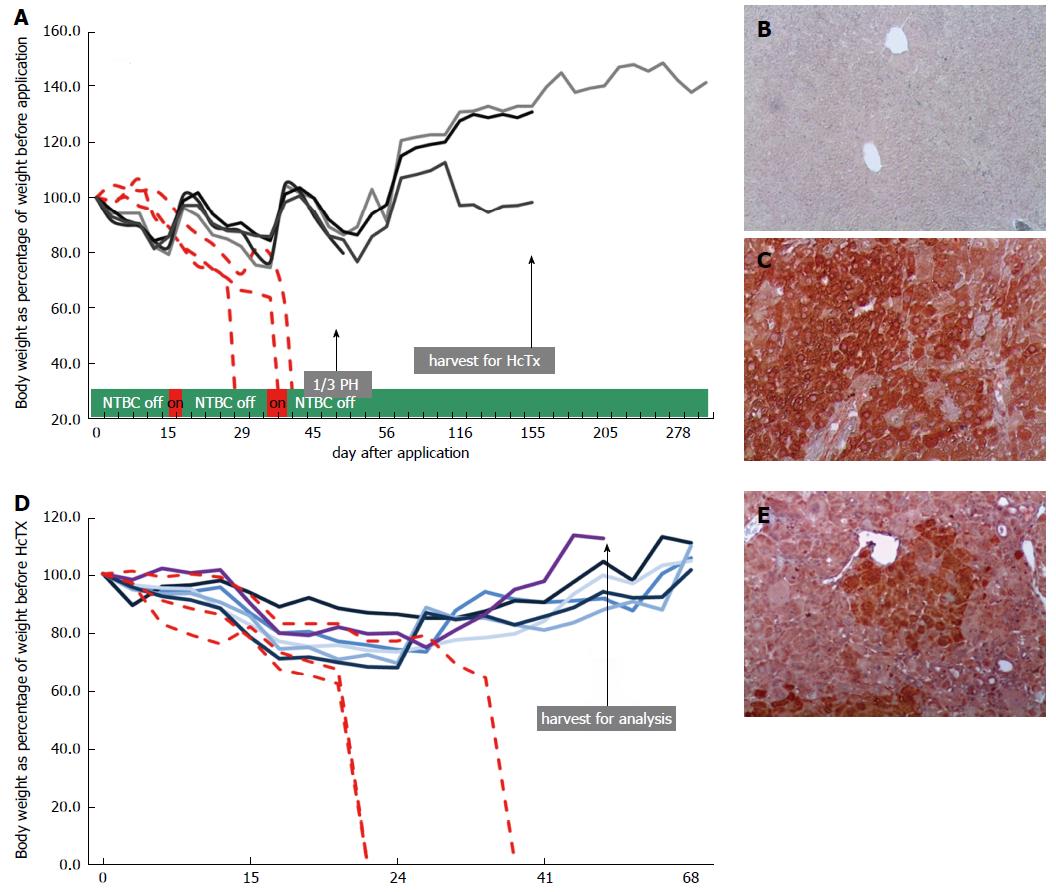
Figure 2 Mice treated with rAAV8-ROSA26.
HAL-TTR.Fah-ROSA26HAR. A: Weight graph and survival for first-generation mice (n = 4) injected with rAAV8-ROSA26.HAL-TTR.Fah-ROSA26HAR and 3 untreated controls (injected with sodium chloride). Continuous line = rAAV8-ROSA26.HAL-TTR.Fah-ROSA26HAR mice, broken line = controls (same control mice as displayed at Figure 3A). Body weight is displayed as percentage of body weight at the time of virus injection or sodium chloride injection (controls). The timeline (x-axis) is displayed in days beginning with the day of virus/sodium chloride injection as day zero; B: FAH staining of liver tissue from controls (mice with sodium chloride injection) after death (100 × magnification); C: FAH staining of liver tissue from partial hepatectomy in mouse injected with rAAV8-ROSA26.HAL-TTR.Fah-ROSA26HAR (100 × magnification); D: Weight graph and survival for second-generation mice (continuous line), which were transplanted with one million hepatocytes from mice primarily injected with rAAV8-ROSA26.HAL-TTR.Fah-ROSA26HAR and controls (same control mice as displayed at Figure 3D) without hepatocyte transplantation (broken line). Body weight is displayed as percentage of body weight at time of hepatocyte transplantation. The timeline (x-axis) is displayed in days, beginning with the day of hepatocyte transplantation as day zero; E: FAH staining of liver tissue from a partial hepatectomy from a second-generation mouse, which received one million hepatocytes from mice primarily injected with rAAV8-ROSA26.HAL-TTR.Fah-ROSA26HAR (100 × magnification). 1/3PH: One third partial hepatectomy; HcTx: Hepatocyte transplantation.
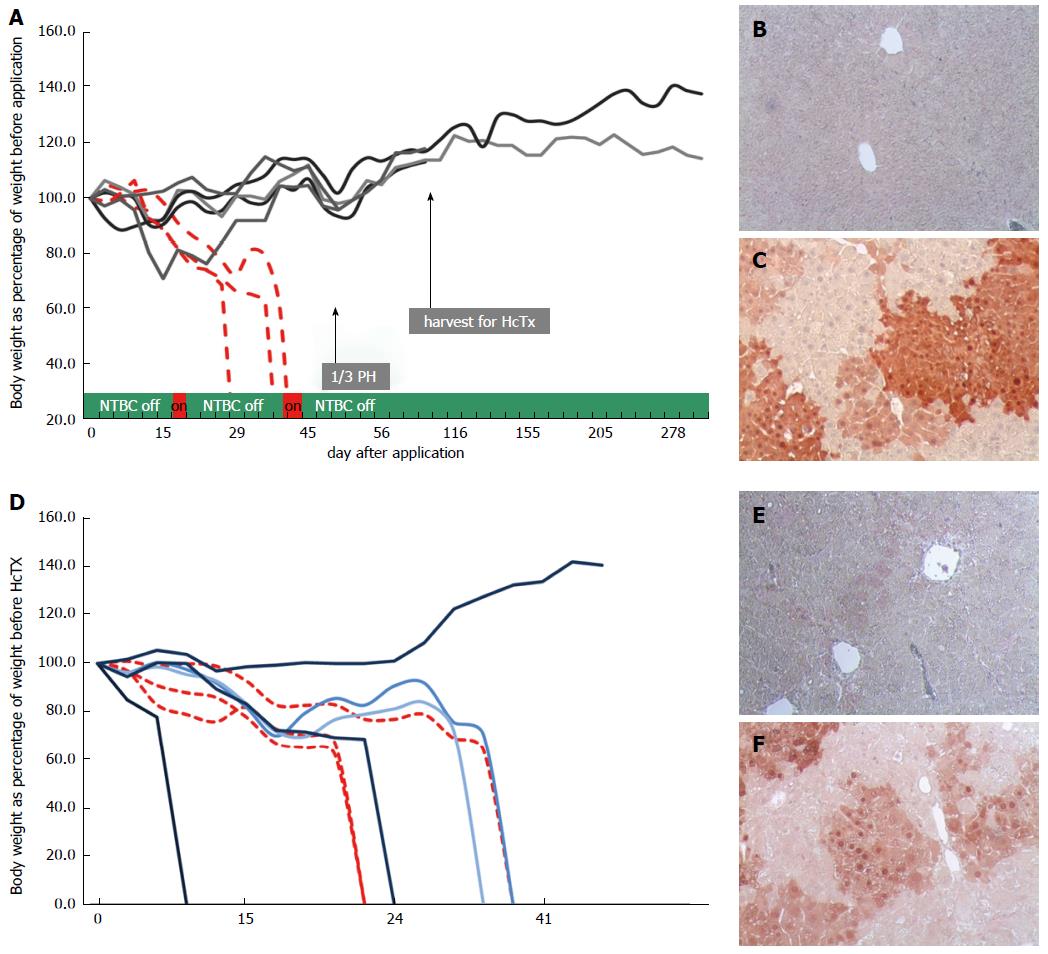
Figure 3 Mice treated with rAAV8-TTR.
Fah. A: Weight graph and survival for first-generation mice injected with rAAV8-TTR.Fah (n = 5) and 3 untreated controls (injected with sodium chloride). Continuous line = rAAV8-TTR.Fah mice, broken line = controls (same control mice as displayed at Figure 2A). Body weight is displayed as percentage of body weight at the time of virus injection or sodium chloride injection (controls). The timeline (x-axis) is displayed in days beginning with the day of virus/sodium chloride injection as day zero; B: FAH staining of liver tissue from controls (mouse with sodium chloride injection) after death (100 × magnification); C: FAH staining of liver tissue from a partial hepatectomy from a mouse injected with rAAV8-TTR.Fah (100 × magnification); D: Weight graph and survival for second-generation mice (continuous line), which were transplanted with one million hepatocytes from mice primarily injected with rAAV8-TTR.Fah and controls (same control mice as displayed at Figure 2D) without hepatocyte transplantation (broken line). Body weight is displayed as percentage of body weight at time of hepatocyte transplantation. The timeline (x-axis) is displayed in days, beginning with the day of hepatocyte transplantation as day zero; E: FAH staining of liver tissue from a partial hepatectomy in a second-generation mouse, which received one million hepatocytes from mice primarily injected with rAAV8-TTR.Fah (100 × magnification); F: FAH staining of liver tissue from a partial hepatectomy from the single second-generation mouse that showed cluster and weight gain.
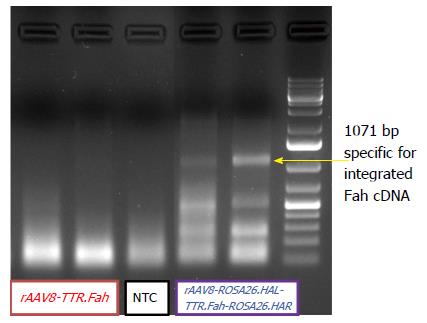
Figure 4 Integration PCR gel electrophoresis.
A representative gel picture from the analyses of genomic liver DNA, that was extracted from snap-frozen liver tissue harvested between 60-70 d after hepatocyte transplantation. Primers were located in the Rosa26 locus and in the FAH sequence of the donor DNA. Product could only be amplified if targeted integration occurred. The expected length of the PCR amplicon was 1107 bp. The PCR product was analysed utilizing agarose gel electrophoresis.
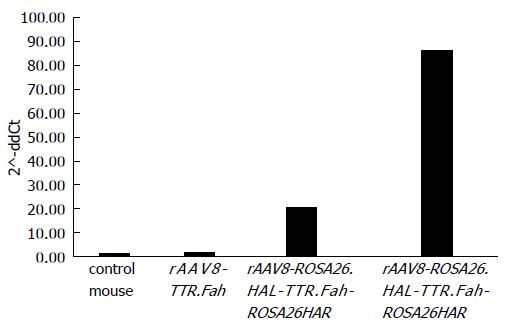
Figure 5 Sybr green qRT-PCR.
Shown are the 2^-ddct values of two mice treated with rAAV8-ROSA26.HAL-TTR.Fah-ROSA26HAR and one mouse treated with rAAV8-TTR.Fah calculated on an untreated control mouse.
- Citation: Junge N, Yuan Q, Vu TH, Krooss S, Bednarski C, Balakrishnan A, Cathomen T, Manns MP, Baumann U, Sharma AD, Ott M. Homologous recombination mediates stable Fah gene integration and phenotypic correction in tyrosinaemia mouse-model. World J Hepatol 2018; 10(2): 277-286
- URL: https://www.wjgnet.com/1948-5182/full/v10/i2/277.htm
- DOI: https://dx.doi.org/10.4254/wjh.v10.i2.277


