Copyright
©The Author(s) 2018.
World J Hepatol. Feb 27, 2018; 10(2): 172-185
Published online Feb 27, 2018. doi: 10.4254/wjh.v10.i2.172
Published online Feb 27, 2018. doi: 10.4254/wjh.v10.i2.172
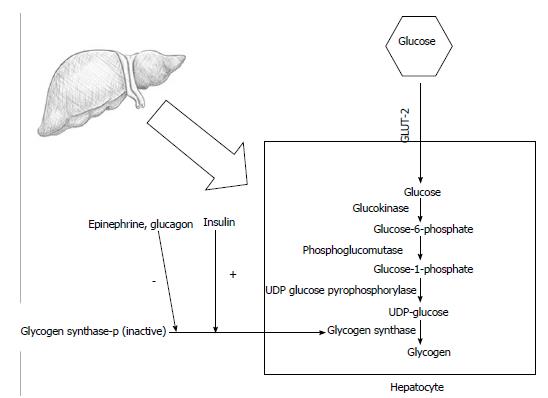
Figure 1 Steps of glycogenesis; effects of hyperglycemia and insulin treatment in glycogenic hepatopathy and formation of glycogen.
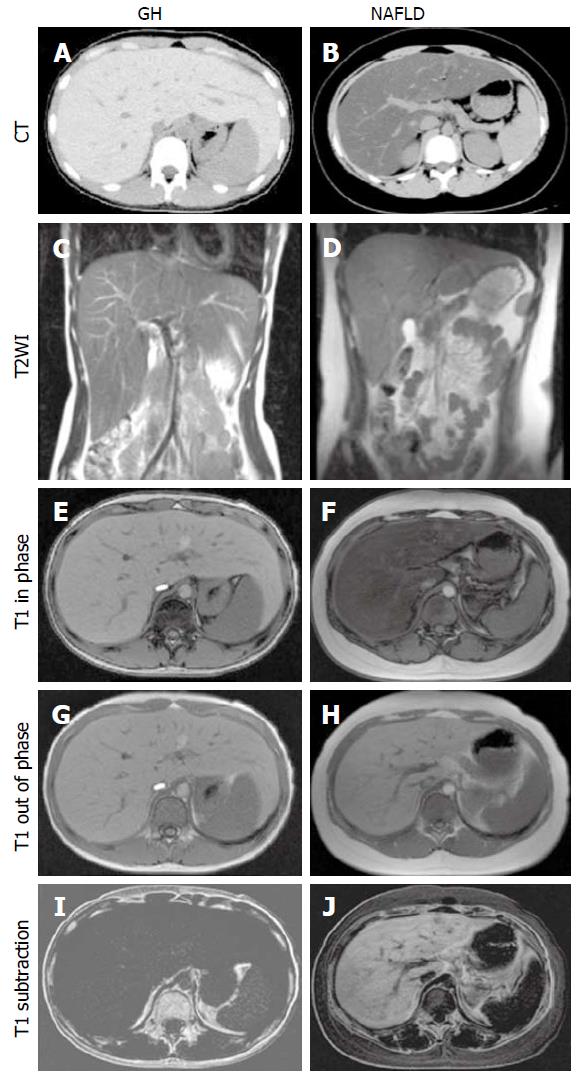
Figure 2 Computed tomography (CT) and magnetic resonance imaging (MRI) of (A, C, E, G, I) glycogenic hepatopathy (GH) in a 13-year-old girl and (B, D, F, H, J) non-alcoholic fatty liver disease (NAFLD) in a 13-year-old boy.
On CT, GH was (A) high density, but NAFLD was typically (B) low density; On T2-weighted imaging (T2WI), both enlarged livers were (C) 19.1 cm and (D) 16.8 cm along the right midclavicular line; On gradient dual-echo MRI, the GH liver was iso-intense between the (E) in-phase and (G) out-of-phase images, namely; I: Low intensity on subtraction. The NAFLD liver, however, had low intensity on the (F) in-phase image, and high intensity on the (H) out-of-phase image, namely; J: High intensity on subtraction. With permission from Saikusa et al[22], John Wiley and Sons publications.
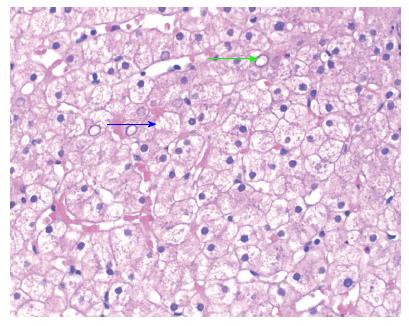
Figure 3 Percutaneous liver biopsy section of a patient with glycogenic hepatopathy.
HE stain showing enlarged hepatocytes with cytoplasmic pallor with reddish pink globules consistent with glycogen accumulation (blue arrow), and prominent glycogenated nuclei (green arrow).
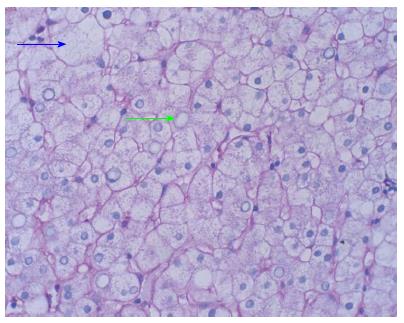
Figure 4 D-Periodic-Acid Schiff stain remove glycogen leaving empty looking cytoplasm (blue arrow) and nuclei (green arrow).
- Citation: Sherigar JM, Castro JD, Yin YM, Guss D, Mohanty SR. Glycogenic hepatopathy: A narrative review. World J Hepatol 2018; 10(2): 172-185
- URL: https://www.wjgnet.com/1948-5182/full/v10/i2/172.htm
- DOI: https://dx.doi.org/10.4254/wjh.v10.i2.172


