Copyright
©The Author(s) 2018.
World J Hepatol. Nov 27, 2018; 10(11): 867-876
Published online Nov 27, 2018. doi: 10.4254/wjh.v10.i11.867
Published online Nov 27, 2018. doi: 10.4254/wjh.v10.i11.867
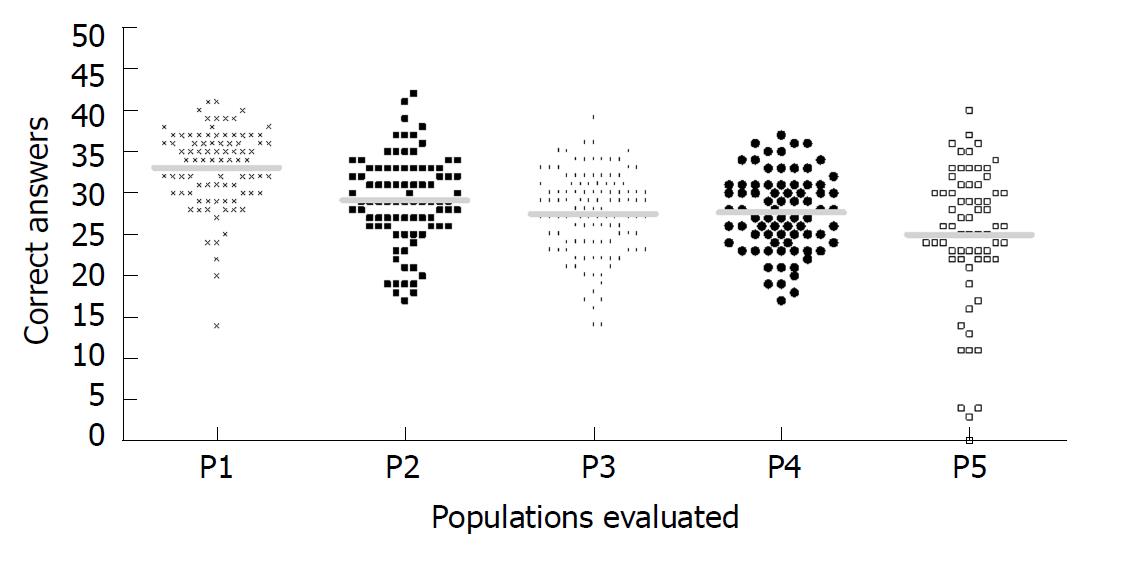
Figure 1 Distribution of correct answers plotted according to each population evaluated.
The y-axis represents the number of correct answers. The solid lines represent the average for P1 (Southeast Viral Hepatitis Ambulatory), P2 (South Health Center), P3 (Northeast Health Center), P4 (Southeast low resource areas) and P5 (Northeast low resource areas), which were respectively: 33.1 ± 4.5; 29.1 ± 5.3; 27.5 ± 5.0; 27.6 ± 4.7; and, 25.0 ± 8.5.
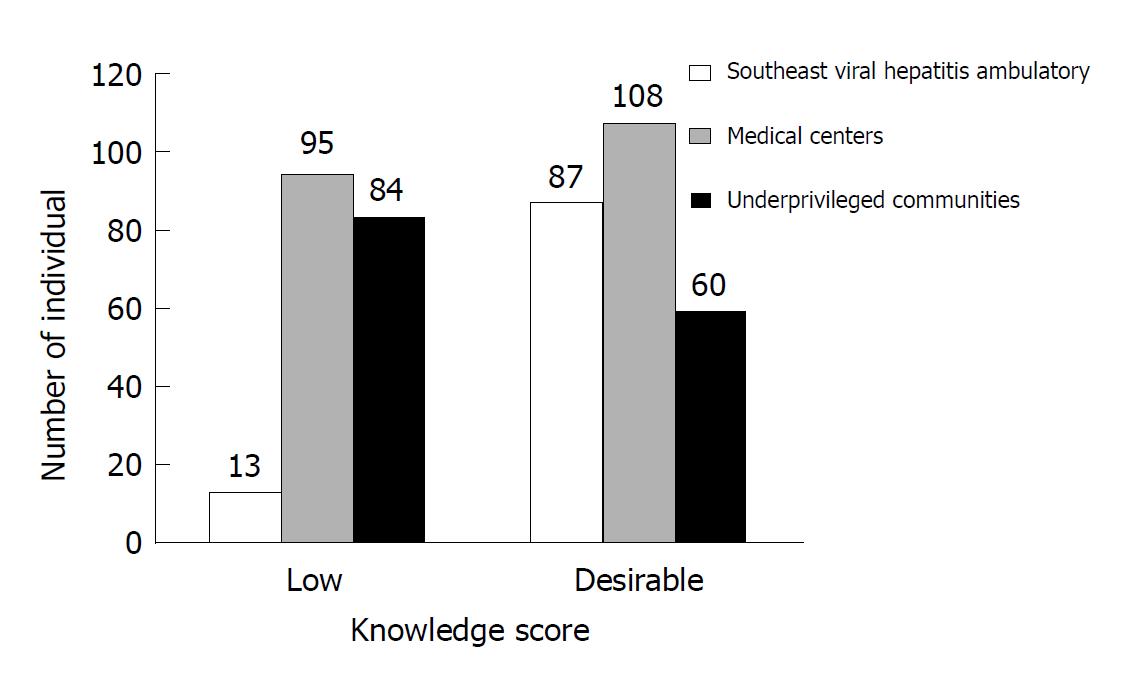
Figure 2 Number of individuals according to knowledge score in each group evaluated.
- Citation: Cruz HM, Barbosa JR, Baima Colares JK, de Moraes Neto AHA, Alencar MFL, Bastos FI, da Mota JC, Carvalho-Costa FA, Ivantes CAP, Lewis-Ximenez LL, Villar LM. Cross-sectional study to determine viral hepatitis knowledge in different urban populations in Brazil. World J Hepatol 2018; 10(11): 867-876
- URL: https://www.wjgnet.com/1948-5182/full/v10/i11/867.htm
- DOI: https://dx.doi.org/10.4254/wjh.v10.i11.867


