INTRODUCTION
The synthesis and the amount of collagen deposited in fibrotic liver have been studied by many investigators. The biochemical data revealed that the content of collagen proteins in liver fibrosis increased. Pierce et al[1] found that the increased total hydroxyproline was associated with collagen synthesis in early liver fibrosis of the rat induced by carbon tetrachloride (CCl4). Ogawa et al[2] and Clement et al[3] investigated the localization and the semiquantitative analysis of the increased collagens in rat liver fibrosis immunohistochemically. The amount of α1(I), α1(III) and α1(IV) procollagen mRNA in liver fibrosis was found to be increased by either slot blot or Northern blot[4-6]. Many kinds of cells in liver fibrosis, such as hepatic stellate cells (HSCs), myofibroblasts (MFs), fibroblasts (Fbs), parenchyma cells and endothelial cells were reported to be involved in producing collagens in liver fibrosis in vivo and/or in vitro, but the results still remain controversial[1,4,6-12]. The application of immunohistochemical method provides a useful way for identifying the content and the components of the extracellular matrix in the liver. However, it could not reliably identify the cell types which were responsible for synthesizing collagens during fibrogenesis. The in situ hybridization method provides a benefit to identifying the cell types expressing the extracellular matrix gene. Some studies demonstrated the α1(I), α1(III) and α1(IV) procollagen mRNA expressing cells with in situ hybridization using procollagen cRNA probes labeled with isotope 35S in vivo and in vitro[7,8]. Because of the diffuse localization of 35S-hybridization signals, it is also difficult to identify accurately the cellular composition signals which are exactly responsible for the synthesis of collagen in fibrotic liver. The purpose of this study is to observe the dynamic changes of the expression of α1(I), α1(III) and α1(IV) procollagen mRNA by Northern blot analysis and the distribution and content (semiquantitatively) of type I, III and IV collagen (Col I, Col III, Col IV) by immunohistochemistry in different stages of liver fibrogenesis and to clarify the types of collagen producing cells in liver fibrogenesis by immunohistochemical staining of desmin (Dm) and á-smooth muscle actin (α-SMA) and in situ-hybridization of α1(I), α1(III) and α1(IV) procollagen mRNA with the procollagen cDNA probes labeled by digoxigenin in serial tissue sections.
MATERIALS AND METHODS
Animal model
Male Sprague-Dawley (SD) rats (n = 40, provided by Shanghai Division of the Animal Center of Chinese Academy of Sciences), weighing 180 g-220 g, were subcutaneously injected with CCl4 at a dose of 0.33 mL/100 g of body weight, and an equal mixture of olive oil twice a week with low-choline diet to induce liver fibrosis model[12]. The control rats (n = 24) were injected with an equal amount of olive oil only and fed with standard diet. Every five experimental rats were killed after 2-, 4-, 6-, 8-, 10-, 12-, 16-, and 20-week treatment and with 3 age-matched ones as control. After removal, small pieces of liver samples (5 mm3-10 mm3) were immediately frozen in liquid nitrogen and stored at -80 °C for Northern blot analysis, and other pieces of the liver tissues were cut into serial frozen sections with 5 μm in thickness and placed on poly-L-lysine coated slides. The sections were fixed in 4 mL/L paraformaldehyde in PBS (0.1 mol/L, pH7.4, containing 5 mmol/L MgCl2) for 10 min, rinsed in PBS, then in 2 × SSC three times for 10 min each and dehydrated in ethanol and stored at -80 °C for in situ hybridization and immunohistochemistry.
Northern blot analysis
Rat α1(I), human α1(III) and α1(IV) procollagen cDNA plasmids were generously provided by Dr. Chu ML (Jefferson Medical College, USA). The sizes of the inserts contained in the pBR322 plasmid vectors are 1.3 kb for α1(I), 0.7 kb for α1(III) and 2.6 kb for α1(IV) in size respectively. The cDNA probes were labeled with 32P-deoxycytidine triphosphate (Amersham) to a specific activity of (2.5) × 108 cpm/μg of DNA using a primer extension kit (Pharmacia) for α1(I) and α1(IV) procollagen cDNA probes labeling and nick translation kit (Gibco BRL) for α1(III) procollagen cDNA probe labeling. Total RNA was isolated from the liver tissue by extraction in guanidine isothiocynate[13]. Twenty μg total RNA from each sample was separated on a 10 g/L agarose gel containing 2.2 mol/L- formaldehyde and then transferred onto nitrocellulose filters (Stratagene), and baked at 80 °C for 2 h to bind the RNA to the filters. The filters were prehybridized in 500 g/L formamide, 50 mol/L sodium phosphate, 0.8 mol/L NaCl, 1 mmol/L EDTA, and 2 g/L SDS in 4 × Denhardt’s solution with 250 μg/L denatured herring sperm DNA (Sigma) for 4 h at 45 °C and then hybridized in the same fresh solution as above containing the 32P-labeled α1(I), α1(III) and α1(IV) procollagen cDNA probes respectively overnight at 45 °C. After high stringency washing in 2 × SSC, 1 × SSC, 0.5 × SSC and 0.1 × SSC with 1 g/L SDS sequentially at 45 °C for 15 min each, the nitrocellulose filters were exposed to Kodak film at -80 °C for one week. After autoradiography, the filters were boiled in distilled water for 10 min to strip off the radioactive probes and rehybridized again with 32P-labeled-glyceraldehyde-3-phosphate dehydrogenase (GAPDH) cDNA probe (1 × 10⁶ cpm/μg DNA) at 42 °C overnight for internal control. Autoradiographic signals of mRNA bands were quantified by scanning densitometry. The integrated optical density (IOD) of the hybridization bands were analyzed with TSTY-300 software (Sun Company of Tongji University). The IOD of α1(I), α1(III) and α1(IV) procollagen mRNA was corrected by the IOD of GAPDH mRNA. The data were analyzed by t test.
In situ hybridization
In situ hybridization was performed on poly-L-lysine-coated frozen tissue sections with slight modification of our previous report[14]. Briefly, frozen liver tissue sections (5 μm) were fixed in 40 mL/L paraformaldehyde before rehydrated with 0.1 mol/L PBS (pH7.4), treated with 4 g/L Triton X-100 in PBS at RT for 10 min and incubated with proteinase K (20 mg/L, Merck Co.) in 0.1 mmol/L Tris at 37 °Cfor 30 min. Then the frozen tissue sections were postfixed with 40 mL/L paraformaldehyde in PBS (containing 5 mmol/L MgCl2) again at RT for 10 min and quenched with glycine (2 m/L) in PBS for 5 min and acetylated in a freshly prepared solution of 2.5 mL/L acetic anhydride in 0.1 mol/L triethanolamine (pH8.0, Sigma) for 10 min. After rinsing with PBS, the tissue sections were dehydrated in graded ethanols and air dried prior to hybridization.
For in situ hybridization, the sections were prehybridized at 37 °C for 1 h. Twenty μL of hybridization buffer was added to each section, followed by incubation in a sealed humid chamber at 42 °Cfor 16-18 h. The hybridization buffer contained 500 mL/L deionized formamide, 100 g/L dextran sulfate (Sigma), 4 × Denhardt’s solution, 0.3 mol/L NaCl, 1 mmol/L EDTA (pH8.0), 20 mmol/L Tris Cl (pH8.0), 200 mg/L denatured herring sperm DNA (Sigma), 200 mg/L yeast tRNA (Sigma) and 500 μg/L denatured procollagen cDNA probes which were labeled with digoxigenin-dUTP by the random priming method using a DNA labeling and detection kit (Boehringer Mannheim). After hybridization the excess of the probes was removed by rinsing in 2 × SSC, 1 × SSC and 0.5 × SSC at 42 °C for 15 min each. The same kit as that used for DNA labeling was employed for immunological detection. The sections were washed briefly with buffer I solution (100 mmol/L Tris Cl, 150 mmol/L NaCl, pH7.6), and incubated with buffer II solution which was prepared by buffer I solution with 10 g/L blocking re agent of the kit at RT for 30 min. After washing again briefly with buffer I solution, the sections were incubated with a 1:500-dilution of sheep a nti-digoxigenin Fab fragment conjugated with alkaline phosphatase in buffer II solution with 1 mmol/L levamisole (Sigma) at 37 °C for 2 h. The sections were washed twice with buffer I solution at RT for 15 min, and equilibrated with the buffer III solution (100 mmol/L TrisCl, 100 mmol/L NaCl, and 50 mmol/L MgCl2, pH9.5) for 10 min. Then the sections were incubated with the solution containing 4-nitroblue tetrazoliumchloride and 5-Bromo-4-chloro-3-indolyl-phosphate in buffer III to develop the color in a dark box for 2 h. After stopping the color reaction with buffer IV solution (10 mmol/L TrisCl, 1 mmol/L EDTA, pH8.0), the sections were mounted with glycerin and observed under light microscope.
Immunohistochemistry
The monoclonal antibodies against Col IV, α-SMA and Dm were purchased from DAKO. The rabbit anti-Col I, Col III and mouse and rabbit PAP kits were prepared by our department[15]. Col I, Col III, Col IV, α-SMA and Dm in normal and fibrotic livers were detected with PAP method as described previously[15]. Briefly, serial cryostat sections (5 μm) were treated with pure methanol (containing 0.2 mL/L H2O2) at 37 °C for 30 min and washed in PBS, and then incubated in PBS with 100 mL/L bovine albumin at 37 °C for 1 h. The sections were incubated with mouse anti-type IV collagen (1:100 dilution), α-SMA (1:40 dilution) and Dm (1:100 dilution), and rabbit anti-type I collagen (1:100 dilution) and type III collagen (1:1000 dilution) respectively at 37 °C for 1 h and then at 4 °C overnight. The sections were washed in PBS and incubated with rabbit anti-mouse (1:200 dilution) or goat anti-rabbit IgG (1:200 dilution) at 37 °C for 1 h. After washing in PBS, the sections were incubated with mouse or rabbit PAP complex (1:200 dilution) at 37 °C for 1 h. The color was developed with 0.5 g/L 3,3’-diaminobenzidine/0.5 mL/L H2O2/0.05 mol/L TBS (pH7.6) for 10 min. Normal mouse or rabbit serum instead of the specific primary antibodies were used as negative control.
RESULTS
Morphologic changes
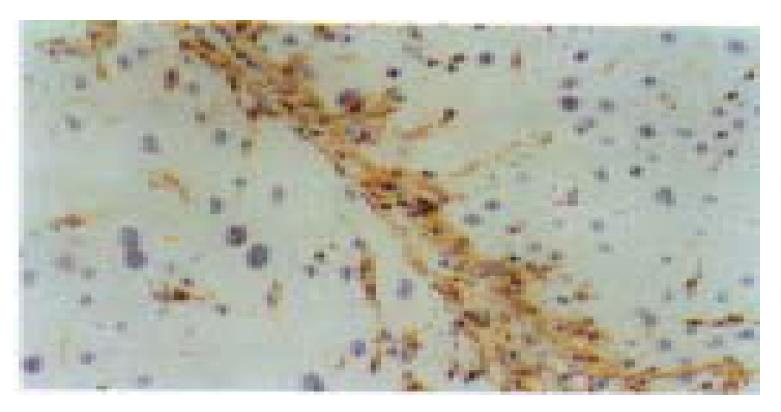
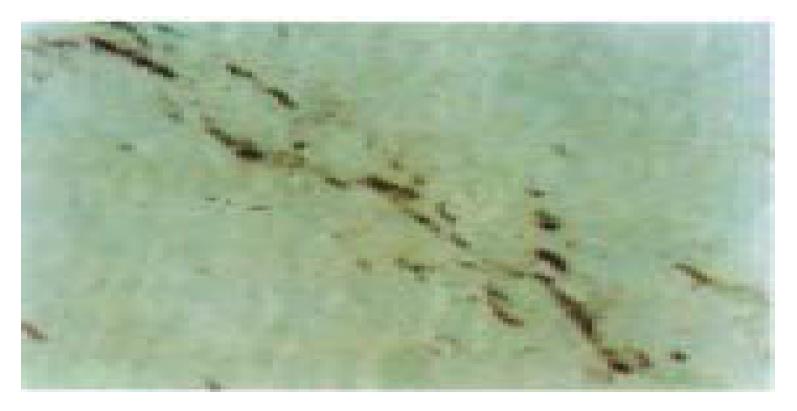
Liver fibrosis model of the rats was successfully induced by CCl4 subcutaneous injection with low-choline diet. At the 2nd week of the experiment, the hepatocytes of pericentral areas of lobules showed steatosis and necrosis. Likewise, HSCs proliferated and enlarged with enhanced Dm expression and some of them began to express α-SMA. At 4th-6th weeks of the experiment, fine cytofibrotic cords derived and extended from the periphery of the central veins. The cells in the cords were mainly composed of Dm and/or α-SMA positive MFs and the negative ones (Fbs) with long oval or spindle nuclei. There were also many activated Dm and α-SMA positive HSCs near the cords. In the middle stage of the experiment (8-12 weeks), the extended cytofibrotic septa connected the neighboring central areas or portal areas gradually. More Dm and/or α-SMA positive MFs or negative Fbs appeared within the septa also with Dm and α-SMA positive HSCs nearby (Figure 1). The proliferated oval cells in portal areas and septa expressed α-SMA and a few scattered hepatocytes might also express α-SMA. Newly formed capillaries could be found in the septa, and the long axes of which were parallel with the septa. In the late stage (16-20 weeks), fibrotic septa was generally broadened. There were still many cells with long oval or spindle-shaped nuclei within the septa, however, most of them were both Dm and α-SMA negative. Only the cells located at the margin of the septa still kept positive staining. Daughter septa extended from the widened fibrotic septa might occur and cut the liver parenchyma further. The proliferated HSCs in the daughter septa continued to be α-SMA and Dm positive.
Figure 1 The cells in the cytofibrotic septa were mainly composed of desmin (Dm) positive hepatic stellate cells (HSCs) and myo fibroblasts (MFs) and some Dm negative fibroblasts (Fbs) (8 weeks of CCl4 administration).
Immunohistochemical staining for Dm, × 200
Procollagen mRNA Northern analysis
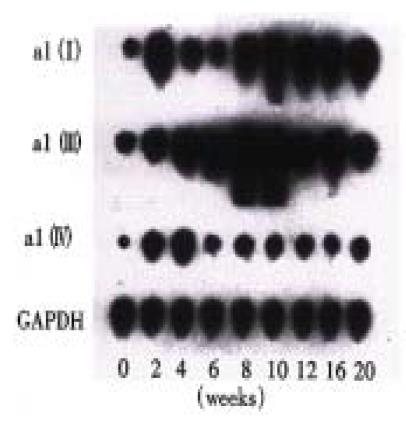
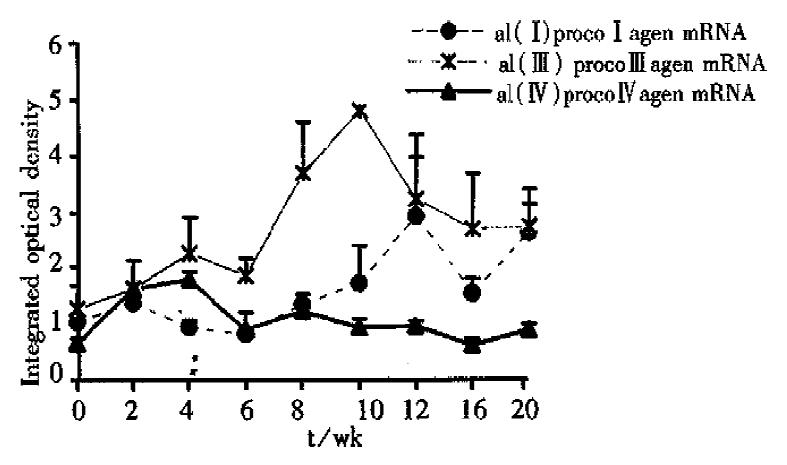
The expression of α1(I), α1(III) and α1(IV) procollagen mRNA was generally enhanced during the experiment, but the sequence and degree of the changes were not synchronous. At the 2nd week of the experiment, the content of -α1(IV)- procollagen mRNA was obviously increased compared with that of the normal. Then it decreased after the 4th week, but still kept a comparatively higher level during the whole period of the experiment. Although the enhancement of the expression of α1(III) procollagen mRNA occurred later than that of α1(IV) procollagen mRNA, the increase of the expression of α1(III) procollagen mRNA was the most predominant one among the three in the whole experiment. The content of α1(III) procollagen mRNA reached its peak at the 10th week, then decreased gradually. The expression of α1(I) procollagen mRNA was enhanced later than that of α1(III) mRNA and reached its first peak at the 12th week, then it decreased a little and increased again after the 16th week. Finally the content of α1(I) procollagen mRNA reached the level as high as that of α1(III) procollagen mRNA at the 20th week (Figure 2, Figure 3).
Figure 2 Dynamic changes of α1(I), α1(III) and α1(IV) procollagen mRNA expression in different stages of the experiment (Northern blot analysis).
Figure 3 The changes of α1(I), α1(III) and α1(IV) procollagen mRNA expression in different stages of the experiment (Northern blot analysis).
Procollagen mRNA in situ hybridization
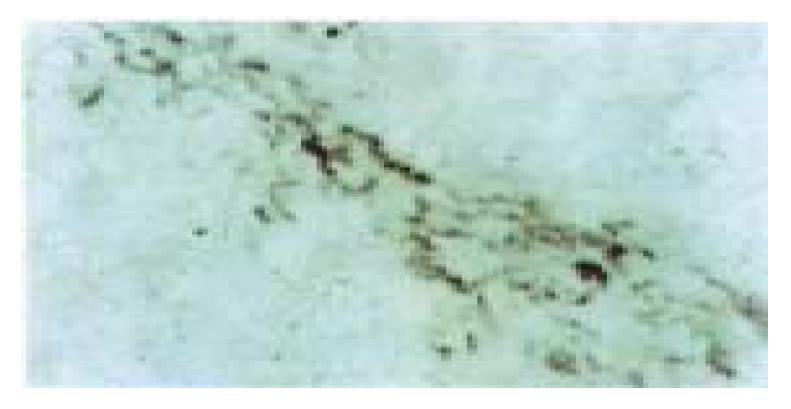
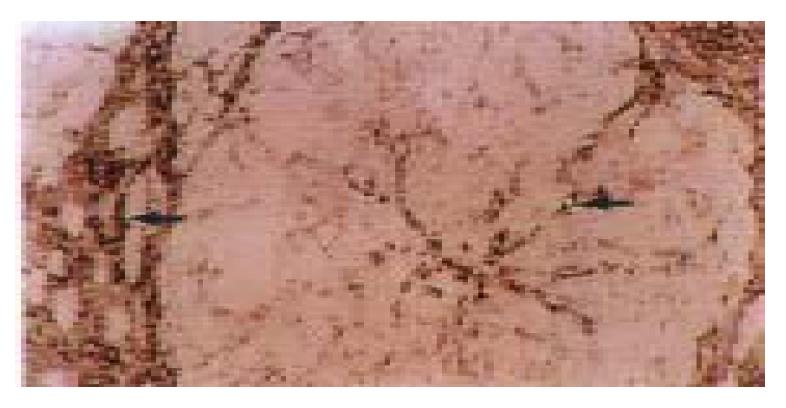
The distribution of α1(I), α1(III), α1(IV) procollagen mRNA was similar in the normal rat liver, which mainly localized in mesothelial cells of the liver capsule, smooth muscle cells of blood vessels and periductal mesenchymal cells in portal areas, endothelial cells of central veins and a few HSCs in perisinusoids. In addition, α1(IV) procollagen mRNA transcription was also detected in sinusoid endothelial cells. In the early stage of the liver fibrogenesis there were a lot of stellate and spindle cells in the pericentral areas of the lobules expressed strong signals of α1(III), α1(IV) procollagen mRNA and only some of them expressed α1(I) procollagen mRNA signals simultaneously. These cells were mainly regarded as the proliferated HSCs and MFs and proved to express Dm and/or α-SMA in the adjacent tissue sections. The cytofibrotic septa composed of HSCs, MFs and Fbs with positive hybridization signals connected the neighboring centrol areas and protal areas gradually (Figure 4, Figure 5). The sinusoid endothelial cells were also found to express strong signals of α1(IV) procollagen mRNA. In the middle stage of the experiment the MFs and Fbs in fibrotic septa further enhanced in expression of α1(III) procollagen mRNA, with some positive signals of α1(I) and α1(IV) procollagen mRNA expression as well. In the late stage of the experiment the spindle-shaped cells within the septa often with negative staining of Dm and α-SMA expressed strong signals of α1(I) and α1(III) procollagen mRNA and weak signals of α1(IV) procollagen mRNA. In addition, the capillary endothelial cells of small blood vessels in the septa, some sinusoid endothelial cells and HSCs in perisinusoids also expressed strong α1(IV) procollagen mRNA (Figure 6). Hepatocytes, oval cells and the epithelia of bile ducts did not express any identifiable procollagen mRNA by in situ hybridization.
Figure 4 Most of the cells in the cytofibrotic septa expressed α1(III)- procollagen mRNA (6 weeks of CCl4 administration).
In situ-hibridization, × 400
Figure 5 The serial tissue section of Figure 4, only a few of the cells in the cytofibrotic septa expressed α1(I) procollagen mRNA.
In situ hybridization, × 400
Figure 6 Some spindle cells and the endothelial cell s of small blood (arrow) vessels in the fibrotic septa and the endothelial cells of the capillized sinusoids (arrow) expressed strong signals of á1 (IV) procollagen mRNA in the late stage of the experiment (16 weeks of CCl4 administration).
In situ hybridization, × 200
Immunohistochemical detection of collagens
Col I, Col III and Col IV of normal rat liver were mainly localized in liver capsule, portal areas and the walls of blood vessels. Liver sinusoids showed interruptedly positive staining with Col III and Col IV, but negative with Col I. In addition, Col IV was also localized at the basement membrane of capillaries and bile ducts. A few HSCs expressed type I and III procollagen with positive staining in cytoplasm. The change of the content of collagens in tissue sections of the experimental groups showed immunohistochemically the similar bias as that of procollagen mRNA by Northern analysis. In the early stage of the experiment, the content of Col III and Col IV was increased, which was mainly distributed in the necrotic areas or in fine cytofibrotic cards and was parallel to the distribution of the increased HSCs. The matrix of these areas was also stained with Col IV diffusely but weakly. However, the increase of Col I deposition was mild. In the middle stage, Col IV and Col III were further increased in the fibrotic septa. The decrease of α1(III) procollagen mRNA after the 10th week detected by Northern blot analysis did not seem to affect the content of Col III detected by immunohistochemistry, which was still steadily increased with fine fibers and diffusely distributed in and around the septa. Col I was also increased in the septa with thick fibers. Hyperplastic oval cells and cholangioli in the septa and hepatocytes did not express any procollagens. In the late stage, Col IV and Col III were decreased a little and the deposition of Col I was further increased in the broadened septa. The proliferated small blood vessels with positive staining of Col IV in basement membrane within the septa communicated with each other. The sinusoids were squeezed by the proliferated hepatocytes cords, most of which were Col IV and Col III positive continuously along the sinusoids.
DISCUSSION
The fibrogenic factors known to contribute to liver fibrosis included CCl4 administration, alcohol intake, dimethylnitrosamine administration, bile duct obstruction, iron or cholesterol overload, low-nutrient diet, schistosomiasis, immune complex induction, hepatitis virus, etc[1,4-6,16-18]. The gene expression of procollagen in liver fibrosis was predominant. The increased procollagen mRNA levels in liver fibrosis might result from both the increased gene transcription and increased mRNA stabilization. In fact, both of the mechanisms have been demonstrated to increase procollagen mRNA levels in vivo and in vitro[1,6-8]. Furthermore, some of cytokines might also be involved in the enhancement of expression of procollagen mRNA[5,19-21]. In the present study, the content of α1(I), α1(III) and α1(IV) procollagen mRNA expression in the liver detected by Northern blot analysis are all changed dramatically, but not synchronously during fibrogenesis. In the early stage of the experiment, the expression of α1(IV) procollagen mRNA was increased first, then that of α1(III) mRNA, which always kept the predominant expression over the other two. The expression of the α1(I) procollagen gene increased slowly during the early stage, not as high as the content of α1(III) mRNA until the 20th week. It suggests that there is some difference in the regulation of transcription and stabilization of these procollagen genes. The data from early liver fibrosis in this study were similar to those of Nakatsukasa et al[8] and our previous investigat ion[14], but a bit different from that of Pierce et al[1], in which slot blot analysis showed the expression of α1(I) procollagen mRNA was enhanced at a slightly earlier point in the liver fibrogenesis than those of α1(III), and α1(IV) procollagen mRNA. The reason for the discrepancy between the studies is not clear. It might attribute to different ways of CCl4 administration; involvement of other fibrogenic factors; and different methods, probes or animals used, etc.
Gene expression control is a very precise and complex mechanism, which is involved at transcription and post-transcription levels. It was reported that the polypeptide fragment of type I collagen could inhibit the transcription and translation of α1(I) procollagen gene, and result in a feedback inhibition in procollagen polypeptide synthesis[22-24]. Perhaps it is because either the activation of procollagen gene or the feedback inhibition exerted by collagen polypeptides acted alternately so that the enhancement of the procollagen gene transcription during fibrogenesis revealed a ladder-shaped curve rather than a straight-line one. Moreover, the changes of collagen protein contents (average grade detected immunohistochemically) in liver during fibrogenesis were not consistant with the expression contents of their relevant procollagen mRNA completely, possibly because the content of procollagen mRNA was closely related to the real production of procollagen at the certain moment of the experiment, whereas the content of collagen protein in fibrotic liver revealed by immunohistochemistry in fact depended on all the finally accumulated content of collagen production, deposition, and degradation in liver tissue[14,25-27]. For this reason, the procollagen gene detection by nucleic hybridization can more sensitively and objectively reflect the trend of collagen synthesis in liver fibrogenesis.
Much more researches have focused on the study of the source of collagen-producing cells in liver fibrosis[4-8,10,14,16]. Besides HSCs and the related MFs, Fbs, whether any other cells, i.e. hepatocytes, endothelial cells and bile duct epithelial cell involved in the collagen production, is under active investigation. Some authors indicated that the collagens in vivo produced by hepatocytes both in normal and fibrotic liver was responsible for the principal amount of collagen content in liver[3,28]. However, the data from other investigators demonstrated that hepatocytes had no collagen-synthesizing ability[7]. In vitro, several authors reported that the cultured hepatocytes could synthesize collagens spontaneously. But from the other investigators’ point of view, the reason why the collagens appeared in cultured hepatocytes and endothelial cells was because of HSCs contamination[29,30]. Recent studies showed that HSCs, when stimulated by fibrogenic factors, were activated and enhanced in expression of Dm and α-SMA, and underwent a phenotypic transformation to MFs and Fbs, around which there was the deposition of collagens. T he increase of the number of these cells was parallel to the increase of the content of collagen deposition and to the changes of their distribution in the liver. Therefore, we suggested that there might be a “HSC-MF-Fb” effect cell sys tem in liver fibrosis, which was responsible for collagen synthesis[12]. However, the conclusion described above was mainly derived from the results of our previous immunohistochemical and ultrastructural studies. Up to now, there are still contraversies regarding which cell population offers the major contribution to liver fibrosis. In this study, the content and the distribution of α1(I), α1(III), and α1(IV) procollagen mRNA and the relevant collagens of rat liver fibrosis and cirrhosis were observed in detail by both immunohistochemistry and in situ hybridization with the procollagen cDNA probes labeled with digoxingenin. The role of “HSC-MF-Fb” effect cell system of collagen synthesis during liver fibrogenesis was further explored. In the early stage of the experiment, a variety of Dm and/or α-SMA positive HSCs and MFs appeared in necrotic areas around central veins enhanced in the expression of α1(III), α1(IV) and α1(I) procollagen mRNA.
Endothelial cells of sinusoids also increased in the expression of α1(IV) procollagen mRNA. The distribution of α1(I), α1(III) and α1(IV) procollagen mRNA expression cells was similar to those of the deposition of the corresponding collagens. At the middle stage of the experiment, the hybridization signals of these procollagen mRNA were mainly localized in the Dm and/or α-SMA positive MFs within fibrotic septa and the HSCs around the septa. During the late stage of liver fibrogenesis, except for newly formed daughter septa, the number of Dm and/or α-SMA positive cells in the fibrotic septa decreased gradually. However, the hybridization signals of these procollagen mRNA was still numerous in the cells with long oval or spindle-shaped nuclei within the septa. Therefore, the hybridization signals of the procollagen mRNA in well developed fibrotic septa was mainly derived from Fbs. Our results are consistent with those of several investigators who demonstrated that HSCs, as well as MFs and Fbs, contributed to the major source of collagen synthesis during liver fibrogenesis by either in situ hybridization or immunohistochemically[7,8]. In contrast, no evidence of collagen synthesis by hyperplastic hepatocytes and chlangioli-like tubules, which embedded in the increased extracellular matrix of fibrotic septa and often with large amount of Fbs nearby, could be observed both in situ hybridization and immunohistochemically in the present study.
On the basis of our findings described above, it is confirmed that “HSC-MF-Fb” effect cell system is the major cell source of collagen synthesis during liver fibrogenesis, in which HSCs are the collagen-producing precursor cells in the liver. In and after the middle stage of liver fibrosis, the production of Col I, Col III, and Col IV in the fibrotic septa are mainly derived from both MFs and Fbs. The expression of procollagen mRNA in these cells plays a very important role in the process of liver fibrosis. Furthermore, sinusoid endothelial cells, as another source of Col IV production, might also participate in the capillization of liver sinusoids.


