Published online Mar 7, 2025. doi: 10.3748/wjg.v31.i9.101383
Revised: December 2, 2024
Accepted: January 8, 2025
Published online: March 7, 2025
Processing time: 158 Days and 22.6 Hours
The global prevalence of non-alcoholic steatohepatitis (NASH) and its associated risk of adverse outcomes, particularly in patients with advanced liver fibrosis, underscores the importance of early and accurate diagnosis.
To develop a machine learning-based diagnostic model for advanced liver fibrosis in NASH patients.
A total of 749 patients who underwent liver biopsy at Beijing Ditan Hospital, Capital Medical University, between January 2010 and January 2020 were in
The Extreme Gradient Boosting (XGBoost) model outperformed all other machine learning models, achieving an AUROC of 0.934 (95%CI: 0.914-0.955) in the training cohort and 0.917 (95%CI: 0.880-0.953) in the validation cohort (P < 0.001). Incorporating liver stiffness measurement into the model further improved its performance, with an AUROC of 0.977 (95%CI: 0.966-0.980) in the training cohort and 0.970 (95%CI: 0.950-0.990) in the validation cohort, significantly surpassing APRI and FIB-4 scores (P < 0.001). The XGBoost model also demonstrated superior clinical utility, as evidenced by DCA and calibration curve analysis in both cohorts.
The XGBoost model provides a highly accurate, non-invasive diagnosis of advanced liver fibrosis in NASH patients, outperforming traditional methods. An online tool based on this model has been developed to assist clinicians in evaluating the risk of advanced liver fibrosis.
Core Tip: This study employed Shapley Additive Explanations (SHAP) to select key features for diagnosing advanced liver fibrosis in non-alcoholic steatohepatitis patients. Among five machine learning models, the Extreme Gradient Boosting model achieved the best performance and was further developed into an online diagnostic tool. SHAP was also used to provide local explanations, clarifying its applicability across clinical populations.
- Citation: Xiong FX, Sun L, Zhang XJ, Chen JL, Zhou Y, Ji XM, Meng PP, Wu T, Wang XB, Hou YX. Machine learning-based models for advanced fibrosis in non-alcoholic steatohepatitis patients: A cohort study. World J Gastroenterol 2025; 31(9): 101383
- URL: https://www.wjgnet.com/1007-9327/full/v31/i9/101383.htm
- DOI: https://dx.doi.org/10.3748/wjg.v31.i9.101383
The incidence of non-alcoholic steatohepatitis (NASH) is increasing globally, with prevalence rates now reaching up to 33% in East Asia and rising from 25.26% in 1990 to 38.2% today[1]. NASH often progresses to liver fibrosis or cirrhosis due to persistent inflammation, with the prevalence of stage F2 or higher fibrosis being 10% greater than in healthy individuals[2]. Advanced liver fibrosis, defined as F3/F4 stage fibrosis, significantly heightens the risk of complications. Research has shown that individuals with advanced fibrosis have a four-fold higher risk of developing liver cancer compared to those without advanced fibrosis[3]. Additionally, advanced fibrosis is associated with an increased risk of cardiovascular and cerebrovascular events, along with higher mortality rates[4-6]. These findings underscore the critical need for early identification and treatment of advanced liver fibrosis in NASH patients.
Currently, liver biopsy remains the gold standard for diagnosing liver fibrosis in NASH patients. However, this invasive procedure carries risks such as bleeding and edema, making it unsuitable for routine long-term monitoring. Non-invasive diagnostic methods, including the aspartate aminotransferase to platelet ratio index (APRI) score, Fibrosis index based on the 4 factors (FIB-4) score, and liver stiffness measurement (LSM) via ultrasound, are commonly used but require further clinical validation. Furthermore, liver function abnormalities during periods of active inflammation can compromise the diagnostic accuracy of these tools[7-9]. Given the limitations of traditional non-invasive methods, there is an urgent need for innovative diagnostic approaches to identify advanced liver fibrosis in NASH patients. Advances in computational technology have positioned machine learning (ML) as a promising tool for developing non-invasive diagnostic models. ML has shown potential in liver disease research, including analyzing liver fat deposition, inflammation, and fibrosis from imaging data, diagnosing significant portal hypertension, and stratifying the risk of immune-related liver injury[10-12]. However, the complexity of processing imaging data and the lack of specificity (SP) in existing models limit their application in diagnosing advanced fibrosis related to NASH. This study aimed to address these gaps by developing a non-invasive diagnostic model based on blood biochemical indicators. By facilitating the early detection of advanced liver fibrosis in NASH patients, this approach sought to enable timely interventions, improve clinical outcomes, and reduce the burden of invasive diagnostic procedures.
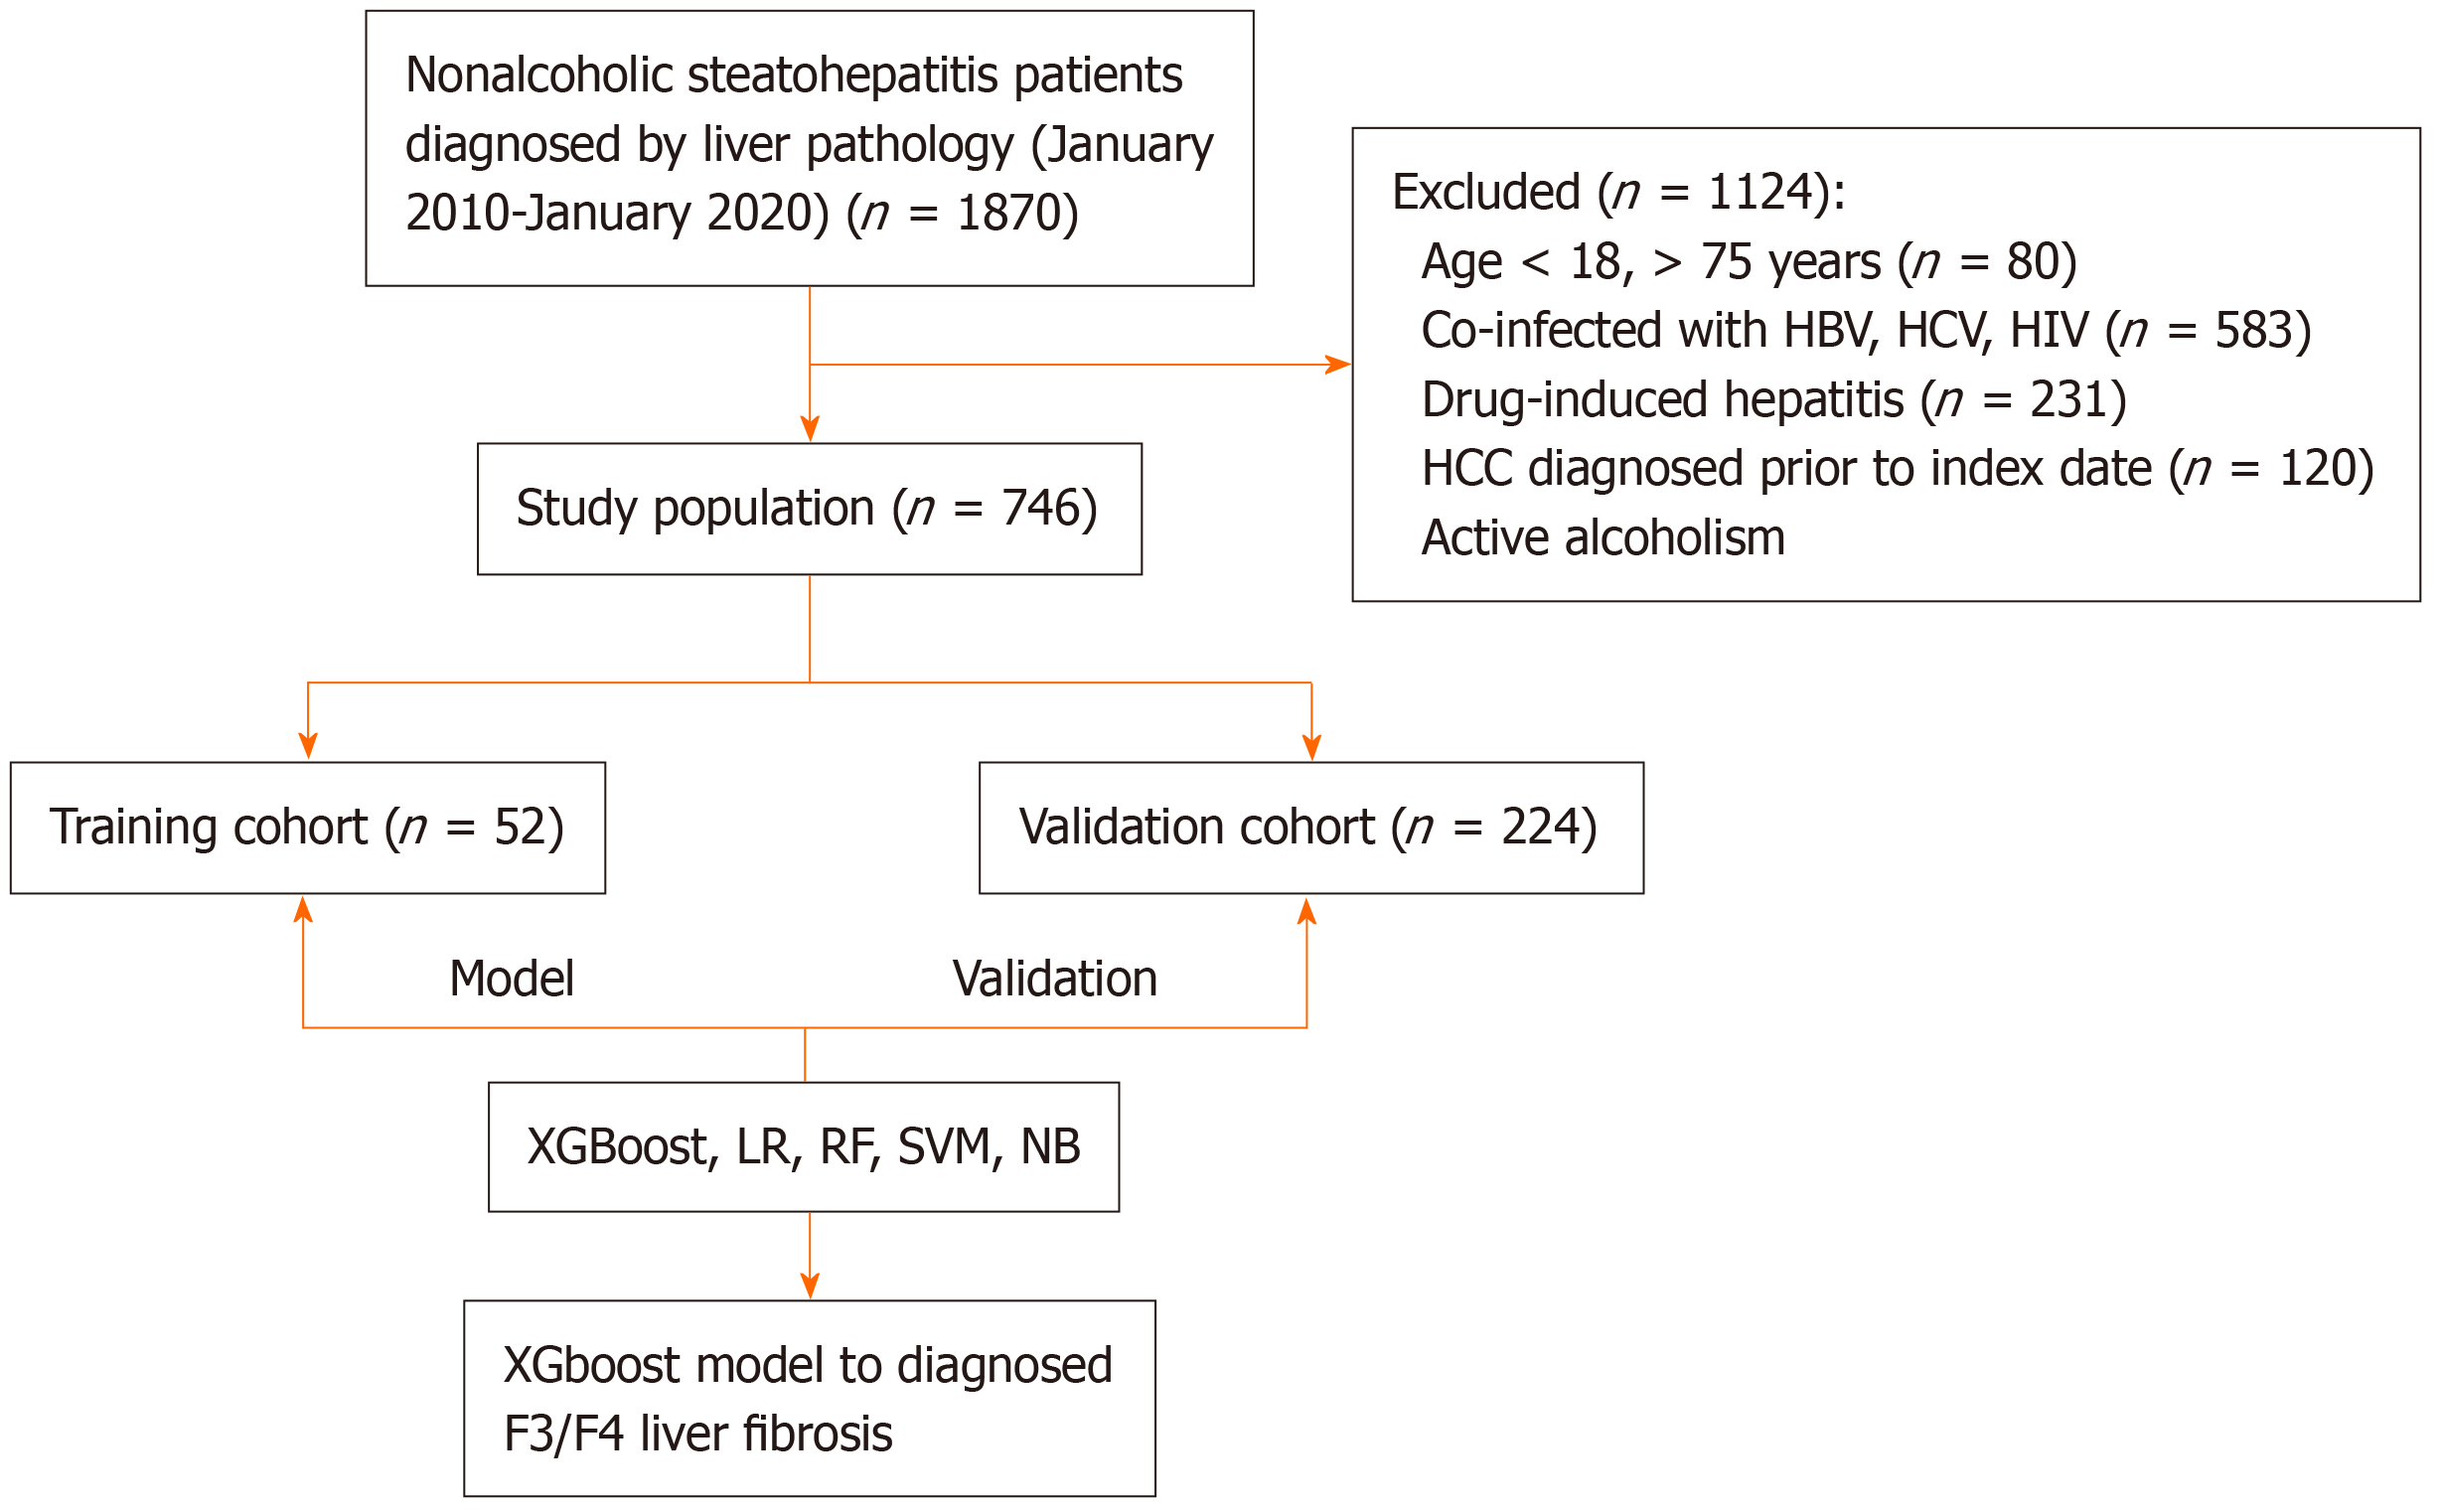
This retrospective study included 1870 patients diagnosed with NASH through liver biopsy at Beijing Ditan Hospital, Capital Medical University, between January 2010 and January 2020. After applying inclusion and exclusion criteria, 749 eligible patients were enrolled and randomly divided into training and validation cohorts in a 7:3 ratio. The inclusion criteria were: (1) Age ≥ 18 years; and (2) NASH diagnosis confirmed by liver biopsy. The exclusion criteria included: (1) Coexisting liver diseases, including hepatitis B, hepatitis C, alcoholic liver disease, autoimmune hepatitis, or genetic liver disorders; (2) The presence of hepatocellular carcinoma (HCC) or other malignancies; (3) Coexisting human immunodeficiency virus infection; or (4) Missing liver biopsy data. This study was conducted in accordance with the Declaration of Helsinki and the Declaration of Istanbul, and the study protocol received approval from the appropriate ethics or institutional review committee.
Patient data, including demographic, clinical, and laboratory information, were retrospectively obtained from the hospital’s electronic medical records system. All data were collected within 48 hours of patient admission. Collected demographic information included age, sex, personal history, and medical history. Laboratory data encompassed complete blood counts, liver function tests, renal function tests, electrolyte levels, and coagulation profiles. Liver biopsy findings were used to assess and stage liver fibrosis.
Logistic regression (LR) is a commonly used model for binary classification tasks. It predicts the probability of a sample belonging to a specific class using a linear combination of weight variables, feature vectors, and bias terms. The predicted probability is mapped to a range between 0 and 1 using the Sigmoid function. The model’s performance is measured using a logarithmic loss function, which evaluates the difference between predicted probabilities and actual labels.
Random forest (RF)[13] is an ensemble learning method that improves stability and accuracy by combining predictions from multiple decision trees. Using a bootstrap sampling technique, multiple subsets of data are generated from the training dataset, with each subset used to train a decision tree. At each node, a random subset of features is selected for optimal splitting, reducing variance and preventing overfitting. Decision trees are built to a specified depth or until a minimum threshold for samples in leaf nodes is reached. The final prediction is made by aggregating the results of all decision trees, typically through majority voting.
A Support Vector Machine (SVM)[14] classifies data by identifying a hyperplane that maximizes the margin between classes. For linearly separable data, SVM minimizes the misclassification error. For non-linear data, SVM uses kernel functions to map data into a higher-dimensional space, where it becomes linearly separable. The optimal hyperplane is obtained through the Lagrange multiplier method and dual optimization techniques, ensuring maximal separation between classes.
Extreme Gradient Boosting (XGBoost)[15] is an advanced ensemble learning algorithm that constructs multiple decision trees to improve model performance. Initially, predictions are made using a simple model. During each iteration, a decision tree is built to fit the residuals (the difference between actual and predicted values) of the existing model. To prevent overfitting, loss functions and regularization terms are applied. The updated predictions are derived by combining the results of the new tree with the existing model, with the learning rate controlling the update pace.
Naive Bayes (NB)[16] is a probabilistic model based on Bayes’ theorem and the assumption of conditional inde
The Shapley Additive Explanations (SHAP) method was used to identify key diagnostic indicators for advanced liver fibrosis in the training cohort. Five ML models-XGBoost, LR, RF, SVM, and NB-were trained and developed using these indicators and subsequently validated in the validation cohort.
Patients underwent liver elasticity measurements after fasting for at least 8 hours. Qualified technicians performed the tests in the absence of laboratory and histological data. Patients were positioned supine with the right arm fully abducted. At least 10 measurements were taken from the right hepatic lobe through the intercostal space, yielding controlled attenuation parameter (in dB/m) values associated with hepatic steatosis and LSM (in kPa) values associated with hepatic fibrosis.
Liver biopsies were performed under ultrasound guidance using a 16-gauge needle. The obtained liver tissue samples were analyzed pathologically to evaluate the severity of fibrosis, inflammation, and steatosis. Two experienced pathologists from Beijing Ditan Hospital independently assessed the histological features using the Brunt criteria[17], with F3/F4 stages classified as advanced liver fibrosis.
Statistical analyses were conducted utilizing R software (version 4.4.0). Continuous variables with normal distributions were analyzed using t-tests, while non-normally distributed continuous variables were evaluated with the Mann-Whitney U test. Categorical variables were compared employing the χ² or Fisher’s exact test, as appropriate. The missing data were entered using multiple imputations with the mice package. SHAP-based variable selection was employed to identify significant predictors of advanced liver fibrosis. Diagnostic performance for the five ML models was evaluated by plotting receiver operating characteristic (ROC) curves and calculating the area under the curve (AUROC). Model comparisons were conducted using DeLong’s test. Clinical utility and diagnostic accuracy were further assessed through decision curve analysis (DCA) and calibration curves. Statistical significance was established at P < 0.05.
A total of 1870 patients with biopsy-confirmed NASH from Beijing Ditan Hospital, Capital Medical University, between January 2010 and January 2020, were initially assessed. After applying the inclusion criteria (Figure 1), 746 eligible patients were included in the final study cohort. This cohort was randomly divided into a training set (n = 522) and a validation set (n = 224) in a 7:3 ratio. Baseline characteristics were comparable between the training and validation sets, with no statistically significant differences observed in age (44.03 years vs 44.65 years), gender distribution (male: 41.32% vs 45.40%), diabetes prevalence (47.51% vs 43.30%), hypertension prevalence (48.08% vs 45.09%), body mass index (28.31 ± 4.63 vs 27.82 ± 4.84), liver fibrosis stage F3 or higher (36.16% vs 37.74%), or other laboratory parameters and non-invasive liver fibrosis scores. Detailed comparisons of baseline characteristics are provided in Table 1.
| Variables | Total (n = 746) | Validation cohort (n = 224) | Training cohort (n = 522) | P value |
| Age (years) | 44.45 ± 15.11 | 44.03 ± 15.51 | 44.62 ± 14.95 | 0.623 |
| Gender | 0.328 | |||
| Female | 416 (55.76) | 131 (58.48) | 285 (54.60) | |
| Male | 330 (44.24) | 93 (41.52) | 237 (45.40) | |
| Hypertension | 352 (47.18) | 101 (45.09) | 251 (48.08) | 0.453 |
| Diabetes | 345 (46.25) | 97 (43.30) | 248 (47.51) | 0.291 |
| Smoking | 137 (18.36) | 35 (15.62) | 102 (19.54) | 0.206 |
| BMI | 28.16 ± 4.70 | 27.82 ± 4.84 | 28.31 ± 4.63 | 0.186 |
| ALT | 101.39 ± 127.91 | 90.11 ± 106.34 | 106.22 ± 135.93 | 0.115 |
| AST | 59.42 ± 77.85 | 50.85 ± 51.24 | 63.09 ± 86.59 | 0.017 |
| Total bilirubin | 16.08 ± 18.76 | 14.76 ± 17.61 | 16.64 ± 19.22 | 0.21 |
| Albumin | 44.04 ± 4.60 | 43.86 ± 4.68 | 44.12 ± 4.57 | 0.474 |
| γ-GGT | 94.74 ± 125.55 | 85.23 ± 117.60 | 98.90 ± 128.77 | 0.183 |
| Creatinine | 4.78 ± 1.26 | 4.77 ± 1.31 | 4.78 ± 1.25 | 0.902 |
| Blood urea nitrogen | 65.03 ± 14.65 | 64.49 ± 14.71 | 65.27 ± 14.64 | 0.51 |
| Leukocyte | 6.35 ± 1.81 | 6.25 ± 1.78 | 6.40 ± 1.83 | 0.317 |
| Platelet | 224.33 ± 71.99 | 227.77 ± 78.80 | 222.87 ± 68.92 | 0.422 |
| INR | 2.23 ± 9.44 | 3.22 ± 13.71 | 1.79 ± 6.77 | 0.059 |
| Total cholesterol | 4.77 ± 0.97 | 4.78 ± 0.98 | 4.76 ± 0.96 | 0.74 |
| Triglyceride | 2.23 ± 1.26 | 2.28 ± 1.33 | 2.21 ± 1.23 | 0.477 |
| Complement C3 | 1.10 ± 0.34 | 1.09 ± 0.35 | 1.10 ± 0.33 | 0.704 |
| Complement C4 | 0.23 ± 0.08 | 0.21 ± 0.06 | 0.23 ± 0.09 | 0.015 |
| HbA1c | 7.28 ± 2.58 | 7.16 ± 2.52 | 7.34 ± 2.60 | 0.504 |
| VCTE-CAP | 296.03 ± 46.89 | 299.15 ± 49.03 | 294.80 ± 46.04 | 0.385 |
| VCTE-LSM | 9.02 ± 5.05 | 9.56 ± 6.81 | 8.81 ± 4.15 | 0.166 |
| APRI | 0.33 ± 0.61 | 0.29 ± 0.40 | 0.35 ± 0.69 | 0.218 |
| FIB-4 | 241.40 ± 915.28 | 299.15 ± 49.03 | 227.76 ± 1017.03 | 0.437 |
| F3/F4 | 278 (37.27) | 81 (36.16) | 197 (37.74) | 0.683 |
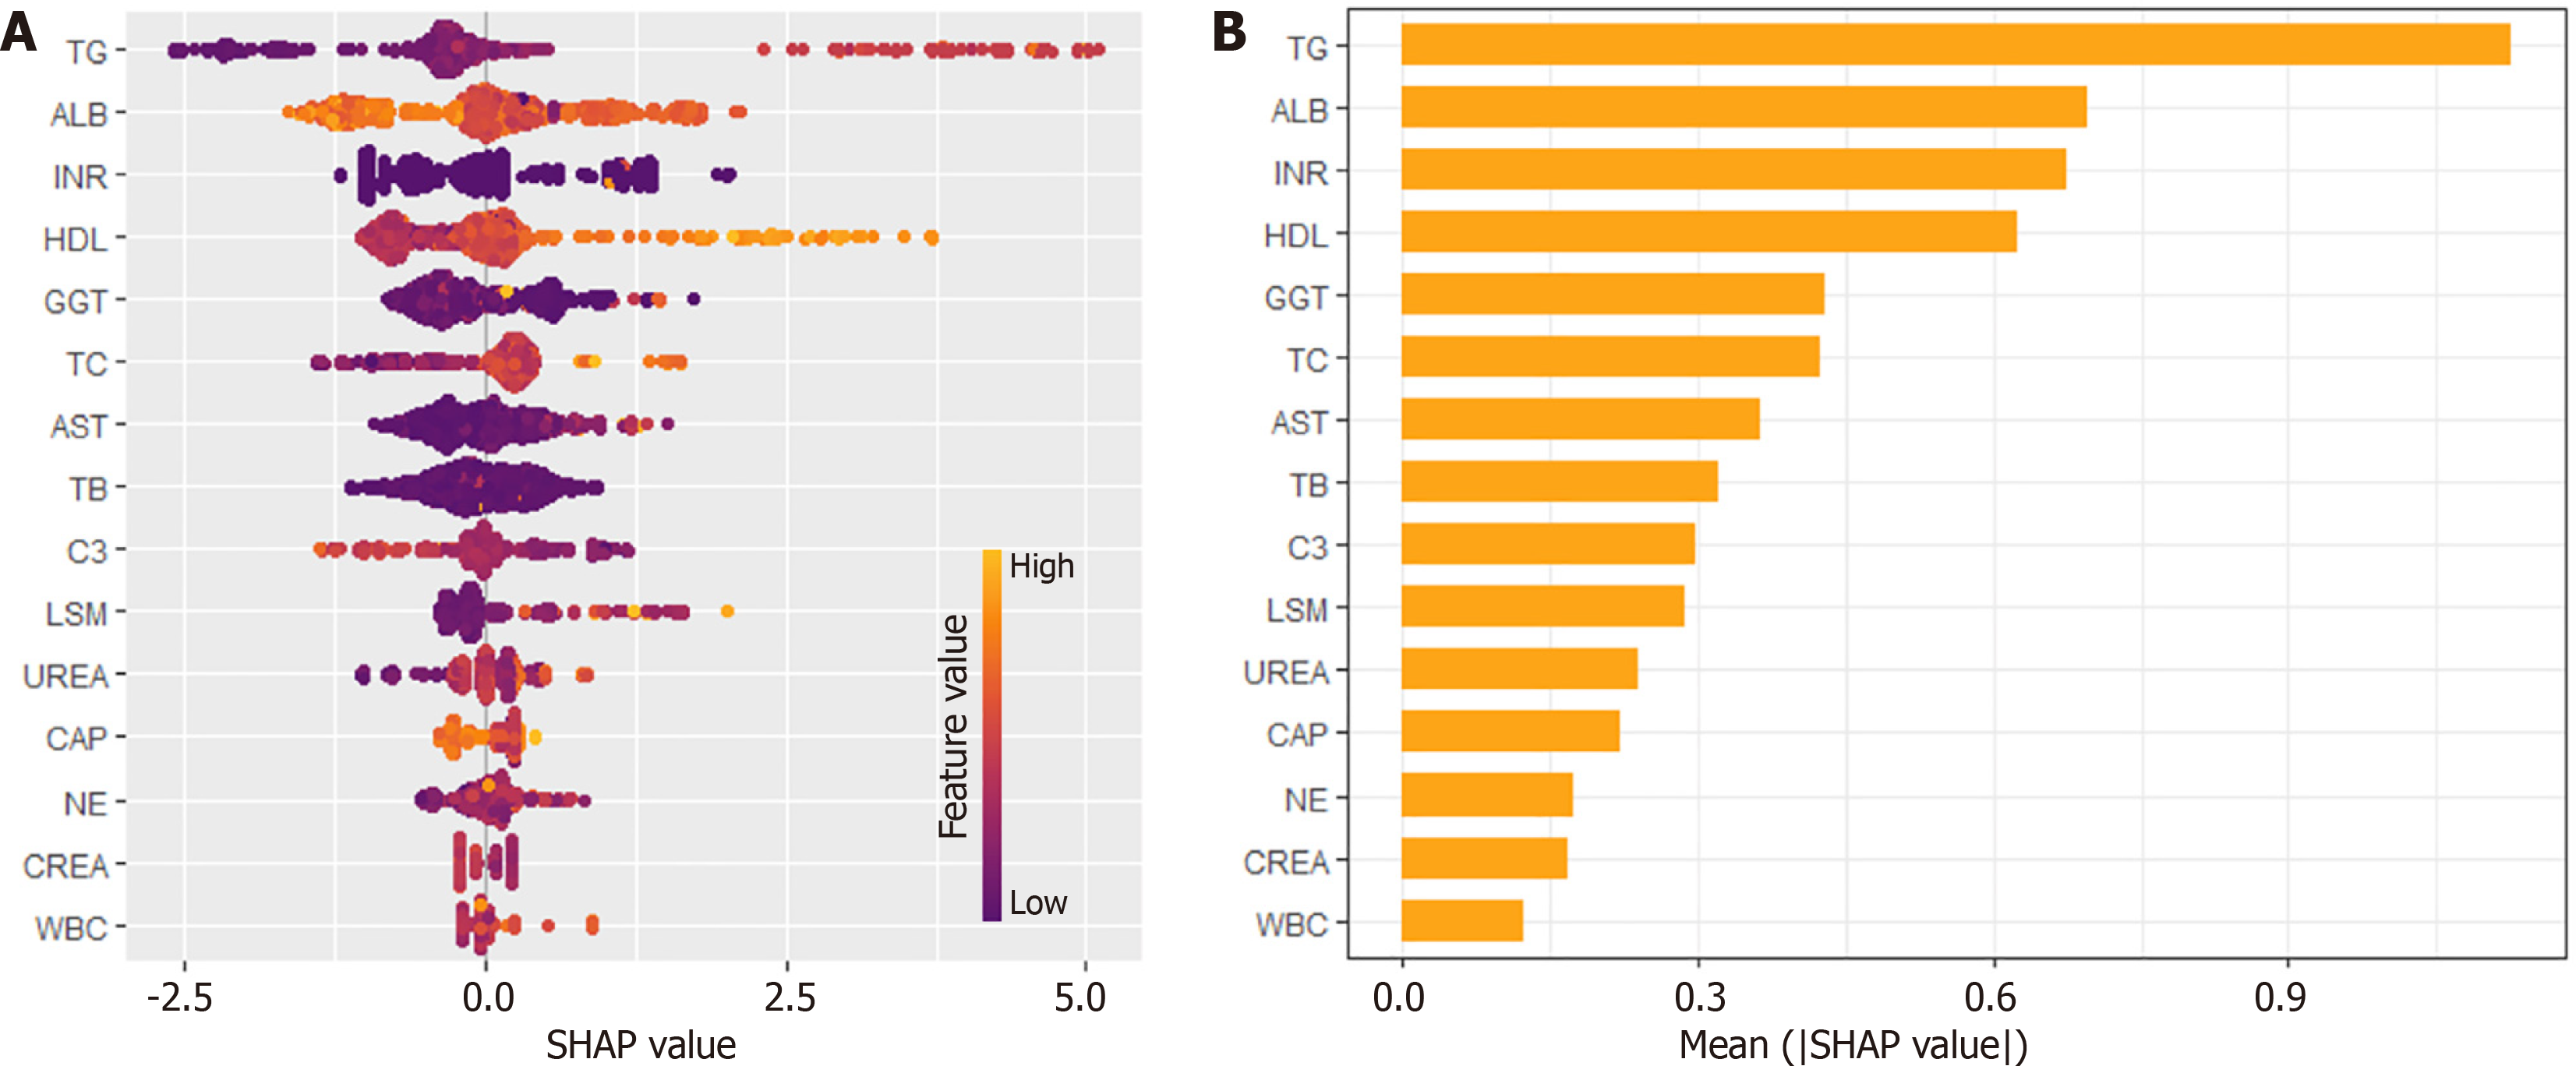
SHAP analysis was initially employed to select relevant variables from the training set, identifying key laboratory indicators for diagnosing F3/F4 Liver fibrosis (Figure 2A). The top four indicators-triglycerides (TG), albumin (ALB), international normalized ratio (INR), and high-density lipoprotein (HDL)-were chosen based on their importance ranking (Figure 2B). These variables were subsequently used to construct diagnostic models using LR, RF, SVM, XGBoost, and NB methods.
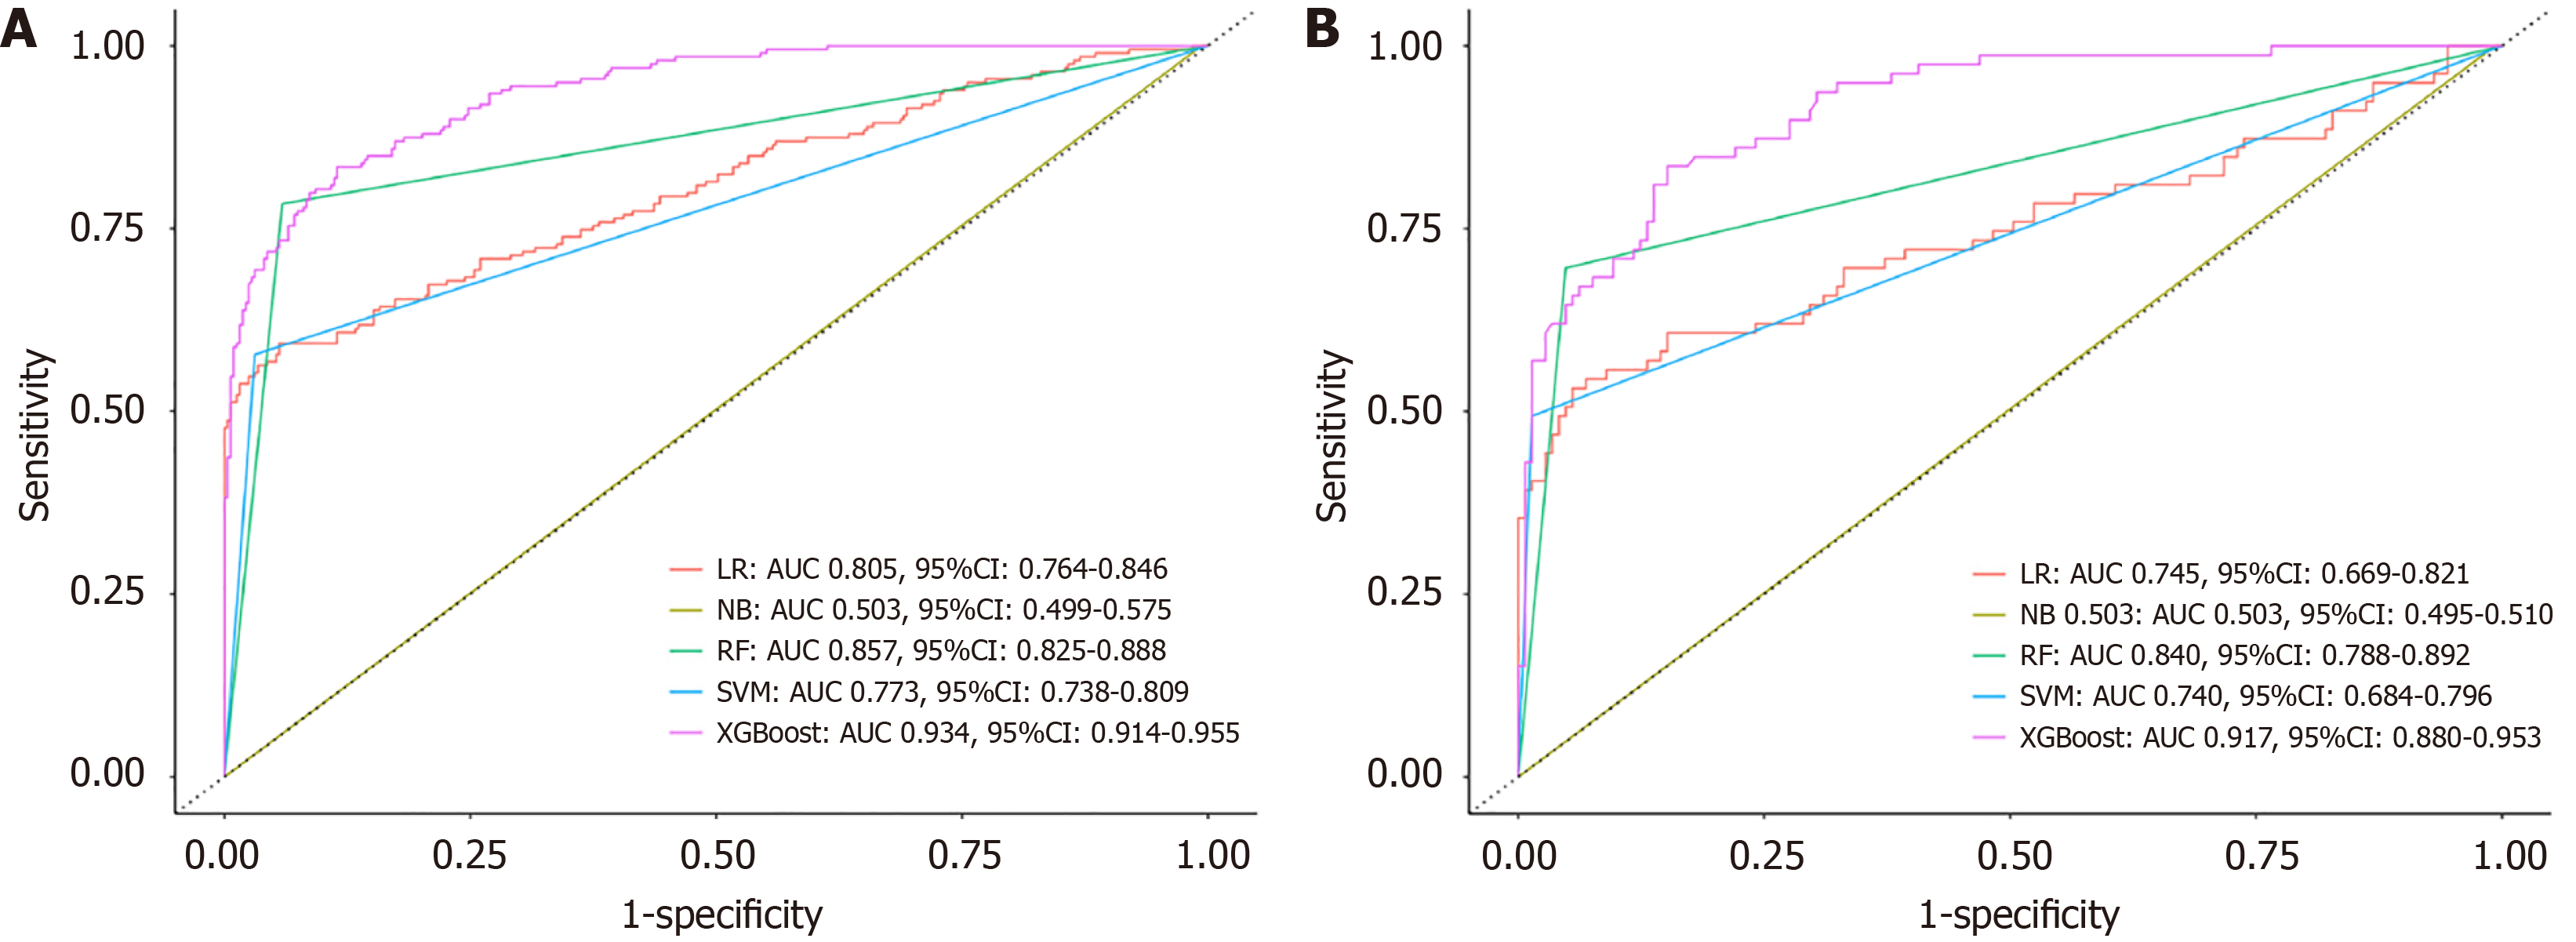
In the training set, the LR model achieved an AUROC of 0.805 (95%CI: 0.764-0.846), with a sensitivity (SE) of 0.901, SP of 0.593, positive predictive value (PPV) of 0.782, and negative predictive value (NPV) of 0.787. The RF model showed improved performance, with an AUROC of 0.857 (95%CI: 0.825-0.888), SE of 0.944, SP of 0.720, PPV of 0.869, and NPV of 0.894. The SVM model recorded an AUROC of 0.773 (95%CI: 0.738-0.809), SE of 0.969, SP of 0.578, PPV of 0.789, and NPV of 0.920. The NB model demonstrated poor performance, with an AUROC of only 0.503 (95%CI: 0.499-0.575), SE of 0.006, SP of 1.000, PPV of 1.000, and NPV of 0.384. The XGBoost model outperformed all others, achieving an AUROC of 0.934 (95%CI: 0.914-0.955), SE of 0.935, SP of 0.744, PPV of 0.856, and NPV of 0.876, significantly surpassing the performance of other models (P < 0.001; Figure 3A and Table 2).
| Cohort | Models | Accuracy | Area under receiver operating characteristic curve | F1 scores | Sensitivity | Specificity | Positive predictive value | Negative predictive value | P value |
| Training | XGB | 0.862 (0.830-0.891) | 0.934 (0.914-0.955) | 0.838 | 0.958 | 0.744 | 0.856 | 0.876 | |
| RF | 0.877 (0.846-0.904) | 0.857 (0.825-0.888) | 0.817 | 0.944 | 0.72 | 0.869 | 0.894 | < 0.001 | |
| SVM | 0.8199 (0.784-0.852) | 0.773 (0.738-0.809) | 0.724 | 0.969 | 0.578 | 0.789 | 0.92 | < 0.001 | |
| LR | 0.784 (0.746-0.818) | 0.805 (0.764-0.846) | 0.715 | 0.901 | 0.593 | 0.782 | 0.787 | < 0.001 | |
| NB | 0.385 (0.343-0.428) | 0.503 (0.499-0.575) | 0.012 | 0.006 | 1 | 1 | 0.383 | < 0.001 | |
| Validation | XGB | 0.853 (0.799-0.896) | 0.917 (0.880-0.953) | 0.78 | 0.959 | 0.658 | 0.837 | 0.897 | |
| RF | 0.875 (0.824-0.915) | 0.840 (0.788-0.892) | 0.758 | 0.959 | 0.626 | 0.863 | 0.905 | < 0.001 | |
| SVM | 0.813 (0.755-0.861) | 0.740 (0.684-0.796) | 0.658 | 0.986 | 0.494 | 0.784 | 0.951 | < 0.001 | |
| LR | 0.790 (0.731-0.842) | 0.745 (0.669-0.821) | 0.641 | 0.959 | 0.481 | 0.772 | 0.864 | < 0.001 | |
| NB | 0.357 (0.294-0.424) | 0.503 (0.495-0.510) | 0.014 | 0.007 | 1 | 1 | 0.354 | < 0.001 |
In the validation set, the LR model achieved an AUROC of 0.745 (95%CI: 0.669-0.821), SE of 0.959, SP of 0.481, PPV of 0.772, and NPV of 0.864. The RF model demonstrated better performance with an AUROC of 0.840 (95%CI: 0.788-0.892), SE of 0.959, SP of 0.626, PPV of 0.863, and NPV of 0.905. The SVM model had an AUROC of 0.740 (95%CI: 0.684-0.796), SE of 0.986, SP of 0.494, PPV of 0.784, and NPV of 0.951. The NB model continued to show poor diagnostic ability, with an AUROC of 0.503 (95%CI: 0.495-0.510), SE of 0.007, SP of 1.000, PPV of 1.000, and NPV of 0.354. Once again, the XGBoost model demonstrated the best performance, achieving an AUROC of 0.917 (95%CI: 0.880-0.953), SE of 0.959, SP of 0.658, PPV of 0.837, and NPV of 0.897, with statistically significant differences compared to other models (P < 0.001; Figure 3B and Table 2).
The XGBoost model demonstrated superior diagnostic accuracy in both the training and validation sets, significantly outperforming the other ML models. To facilitate clinical application, a visual web tool was developed (https://model.math.ink/NASH-xfx/index.html), allowing clinicians to input TG, ALB, INR, and HDL levels to evaluate the risk of advanced liver fibrosis (F3/F4 stage), thereby improving patient management.
Clinically, non-invasive assessments of liver fibrosis in NASH patients primarily rely on LSM and diagnostic models such as APRI and FIB-4. To evaluate its performance, the XGBoost model (using TG, ALB, INR, and HDL) was compared with the XGBoost + LSM model, APRI, and FIB-4 scores.
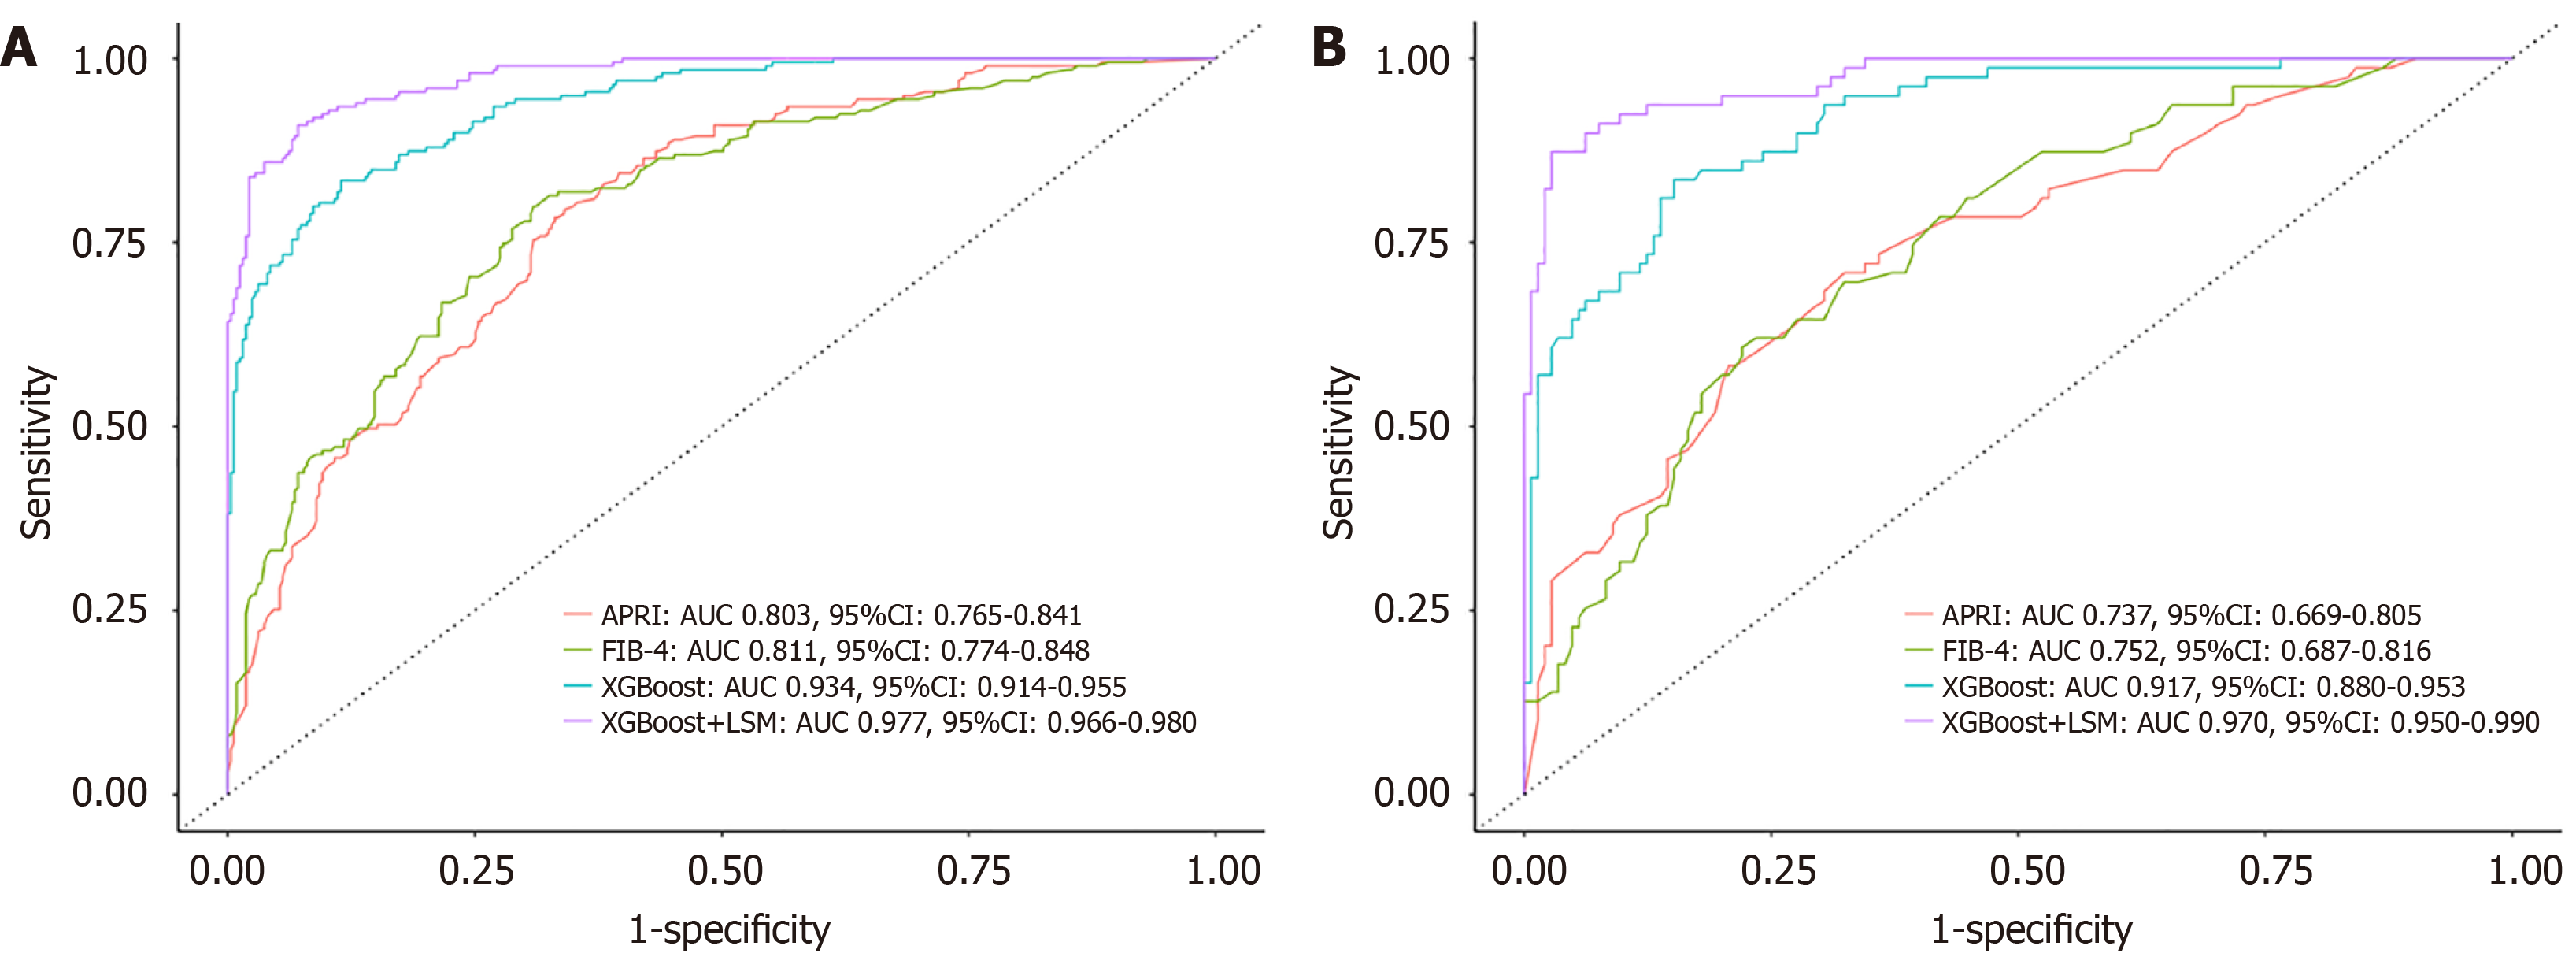
In the training set, the XGBoost + LSM model achieved an AUROC of 0.977 (95%CI: 0.966-0.980), SE of 0.985, SP of 0.758, PPV of 0.837, and NPV of 0.929. By comparison, APRI recorded an AUROC of 0.803 (95%CI: 0.765-0.841), SE of 0.907, SP of 0.402, PPV of 0.711, and NPV of 0.727, while FIB-4 had an AUROC of 0.811 (95%CI: 0.774-0.848), SE of 0.898, SP of 0.467, PPV of 0.732, and NPV of 0.738 (Figure 4A and Table 3). The diagnostic accuracy of the XGBoost model was significantly higher than APRI and FIB-4 (P < 0.001), and its performance improved further with the inclusion of LSM (P < 0.001; Table 3).
| Cohort | Models | Accuracy | Area under receiver operating characteristic curve | Sensitivity | Specificity | Positive predictive value | Negative predictive value | P value |
| Training | XGB | 0.810 (0.764-0.841) | 0.934 (0.914-0.955) | 0.958 | 0.744 | 0.786 | 0.914 | |
| XGB + LSM | 0.844 (0.7815-0.898) | 0.977 (0.966-0.980) | 0.985 | 0.758 | 0.837 | 0.929 | < 0.001 | |
| APRI | 0.715 (0.674-0.753) | 0.803 (0.765-0.841) | 0.907 | 0.402 | 0.711 | 0.727 | < 0.001 | |
| FIB-4 | 0.734 (0.774-0.848) | 0.811 (0.774-0.848) | 0.898 | 0.467 | 0.732 | 0.738 | < 0.001 | |
| Validation | XGB | 0.794 (0.765-0.862) | 0.917 (0.880-0.953) | 0.925 | 0.658 | 0.756 | 0.884 | |
| XGB + LSM | 0.821 (0.755-0.880) | 0.970 (0.950-0.990) | 0.954 | 0.739 | 0.81 | 0.908 | < 0.001 | |
| APRI | 0.710 (0.646-0.769) | 0.737 (0.669-0.805) | 0.917 | 0.329 | 0.715 | 0.684 | < 0.001 | |
| FIB-4 | 0.688 (0.622-0.748) | 0.752 (0.687-0.816) | 0.912 | 0.165 | 0.681 | 0.765 | < 0.001 |
Similar results were observed in the validation set. The XGBoost + LSM model demonstrated an AUROC of 0.970 (95%CI: 0.950-0.990), SE of 0.954, SP of 0.739, PPV of 0.810, and NPV of 0.908. In contrast, APRI achieved an AUROC of 0.737 (95%CI: 0.669-0.805), SE of 0.917, SP of 0.329, PPV of 0.715, and NPV of 0.684, while FIB-4 achieved an AUROC of 0.752 (95%CI: 0.687-0.816), SE of 0.912, SP of 0.165, PPV of 0.681, and NPV of 0.765 (Figure 4B and Table 3). Incorporating LSM into the XGBoost model significantly enhanced its diagnostic efficiency in both datasets.
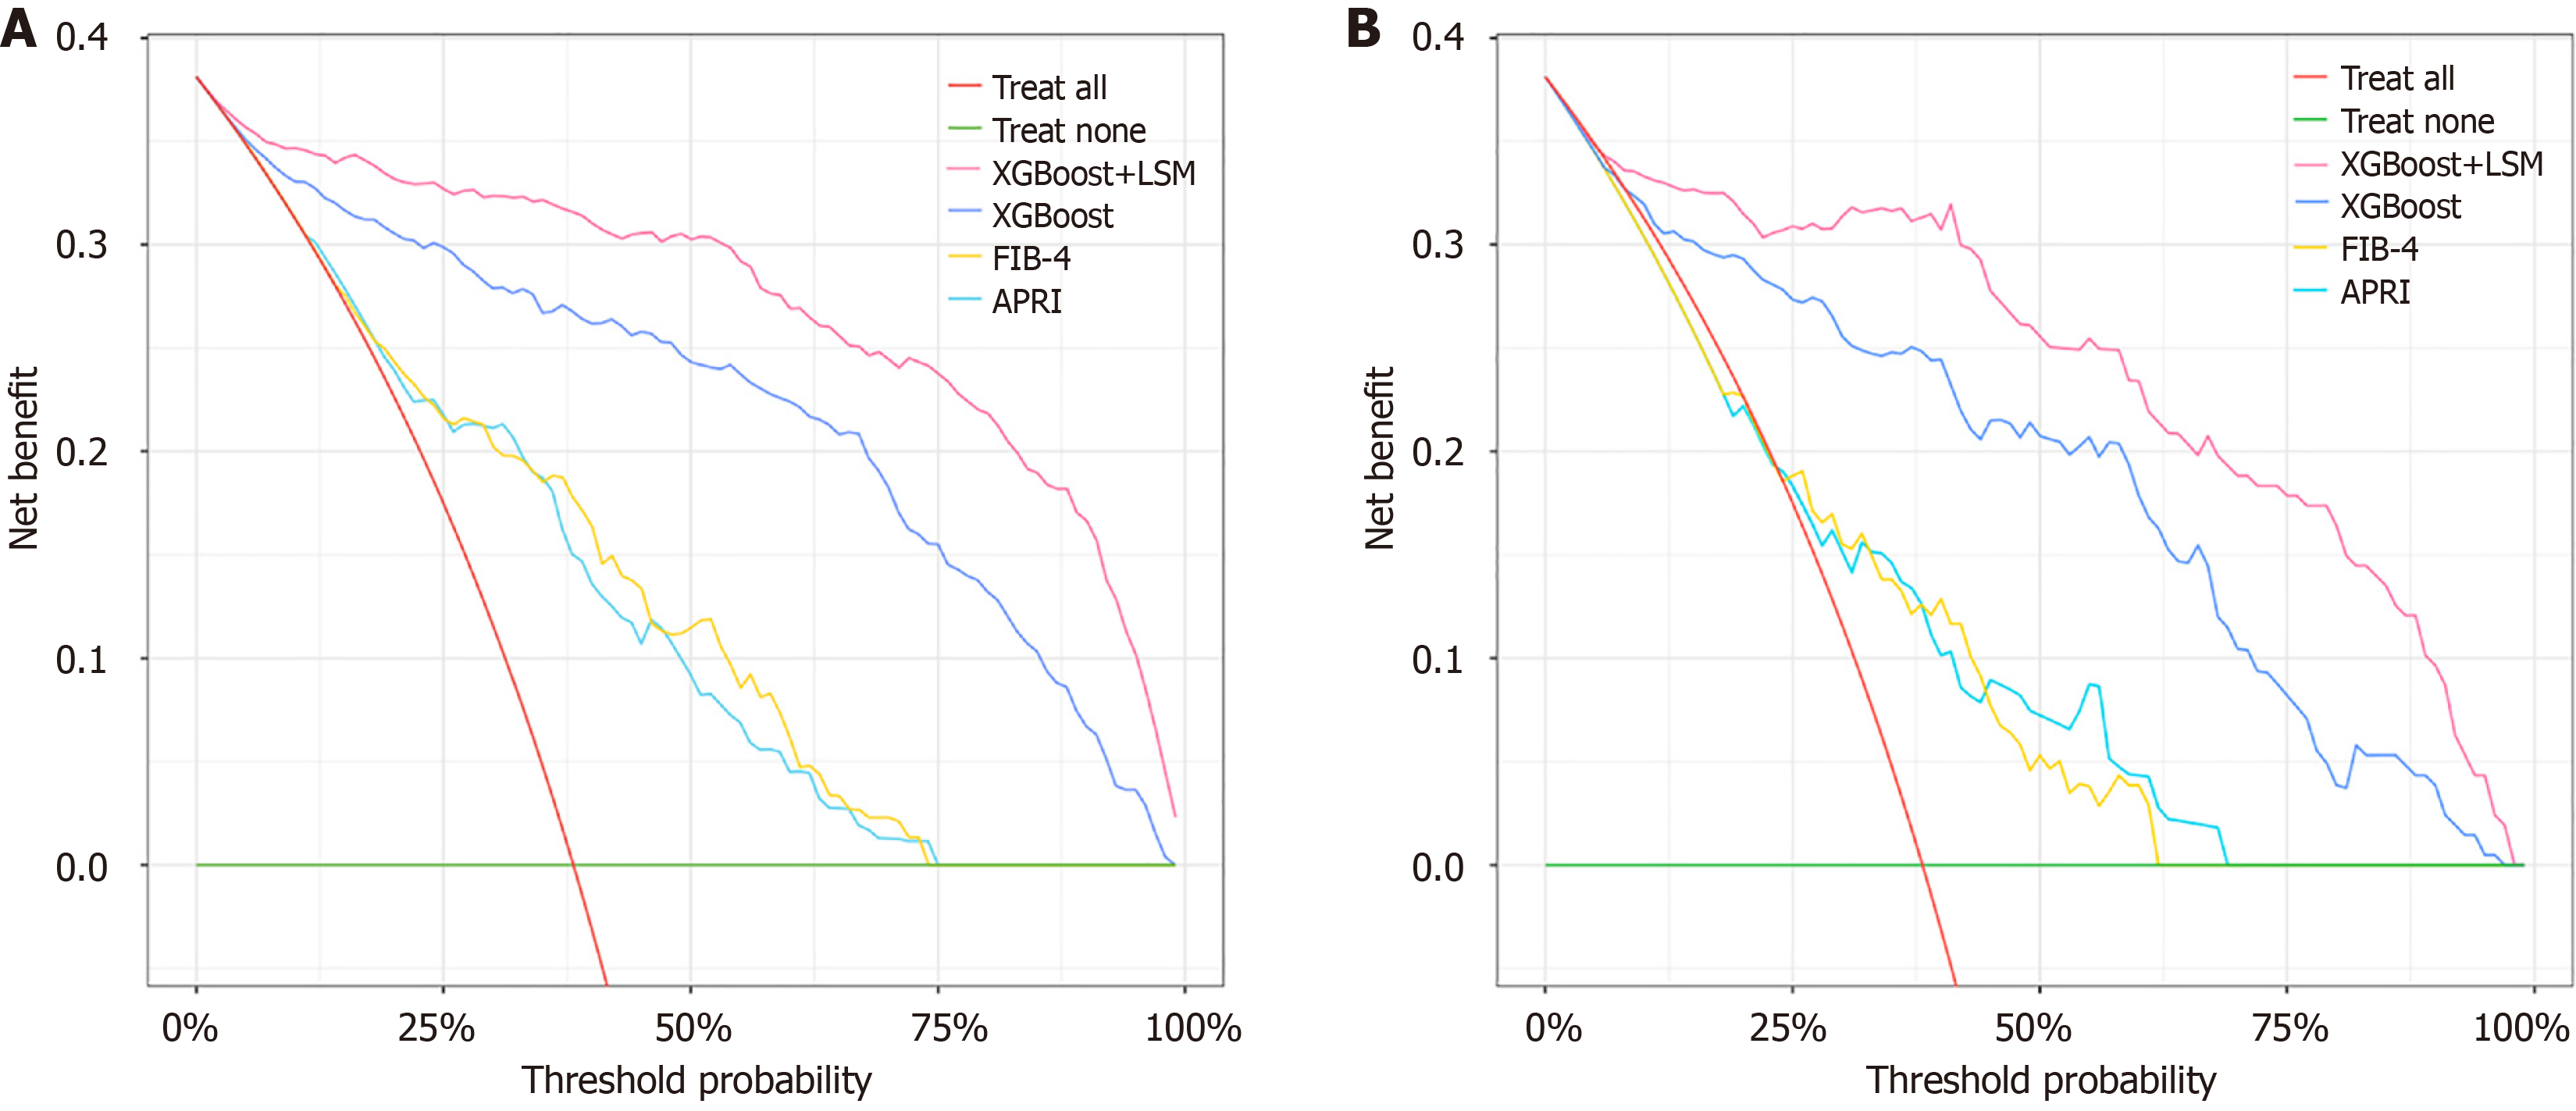
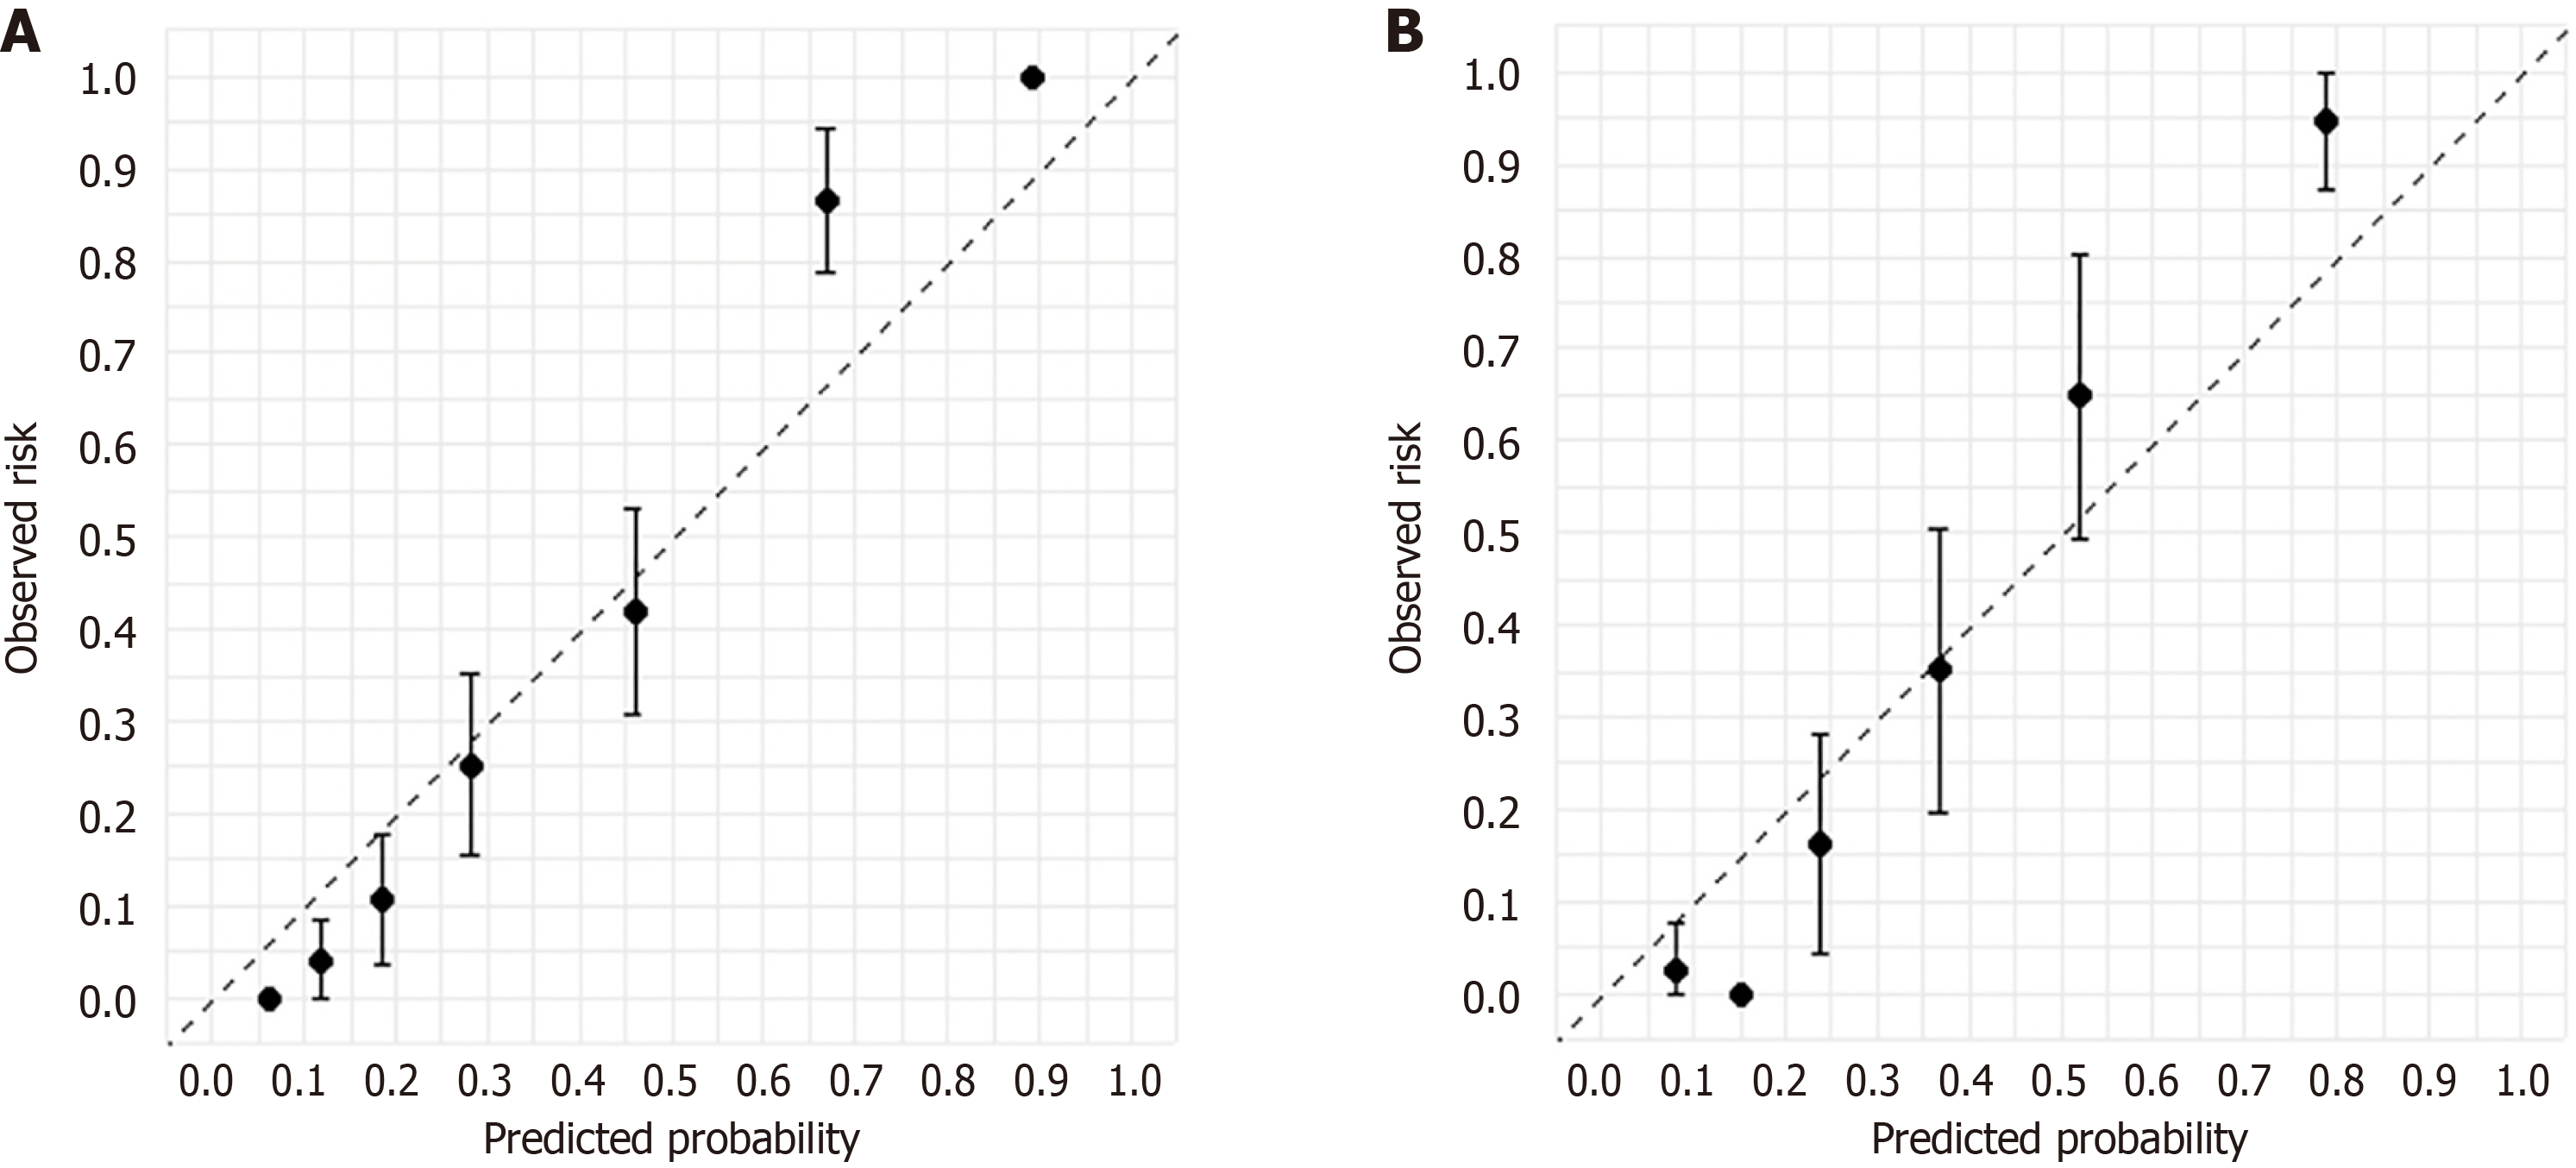
DCA and calibration curves were used to assess the performance of the diagnostic models. In the training set, the XGBoost model outperformed APRI and FIB-4 in decision-making performance. Adding LSM further improved the decision-making efficacy of the XGBoost + LSM model (Figure 5A). Similar results were observed in the validation set, confirming the enhanced clinical utility of both XGBoost and XGBoost + LSM (Figure 5B). Calibration curves for the XGBoost model in both the training (Figure 6A) and validation sets (Figure 6B) demonstrated strong concordance between predicted and actual outcomes for F3/F4 liver fibrosis.
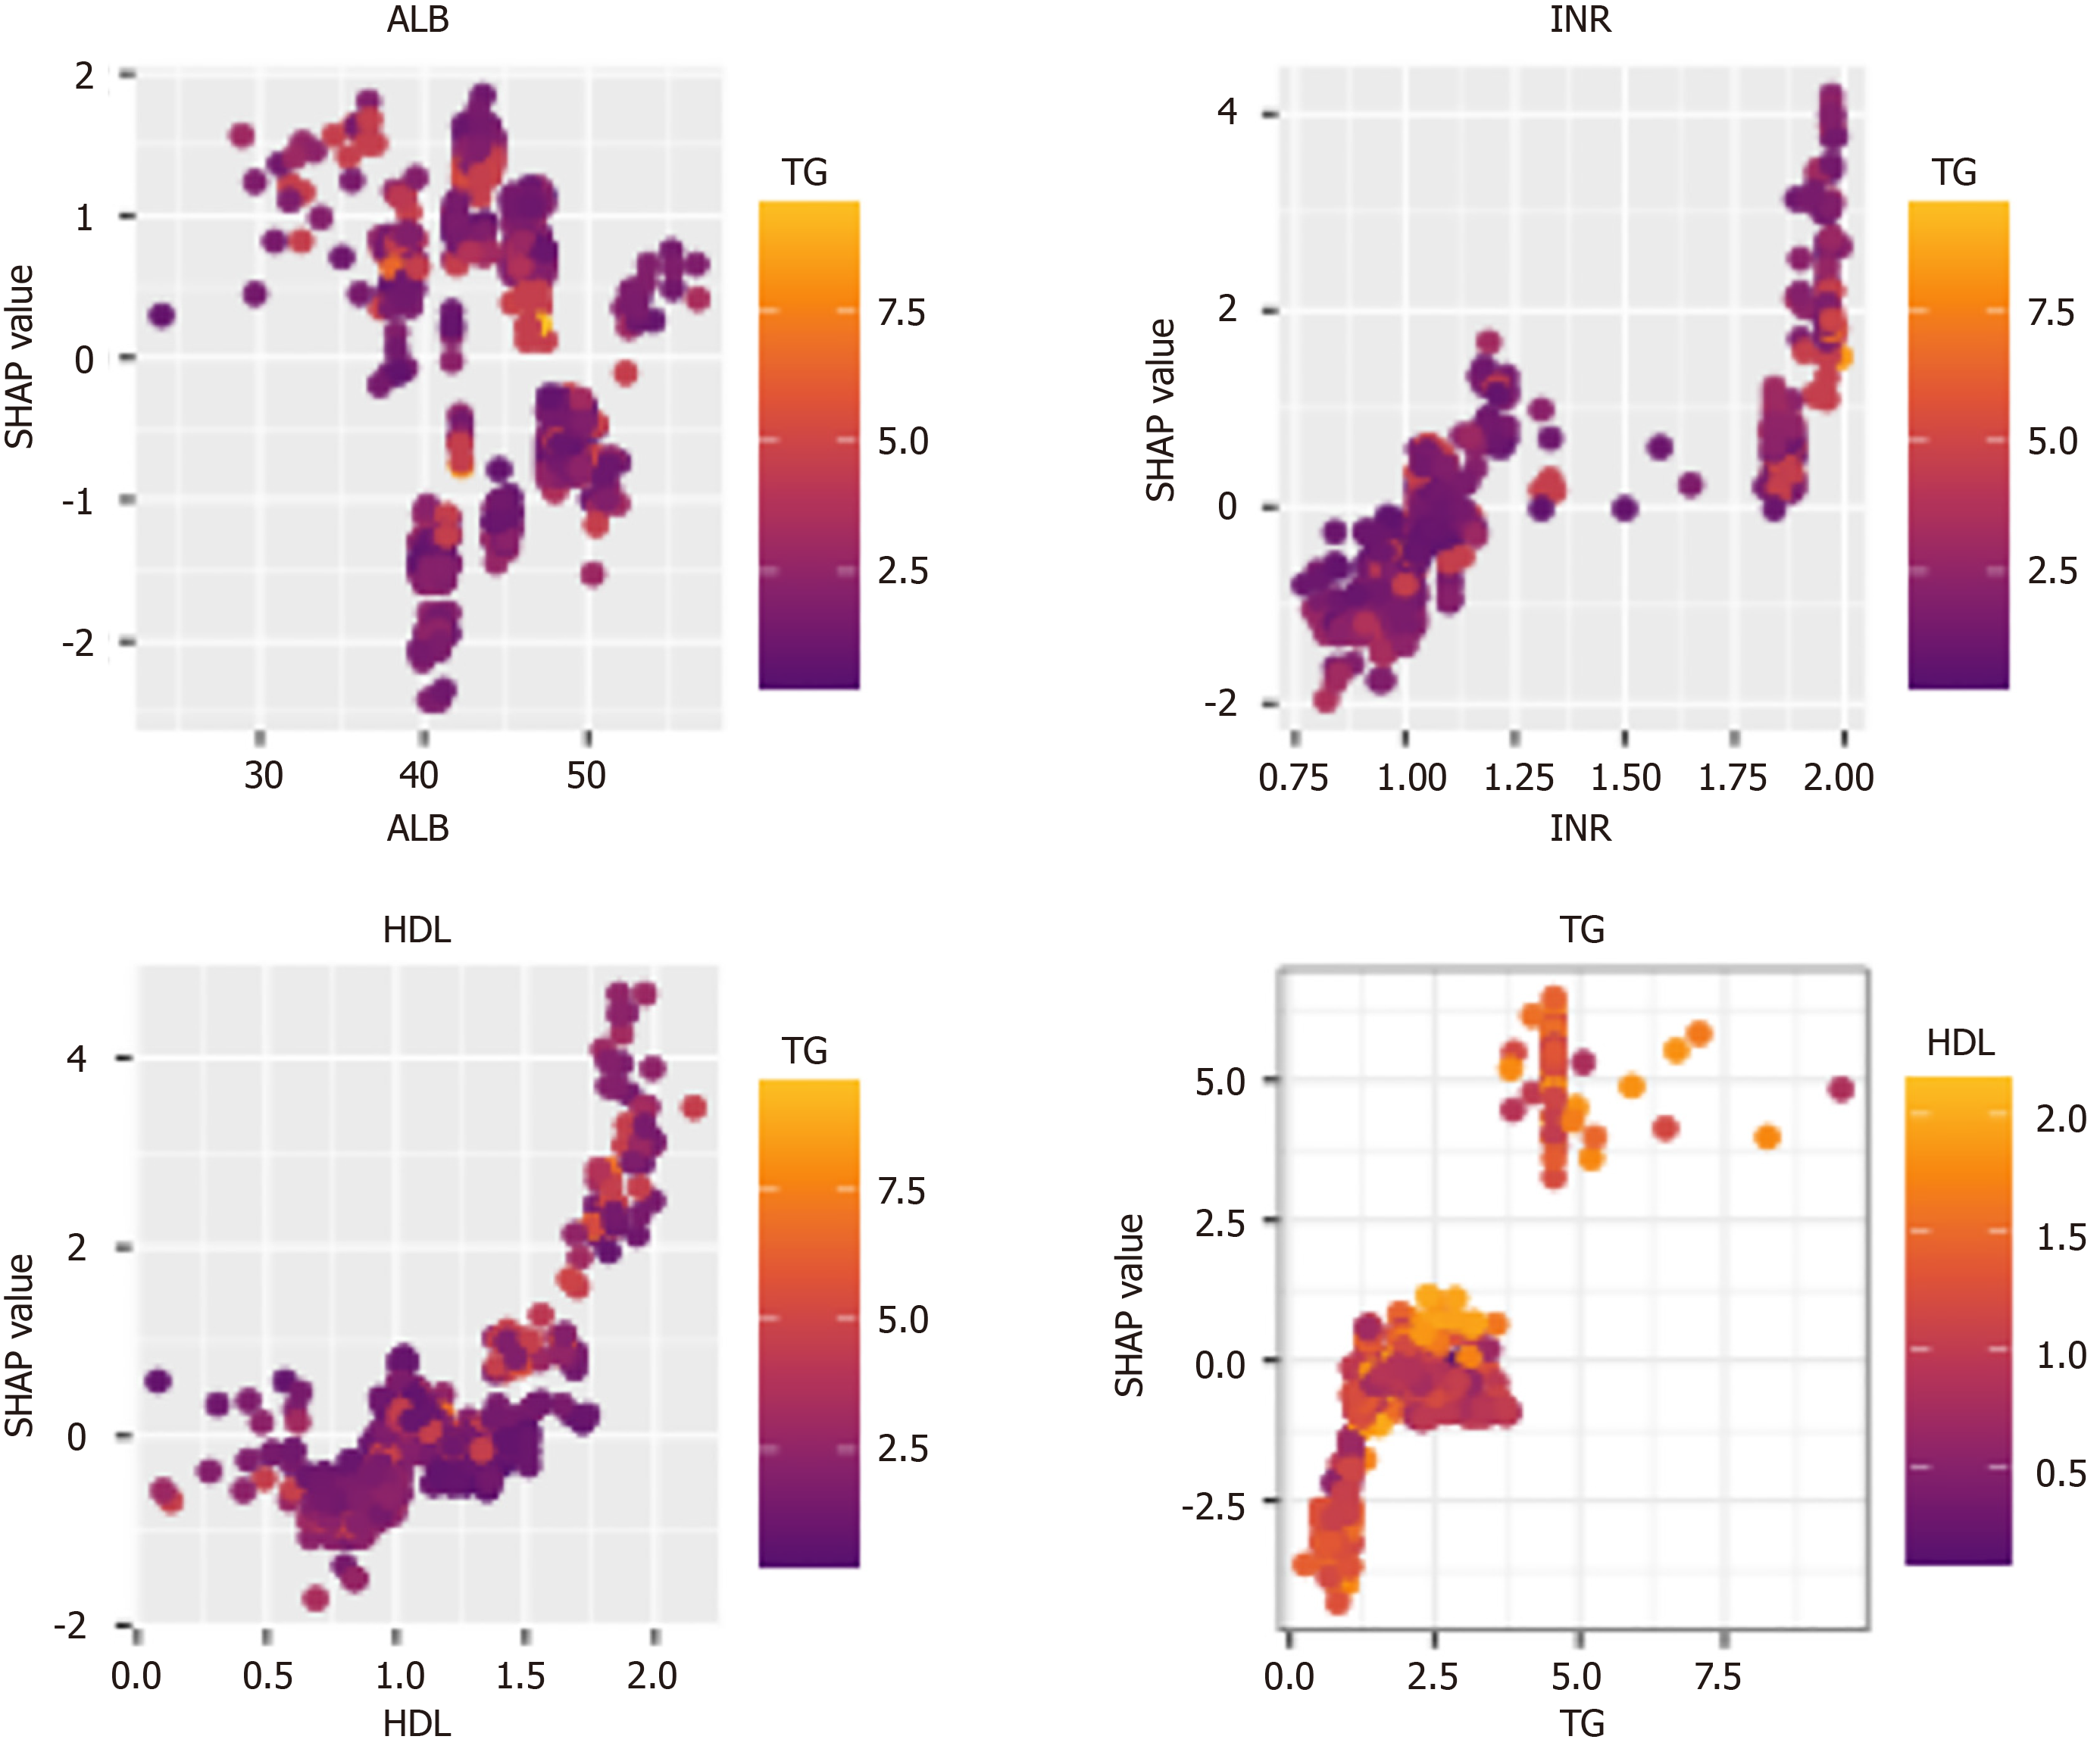
To clarify the model's scope of applicability, SHAP values were used to provide local explanations for the XGBoost model. The analysis revealed that higher SHAP values were associated with specific clinical features: ALB below 35 g/L, INR between 1.75 and 2.00, HDL between 1.5 and 2.0 mmol/L, and TG above 5.0 mmol/L (Figure 7). In patients with these characteristics, the model may offer greater clinical benefits, aiding in precise and individualized decision-making.
This study developed and validated an XGBoost ML model for diagnosing advanced liver fibrosis (F3/F4 stages) in patients with NASH, using SHAP for variable selection. The XGBoost model demonstrated superior diagnostic performance compared to other commonly used ML models. By incorporating LSM into the framework, the XGBoost + LSM model achieved even greater diagnostic accuracy, outperforming non-invasive clinical scores such as APRI and FIB-4. Clinical utility was further supported by DCA and calibration curves, which showed improved net benefits in both training and validation cohorts. Additionally, the model demonstrated its strongest applicability when patients had specific clinical characteristics: ALB below 35 g/L, INR between 1.75 and 2.00, HDL between 1.5 and 2.0 mmol/L, and TG above 5.0 mmol/L.
Non-invasive assessment of liver fibrosis remains a significant challenge in clinical practice. Previous studies have explored non-invasive models based on imaging techniques. For instance, a LR model utilizing ultrasound images in rats with early- and late-stage liver fibrosis achieved an AUROC of 0.950[18]. Similarly, a deep learning model based on 2D ultrasound elastography in hepatitis B patients reported an AUROC of 0.980 for diagnosing fibrosis at F3 stage or higher[19]. Additionally, an SVM model using liver MRI imaging achieved an accuracy of 0.837 in diagnosing advanced fibrosis[20]. However, these imaging-based models depend on advanced imaging modalities that may not be widely available in resource-limited settings, restricting their practical utility. In contrast, the XGBoost model developed in this study relies solely on routine serological markers, making it more accessible for broader clinical application. Furthermore, the incorporation of LSM, where available, significantly enhances the model’s diagnostic accuracy.
ML models utilizing only serological markers have shown promising efficacy in diagnosing liver fibrosis in patients with NASH. Studies have demonstrated that RF, LR, and SVM models using serological markers outperform traditional non-invasive scores such as APRI and FIB-4 in diagnosing fibrosis at stage ≥ F3[21-23]. In our study, the XGBoost algorithm displayed superior computational capabilities and feature weighting, making it highly effective for managing large datasets with improved flexibility and regularization. Compared to the RF and SVM models, XGBoost demonstrated greater efficiency in feature selection, importance ranking, and processing high-dimensional data[24,25]. This capability allows the XGBoost-based diagnostic model to evaluate variable weights with precision, providing a comprehensive analysis that closely aligns with the clinical characteristics of NASH patients.
Our study utilized SHAP to rank the importance of variables for diagnosing advanced liver fibrosis, ultimately selecting TG, ALB, INR, and HDL for model development. TG and HDL are key metabolic markers that reflect blood lipid levels and are closely associated with liver fibrosis[26]. Previous evidence has demonstrated that TG and HDL-C are independent factors contributing to elevated LSM in patients with liver disease, which is strongly linked to fibrosis. A high TG/HDL-C ratio is recognized as an independent predictor of liver fibrosis in NASH patients[27]. TG contributes to fibrosis through multiple mechanisms. For instance, ATP-citrate lyase (ACLY), an enzyme involved in hepatic lipid synthesis, has been identified as a significant factor in fibrosis progression. Inhibiting ACLY reduces TG levels and alleviates liver fibrosis, while TG levels are also associated with specific biomarkers of NASH[28]. Additionally, medium-chain TG and their receptor, G protein-coupled receptor 84 (GPR84), play a critical role in the progression of NASH-related liver fibrosis. Research has demonstrated that supplementing mice with GPR84 mitigates lipotoxicity and macrophage overactivation, thereby reducing NASH severity and fibrosis[29]. Similarly, HDL is strongly associated with liver fibrosis. A study investigating HDL-C-binding proteins in advanced NASH patients found reduced levels of five binding proteins in those with advanced fibrosis, a pattern not observed in non-NASH patients[30]. Moreover, HDL has been shown to predict the risk of HCC in NASH patients and is a prognostic marker for individuals with chronic liver failure[31,32].
ALB is a key marker of the liver's synthetic function, with decreased levels often signaling liver dysfunction. It has also been recognized as a predictor of advanced liver fibrosis in NASH patients[33]. Research indicates that ALB can inhibit fibrosis progression by promoting the uptake of activated hepatic stellate cells[34]. Additionally, it has been documented that combining ALB with pharmacological treatments significantly reduces inflammatory cell infiltration and fibrosis around bile ducts caused by carbon tetrachloride. This combination therapy also lowers hydroxyproline levels and inhibits the mRNA expression of transforming growth factor-β and its downstream fibrosis-related genes[35]. These findings provide a strong scientific basis for including ALB as a diagnostic criterion for advanced liver fibrosis in NASH patients.
Coagulation function is closely tied to liver function, and abnormalities in coagulation often reflect structural liver damage. The INR, a marker of coagulation function, has been shown to predict liver fibrosis effectively. In hepatitis B patients, INR demonstrated an AUROC of 0.760 for diagnosing advanced liver fibrosis, outperforming the APRI and FIB-4 scores[36]. Beyond its predictive value for fibrosis, INR also serves as a risk factor for disease decompensation and progression to HCC in non-alcoholic fatty liver disease patients[37]. Abnormalities in the coagulation system, including fibrinogen-related inflammatory damage and prothrombin gene polymorphisms, contribute to fibrosis progression and highlight the interplay between coagulation dysfunction and liver disease. These findings support the inclusion of INR in the XGBoost model used in this study for diagnosing advanced liver fibrosis.
This study has several limitations. First, it is a single-center study, and further research is needed to determine the generalizability of the findings to patients from other regions or ethnic groups. Second, a larger sample size is necessary to enhance the model's diagnostic performance and make it more applicable to the general population. Lastly, as a retrospective study, missing data on patients’ medical histories and blood test results may introduce selection bias. Future prospective, multi-center studies with larger sample sizes are essential to refine the non-invasive diagnostic model for NASH and improve its clinical utility.
In conclusion, our study developed two non-invasive diagnostic models for advanced liver fibrosis in NASH patients using the XGBoost algorithm and created an online tool to assist clinicians in evaluating patients’ conditions based on laboratory results. Compared to other ML models, the XGBoost model demonstrated superior diagnostic performance, emphasizing the unique contribution of this study.
This study systematically compared five ML methods to develop a model for diagnosing advanced liver fibrosis in NASH patients. The XGBoost-based model outperformed others in terms of accuracy and clinical applicability. An online tool was also developed to calculate fibrosis risk, facilitating its use in clinical practice. The model’s accuracy was further validated through DCA and calibration curves. Additionally, a model incorporating LSM data was provided for settings where such measurements are available, offering flexibility in patient management.
We gratefully recognize the patients who participated in this study.
| 1. | Younossi ZM, Golabi P, Paik JM, Henry A, Van Dongen C, Henry L. The global epidemiology of nonalcoholic fatty liver disease (NAFLD) and nonalcoholic steatohepatitis (NASH): a systematic review. Hepatology. 2023;77:1335-1347. [RCA] [PubMed] [DOI] [Full Text] [Full Text (PDF)] [Cited by in Crossref: 270] [Cited by in RCA: 1454] [Article Influence: 727.0] [Reference Citation Analysis (2)] |
| 2. | Man S, Deng Y, Ma Y, Fu J, Bao H, Yu C, Lv J, Liu H, Wang B, Li L. Prevalence of Liver Steatosis and Fibrosis in the General Population and Various High-Risk Populations: A Nationwide Study With 5.7 Million Adults in China. Gastroenterology. 2023;165:1025-1040. [RCA] [PubMed] [DOI] [Full Text] [Cited by in Crossref: 21] [Cited by in RCA: 81] [Article Influence: 40.5] [Reference Citation Analysis (0)] |
| 3. | Behari J, Gougol A, Wang R, Luu HN, Paragomi P, Yu YC, Molinari M, Chopra K, Malik SM, Geller D, Yuan JM. Incidence of hepatocellular carcinoma in nonalcoholic fatty liver disease without cirrhosis or advanced liver fibrosis. Hepatol Commun. 2023;7. [RCA] [PubMed] [DOI] [Full Text] [Cited by in RCA: 20] [Reference Citation Analysis (0)] |
| 4. | Kong AP, Lau ES, O CK, Luk AO, Yip TC, Chow EY, Kwok R, Lee HW, Wong GL, Ma RC, Chan HL, Wong VW, Chan JC. Advanced liver fibrosis predicts heart failure and hospitalizations in people with type 2 diabetes: A prospective cohort study from Hong Kong Diabetes Register. Diabetes Res Clin Pract. 2023;202:110825. [RCA] [PubMed] [DOI] [Full Text] [Reference Citation Analysis (0)] |
| 5. | Mantovani A, Csermely A, Petracca G, Beatrice G, Corey KE, Simon TG, Byrne CD, Targher G. Non-alcoholic fatty liver disease and risk of fatal and non-fatal cardiovascular events: an updated systematic review and meta-analysis. Lancet Gastroenterol Hepatol. 2021;6:903-913. [RCA] [PubMed] [DOI] [Full Text] [Cited by in Crossref: 57] [Cited by in RCA: 368] [Article Influence: 92.0] [Reference Citation Analysis (0)] |
| 6. | Baik M, Nam HS, Heo JH, Park HJ, Kim BK, Park JY, Kim DY, Ahn SH, Han KH, Lee HS, Kim SU, Kim YD. Advanced Liver Fibrosis Predicts Unfavorable Long-Term Prognosis in First-Ever Ischemic Stroke or Transient Ischemic Attack. Cerebrovasc Dis. 2020;49:474-480. [RCA] [PubMed] [DOI] [Full Text] [Cited by in Crossref: 25] [Cited by in RCA: 25] [Article Influence: 5.0] [Reference Citation Analysis (0)] |
| 7. | Song ZZ. Acute viral hepatitis increases liver stiffness values measured by transient elastography. Hepatology. 2008;48:349-50; author reply 350. [RCA] [PubMed] [DOI] [Full Text] [Cited by in Crossref: 10] [Cited by in RCA: 11] [Article Influence: 0.6] [Reference Citation Analysis (0)] |
| 8. | Huang LL, Yu XP, Li JL, Lin HM, Kang NL, Jiang JJ, Zhu YY, Liu YR, Zeng DW. Effect of liver inflammation on accuracy of FibroScan device in assessing liver fibrosis stage in patients with chronic hepatitis B virus infection. World J Gastroenterol. 2021;27:641-653. [RCA] [PubMed] [DOI] [Full Text] [Full Text (PDF)] [Cited by in CrossRef: 26] [Cited by in RCA: 25] [Article Influence: 6.3] [Reference Citation Analysis (0)] |
| 9. | Lee J, Vali Y, Boursier J, Spijker R, Anstee QM, Bossuyt PM, Zafarmand MH. Prognostic accuracy of FIB-4, NAFLD fibrosis score and APRI for NAFLD-related events: A systematic review. Liver Int. 2021;41:261-270. [RCA] [PubMed] [DOI] [Full Text] [Full Text (PDF)] [Cited by in Crossref: 81] [Cited by in RCA: 236] [Article Influence: 59.0] [Reference Citation Analysis (0)] |
| 10. | Taylor-Weiner A, Pokkalla H, Han L, Jia C, Huss R, Chung C, Elliott H, Glass B, Pethia K, Carrasco-Zevallos O, Shukla C, Khettry U, Najarian R, Taliano R, Subramanian GM, Myers RP, Wapinski I, Khosla A, Resnick M, Montalto MC, Anstee QM, Wong VW, Trauner M, Lawitz EJ, Harrison SA, Okanoue T, Romero-Gomez M, Goodman Z, Loomba R, Beck AH, Younossi ZM. A Machine Learning Approach Enables Quantitative Measurement of Liver Histology and Disease Monitoring in NASH. Hepatology. 2021;74:133-147. [RCA] [PubMed] [DOI] [Full Text] [Full Text (PDF)] [Cited by in Crossref: 48] [Cited by in RCA: 126] [Article Influence: 31.5] [Reference Citation Analysis (0)] |
| 11. | Bosch J, Chung C, Carrasco-Zevallos OM, Harrison SA, Abdelmalek MF, Shiffman ML, Rockey DC, Shanis Z, Juyal D, Pokkalla H, Le QH, Resnick M, Montalto M, Beck AH, Wapinski I, Han L, Jia C, Goodman Z, Afdhal N, Myers RP, Sanyal AJ. A Machine Learning Approach to Liver Histological Evaluation Predicts Clinically Significant Portal Hypertension in NASH Cirrhosis. Hepatology. 2021;74:3146-3160. [RCA] [PubMed] [DOI] [Full Text] [Cited by in Crossref: 25] [Cited by in RCA: 36] [Article Influence: 9.0] [Reference Citation Analysis (0)] |
| 12. | Yamamoto T, Morooka H, Ito T, Ishigami M, Mizuno K, Yokoyama S, Yamamoto K, Imai N, Ishizu Y, Honda T, Yokota K, Hase T, Maeda O, Hashimoto N, Ando Y, Akiyama M, Kawashima H. Clustering using unsupervised machine learning to stratify the risk of immune-related liver injury. J Gastroenterol Hepatol. 2023;38:251-258. [RCA] [PubMed] [DOI] [Full Text] [Cited by in Crossref: 9] [Cited by in RCA: 8] [Article Influence: 4.0] [Reference Citation Analysis (0)] |
| 13. | Breiman L. Random Forests. Mach Learn. 2001;45:5-32. [RCA] [DOI] [Full Text] [Cited by in Crossref: 56052] [Cited by in RCA: 34169] [Article Influence: 2847.4] [Reference Citation Analysis (0)] |
| 14. | Vapnik V. Estimation of Dependences Based on Empirical Data. In: Information Science and Statistics. New York, NY: Springer, 2006. [DOI] [Full Text] |
| 16. | Pearl J. Probabilistic reasoning in intelligent systems: networks of plausible inference. NY: Morgan Kaufmann, 1988. |
| 17. | Brunt EM, Janney CG, Di Bisceglie AM, Neuschwander-Tetri BA, Bacon BR. Nonalcoholic steatohepatitis: a proposal for grading and staging the histological lesions. Am J Gastroenterol. 1999;94:2467-2474. [RCA] [PubMed] [DOI] [Full Text] [Cited by in Crossref: 2702] [Cited by in RCA: 2888] [Article Influence: 111.1] [Reference Citation Analysis (0)] |
| 18. | Al-Hasani M, Sultan LR, Sagreiya H, Cary TW, Karmacharya MB, Sehgal CM. Machine learning improves early detection of liver fibrosis by quantitative ultrasound radiomics. IEEE Int Ultrason Symp. 2022;2022. [RCA] [PubMed] [DOI] [Full Text] [Cited by in RCA: 3] [Reference Citation Analysis (0)] |
| 19. | Wang K, Lu X, Zhou H, Gao Y, Zheng J, Tong M, Wu C, Liu C, Huang L, Jiang T, Meng F, Lu Y, Ai H, Xie XY, Yin LP, Liang P, Tian J, Zheng R. Deep learning Radiomics of shear wave elastography significantly improved diagnostic performance for assessing liver fibrosis in chronic hepatitis B: a prospective multicentre study. Gut. 2019;68:729-741. [RCA] [PubMed] [DOI] [Full Text] [Full Text (PDF)] [Cited by in Crossref: 226] [Cited by in RCA: 354] [Article Influence: 59.0] [Reference Citation Analysis (1)] |
| 20. | Ahmed Y, Hussein RS, Basha TA, Khalifa AM, Ibrahim AS, Abdelmoaty AS, Abdella HM, Fahmy AS. Detecting liver fibrosis using a machine learning-based approach to the quantification of the heart-induced deformation in tagged MR images. NMR Biomed. 2020;33:e4215. [RCA] [PubMed] [DOI] [Full Text] [Cited by in Crossref: 10] [Cited by in RCA: 16] [Article Influence: 3.2] [Reference Citation Analysis (0)] |
| 21. | Chang D, Truong E, Mena EA, Pacheco F, Wong M, Guindi M, Todo TT, Noureddin N, Ayoub W, Yang JD, Kim IK, Kohli A, Alkhouri N, Harrison S, Noureddin M. Machine learning models are superior to noninvasive tests in identifying clinically significant stages of NAFLD and NAFLD-related cirrhosis. Hepatology. 2023;77:546-557. [RCA] [PubMed] [DOI] [Full Text] [Cited by in Crossref: 1] [Cited by in RCA: 42] [Article Influence: 21.0] [Reference Citation Analysis (0)] |
| 22. | Fan R, Yu N, Li G, Arshad T, Liu WY, Wong GL, Liang X, Chen Y, Jin XZ, Leung HH, Chen J, Wang XD, Yip TC, Sanyal AJ, Sun J, Wong VW, Zheng MH, Hou J. Machine-learning model comprising five clinical indices and liver stiffness measurement can accurately identify MASLD-related liver fibrosis. Liver Int. 2024;44:749-759. [RCA] [PubMed] [DOI] [Full Text] [Cited by in Crossref: 9] [Reference Citation Analysis (0)] |
| 23. | Perakakis N, Polyzos SA, Yazdani A, Sala-Vila A, Kountouras J, Anastasilakis AD, Mantzoros CS. Non-invasive diagnosis of non-alcoholic steatohepatitis and fibrosis with the use of omics and supervised learning: A proof of concept study. Metabolism. 2019;101:154005. [RCA] [PubMed] [DOI] [Full Text] [Cited by in Crossref: 96] [Cited by in RCA: 99] [Article Influence: 16.5] [Reference Citation Analysis (0)] |
| 24. | Chang W, Liu Y, Wu X, Xiao Y, Zhou S, Cao W. A New Hybrid XGBSVM Model: Application for Hypertensive Heart Disease. IEEE Access. 2019;7:175248-175258. [DOI] [Full Text] |
| 25. | Torlay L, Perrone-Bertolotti M, Thomas E, Baciu M. Machine learning-XGBoost analysis of language networks to classify patients with epilepsy. Brain Inform. 2017;4:159-169. [RCA] [PubMed] [DOI] [Full Text] [Full Text (PDF)] [Cited by in Crossref: 203] [Cited by in RCA: 192] [Article Influence: 24.0] [Reference Citation Analysis (0)] |
| 26. | Caballería L, Pera G, Arteaga I, Rodríguez L, Alumà A, Morillas RM, de la Ossa N, Díaz A, Expósito C, Miranda D, Sánchez C, Prats RM, Urquizu M, Salgado A, Alemany M, Martinez A, Majeed I, Fabrellas N, Graupera I, Planas R, Ojanguren I, Serra M, Torán P, Caballería J, Ginès P. High Prevalence of Liver Fibrosis Among European Adults With Unknown Liver Disease: A Population-Based Study. Clin Gastroenterol Hepatol. 2018;16:1138-1145.e5. [RCA] [PubMed] [DOI] [Full Text] [Cited by in Crossref: 140] [Cited by in RCA: 188] [Article Influence: 26.9] [Reference Citation Analysis (0)] |
| 27. | Ting YW, Jalaludin MY, Zaini AA, Mohamed R. Triglyceride to high-density lipoprotein cholesterol ratio is an independent predictor of liver fibrosis among pediatrics non-alcoholic fatty liver disease. Front Endocrinol (Lausanne). 2022;13:1071350. [RCA] [PubMed] [DOI] [Full Text] [Full Text (PDF)] [Cited by in RCA: 11] [Reference Citation Analysis (0)] |
| 28. | Morrow MR, Batchuluun B, Wu J, Ahmadi E, Leroux JM, Mohammadi-Shemirani P, Desjardins EM, Wang Z, Tsakiridis EE, Lavoie DCT, Reihani A, Smith BK, Kwiecien JM, Lally JSV, Nero TL, Parker MW, Ask K, Scott JW, Jiang L, Paré G, Pinkosky SL, Steinberg GR. Inhibition of ATP-citrate lyase improves NASH, liver fibrosis, and dyslipidemia. Cell Metab. 2022;34:919-936.e8. [RCA] [PubMed] [DOI] [Full Text] [Cited by in Crossref: 13] [Cited by in RCA: 113] [Article Influence: 37.7] [Reference Citation Analysis (0)] |
| 29. | Ohue-Kitano R, Nonaka H, Nishida A, Masujima Y, Takahashi D, Ikeda T, Uwamizu A, Tanaka M, Kohjima M, Igarashi M, Katoh H, Tanaka T, Inoue A, Suganami T, Hase K, Ogawa Y, Aoki J, Kimura I. Medium-chain fatty acids suppress lipotoxicity-induced hepatic fibrosis via the immunomodulating receptor GPR84. JCI Insight. 2023;8:e165469. [RCA] [PubMed] [DOI] [Full Text] [Full Text (PDF)] [Cited by in RCA: 21] [Reference Citation Analysis (0)] |
| 30. | Bril F, Pearce RW, Collier TS, McPhaul MJ. Differences in HDL-Bound Apolipoproteins in Patients With Advanced Liver Fibrosis Due to Nonalcoholic Fatty Liver Disease. J Clin Endocrinol Metab. 2022;108:42-51. [RCA] [PubMed] [DOI] [Full Text] [Cited by in Crossref: 2] [Cited by in RCA: 9] [Article Influence: 3.0] [Reference Citation Analysis (0)] |
| 31. | Crudele L, De Matteis C, Piccinin E, Gadaleta RM, Cariello M, Di Buduo E, Piazzolla G, Suppressa P, Berardi E, Sabbà C, Moschetta A. Low HDL-cholesterol levels predict hepatocellular carcinoma development in individuals with liver fibrosis. JHEP Rep. 2023;5:100627. [RCA] [PubMed] [DOI] [Full Text] [Full Text (PDF)] [Cited by in RCA: 41] [Reference Citation Analysis (0)] |
| 32. | Trieb M, Rainer F, Stadlbauer V, Douschan P, Horvath A, Binder L, Trakaki A, Knuplez E, Scharnagl H, Stojakovic T, Heinemann Á, Mandorfer M, Paternostro R, Reiberger T, Pitarch C, Amorós A, Gerbes A, Caraceni P, Alessandria C, Moreau R, Clària J, Marsche G, Stauber RE. HDL-related biomarkers are robust predictors of survival in patients with chronic liver failure. J Hepatol. 2020;73:113-120. [RCA] [PubMed] [DOI] [Full Text] [Cited by in Crossref: 57] [Cited by in RCA: 83] [Article Influence: 16.6] [Reference Citation Analysis (0)] |
| 33. | Liu CF, Chien LW. Predictive Role of Neutrophil-Percentage-to-Albumin Ratio (NPAR) in Nonalcoholic Fatty Liver Disease and Advanced Liver Fibrosis in Nondiabetic US Adults: Evidence from NHANES 2017-2018. Nutrients. 2023;15:1892. [RCA] [PubMed] [DOI] [Full Text] [Full Text (PDF)] [Cited by in RCA: 59] [Reference Citation Analysis (0)] |
| 34. | Luo S, Yang Y, Zhao T, Zhang R, Fang C, Li Y, Zhang Z, Gong T. Albumin-Based Silibinin Nanocrystals Targeting Activated Hepatic Stellate Cells for Liver Fibrosis Therapy. ACS Appl Mater Interfaces. 2023;15:7747-7758. [RCA] [PubMed] [DOI] [Full Text] [Cited by in RCA: 27] [Reference Citation Analysis (0)] |
| 35. | Takano M, Watanabe H, Toda S, Nishida K, Imafuku T, Minayoshi Y, Nakano T, Maeda H, Maruyama T. Therapeutic Effects of Albumin-Fused BMP7 on 2 Experimental Models of Liver Fibrosis. Biol Pharm Bull. 2023;46:1421-1426. [RCA] [PubMed] [DOI] [Full Text] [Cited by in RCA: 2] [Reference Citation Analysis (0)] |
| 36. | Ding R, Zheng J, Huang D, Wang Y, Li X, Zhou X, Yan L, Lu W, Yang Z, Zhang Z. INR-to-platelet ratio (INPR) as a novel noninvasive index for predicting liver fibrosis in chronic hepatitis B. Int J Med Sci. 2021;18:1159-1166. [RCA] [PubMed] [DOI] [Full Text] [Full Text (PDF)] [Cited by in Crossref: 19] [Cited by in RCA: 12] [Article Influence: 3.0] [Reference Citation Analysis (0)] |
| 37. | Calzadilla-Bertot L, Jeffrey GP, Wang Z, Huang Y, Garas G, Wallace M, de Boer B, George J, Eslam M, Phu A, Ampuero J, Lucena Valera A, Romero-Gómez M, Aller de la Fuente R, Adams LA. Predicting liver-related events in NAFLD: A predictive model. Hepatology. 2023;78:1240-1251. [RCA] [PubMed] [DOI] [Full Text] [Cited by in Crossref: 3] [Cited by in RCA: 5] [Article Influence: 2.5] [Reference Citation Analysis (0)] |


