


Published online Aug 14, 2025. doi: 10.3748/wjg.v31.i30.109186
Revised: June 13, 2025
Accepted: July 21, 2025
Published online: August 14, 2025
Processing time: 97 Days and 16.1 Hours
Microvascular invasion (MVI) is an important prognostic factor in hepatocellular carcinoma (HCC), but its preoperative prediction remains challenging.
To develop and validate a 2.5-dimensional (2.5D) deep learning-based multi-instance learning (MIL) model (MIL signature) for predicting MVI in HCC, evaluate and compare its performance against the radiomics signature and clinical signature, and assess its prognostic predictive value in both surgical resection and transcatheter arterial chemoembolization (TACE) cohorts.
A retrospective cohort consisting of 192 patients with pathologically confirmed HCC was included, of whom 68 were MVI-positive and 124 were MVI-negative. The patients were randomly assigned to a training set (134 patients) and a validation set (58 patients) in a 7:3 ratio. An additional 45 HCC patients undergoing TACE treatment were included in the TACE validation cohort. A modeling strategy based on computed tomography arterial phase images was implemented, utilizing 2.5D deep learning in combination with a MIL framework for the prediction of MVI in HCC. Moreover, this method was compared with the radiomics signature and clinical signatures, and the predictive performance of the various models was evaluated using receiver operating characteristic curves and decision curve analysis (DCA), with DeLong’s test applied to compare the area under the curve (AUC) between models. Kaplan-Meier curves were utilized to analyze differences in recurrence-free survival (RFS) or progression-free survival (PFS) among different HCC treatment cohorts stratified by MIL signature risk.
MIL signature demonstrated superior performance in the validation set (AUC = 0.877), significantly surpassing the radiomics signature (AUC = 0.727, P = 0.047) and clinical signature (AUC = 0.631, P = 0.004). DCA curves indicated that the MIL signature provided a greater clinical net benefit across the full spectrum of risk thresholds. In the prognostic analysis, high- and low-risk groups stratified by the MIL signature exhibited significant differences in RFS within the surgical resection cohort (training set P = 0.0058, validation set P = 0.031) and PFS within the TACE treatment cohort (P = 0.045).
MIL signature demonstrates more accurate MVI prediction in HCC, surpassing radiomics signature and clinical signature, and offers precise prognostic stratification, thereby providing new technical support for personalized HCC treatment strategies.
Core Tip: This study developed a 2.5-dimensional deep learning-based multi-instance learning (MIL) model (MIL signature) to predict microvascular invasion (MVI) in hepatocellular carcinoma (HCC) using computed tomography arterial phase images. The model outperformed traditional radiomics and clinical models, offering accurate MVI prediction and prognostic stratification for surgical resection and transcatheter arterial chemoembolization cohorts, supporting personalized HCC treatment.
- Citation: Cen YY, Nong HY, Huang XX, Lu XX, Pu CH, Huang LH, Zheng XJ, Pan ZL, Huang Y, Ding K, Huang DY. Computed tomography-based deep learning and multi-instance learning for predicting microvascular invasion and prognosis in hepatocellular carcinoma. World J Gastroenterol 2025; 31(30): 109186
- URL: https://www.wjgnet.com/1007-9327/full/v31/i30/109186.htm
- DOI: https://dx.doi.org/10.3748/wjg.v31.i30.109186
Hepatocellular carcinoma (HCC), the primary pathological type of liver cancer, is one of the leading causes of cancer-related mortality worldwide. The high incidence and mortality associated with HCC represent a significant public health challenge[1,2]. Microvascular invasion (MVI) refers to the presence of tumor cells within the vascular lumen, which is lined by endothelial cells[3], and is strongly associated with postoperative recurrence of HCC[4,5] as well as the efficacy of transcatheter arterial chemoembolization (TACE)[6]. Accurate preoperative detection of MVI is essential for optimizing treatment strategies. However, the diagnosis of MVI in HCC currently depends on postoperative tissue specimens[7], which present limitations, including time sensitivity and invasiveness.
The advancements in deep learning technologies have enabled the automatic extraction of features from medical images. However, traditional two-dimensional models overlook spatial relationships between slices, whereas three-dimensional (3D) models frequently encounter challenges related to computational efficiency. The 2.5-dimensional (2.5D) deep learning framework integrates multiple plane slices centered on the largest cross-sectional area of the tumor, balancing spatial relationships with computational efficiency[8,9]. Multi-instance learning (MIL) aggregates prediction outcomes from multiple image slices, offering a novel approach to capturing the tumor’s overall features[10], and shows promise in addressing the limitations of single-slice analysis and manual feature engineering.
The purpose of this study was to develop a 2.5D deep learning-based MIL model (MIL signature) to predict MVI in HCC using computed tomography (CT) arterial phase images. The effectiveness of this model would be compared with the traditional radiomics model (radiomics signature) and clinical model (clinical signature). We hypothesized that the MIL signature, leveraging hierarchical feature recognition and multi-slice integration within deep learning, would more accurately predict MVI in HCC and offer reliable prognostic stratification for patients with HCC undergoing curative surgery or TACE treatment. The study population and workflow are depicted in Figure 1.

This study was approved by the Ethics Committee of the Affiliated Hospital of Youjiang Medical University for Nationalities (No. YYFY-LL-2024-038). In accordance with the Helsinki Declaration, retrospective studies are exempt from the requirement to obtain informed consent from participants.
This retrospective study was conducted with 192 patients diagnosed with HCC through pathology at the Affiliated Hospital of Youjiang Medical University for Nationalities, spanning from January 2019 to May 2024. The patients were categorized into two groups: MVI-positive (68 patients) and MVI-negative (124 patients), based on postoperative pathological results. These patients were then randomized into training and validation sets at a 7:3 ratio. Inclusion criteria: (1) Patients who underwent curative resection for HCC, with postoperative pathological confirmation of HCC and complete MVI and clinical data available for all patients; and (2) All patients underwent CT scans and relevant laboratory tests within 1 week prior to surgery. Exclusion criteria: (1) Patients exhibiting artifacts on arterial phase CT-enhanced images; and (2) Patients with a history of radiotherapy, chemotherapy, or other tumor-related interventional therapies.
In addition, a retrospective collection of 45 patients diagnosed with HCC and treated with TACE at the Affiliated Hospital of Youjiang Medical University for Nationalities from February 2024 to August 2024 was conducted as a TACE validation cohort to better assess the model’s generalizability. Inclusion criteria were as follows: (1) A clinical diagnosis of HCC with complete clinical information for all patients; and (2) All patients underwent CT scans and relevant laboratory tests within one week prior to TACE. Exclusion criteria were as follows: (1) Patients exhibiting artifacts on arterial phase CT-enhanced images; and (2) Patients with a history of radiotherapy, chemotherapy, or other tumor-related interventional therapies.
The clinical and laboratory indicators included were age, gender, body mass index, alcohol consumption history, hepatitis B surface antigen, alpha-fetoprotein (AFP), albumin, aspartate aminotransferase, and alanine aminotransferase.
MVI refers to presence of cancer cell nests within the lumen, which is lined by endothelial cells, as observed under the microscope. The pathological grading method was outlined as follows[11]: M0 indicates no MVI detected; M1 (low-risk group) represents ≤ 5 MVI, all occurring within the peritumoral liver tissue (≤ 1 cm); M2 (high-risk group) is further divided into M2a, which is defined as > 5 peritumoral MVI, with no distant peritumoral MVI, and M2b, which is defined as MVI occurring in distant peritumoral liver tissue (> 1 cm). M0 was classified as the MVI-negative group, whereas M1 and M2 were classified as the MVI-positive group.
During follow-up, disease recurrence was defined as the appearance of tumors in the liver or other locations, as detected through ultrasound, CT, or magnetic resonance imaging following curative resection of HCC[12]. Disease progression was defined as an increase of more than 20% in the total diameter of the target lesions (at least 5 mm) or the appearance of new lesions after TACE treatment[13]. Disease recurrence and progression for all cases were analyzed by both a gastroenterologist and a radiologist, using outpatient and inpatient data, with no additional information provided beyond the allocated data. If multiple examinations were conducted during follow-up, the date of the earliest report of disease recurrence or progression was documented.
The follow-up endpoint was defined as the time to disease recurrence following radical resection, the time to disease progression after TACE treatment, or the follow-up duration for patients without disease recurrence or progression until March 2025. The time from baseline to the follow-up endpoint was defined as recurrence-free survival (RFS) and progression-free survival (PFS), respectively.
The scanning range extended from the apex of the diaphragm to the lower margin of the liver, and the CT scanning parameters for various devices are presented in Table 1. The contrast-enhanced scan employed a dual-syringe high-pressure injector to administer iodixanol (Uvison 370), with the dosage calculated at 1.5 mL/kg and an injection rate of 3.5 mL/second, followed by a saline flush of 40 mL at the same rate. The region of interest (ROI) was defined within the descending aorta, and the arterial phase scan commenced 8 seconds after the threshold was reached. All CT-enhanced arterial phase images were exported in digital imaging and communications in medicine format and subsequently converted to neuroimaging informatics technology initiative format.
| Devices | Revolution aca (GE) | Ingenuity core 64 (Philips) | Revolution (GE) |
| Layer thickness (mm) | 5 | 5 | 5 |
| Layer interval (mm) | 5 | 5 | 5 |
| Tube voltage (kV) | 120 | 120 | 120 |
| Tube current (mA) | 50 | 30 | 50 |
| Matrix | 512 × 512 | 512 × 512 | 512 × 512 |
| Threshold of ROI (HU) | 100 | 150 | 120 |
To minimize the impact of variations in machine types and scanning parameters, all CT image data were initially resampled, with voxel spacing standardized to 1 mm × 1 mm × 1 mm. Subsequently, the window width of all images was set to 259, and the window level was adjusted to 40 using windowing techniques. Two experienced radiologists independently conducted layer-by-layer tumor segmentation on the CT arterial-phase images using ITK-SNAP software (version 3.8.0, http://www.itksnap.org), without knowledge of the patient’s clinical or pathological information (see Figure 2).

2.5D data block acquisition for CT arterial phase images: Referring to the work of Jinling Zhu in the field of 2.5D deep learning[14], this study further investigated the impact of tumor spatial heterogeneity in relation to long-range structures on model performance by integrating a broader range of multi-scale dimensions, inheriting its core feature extraction framework, and introducing new parametric dimensions to enhance the clinical applicability of 2.5D deep learning models. We selected adjacent slices at the maximum dimension of the tumor and at intervals of ± 1, ± 2, ± 4, ± 7, and ± 9 to generate a comprehensive dataset consisting of 11 CT slices for each patient. Cropping was conducted using the OKT-crop max roi tool from the commercial OnekeyAI platform.
Slice-level model training: During the model training, the generated 2.5D data were incorporated into the transfer learning framework, and the predictive efficacy of various deep learning architectures was assessed, including ResNet18, Visual Geometry Group 19 (VGG19), and DenseNet121.
Data augmentation: The Z-score normalization technique was employed to standardize the intensity distributions across the RGB channels of the images. The processed images were subsequently provided as input to the model. Throughout training, real-time data augmentation techniques, such as random cropping, horizontal flipping, and vertical flipping, were applied to augment the dataset. In contrast, the images in the validation set were only normalized and not subjected to augmentation.
Data normalization: To maintain consistency across the dataset, the grayscale values of the slices were normalized using a minimum-maximum transformation, with the range set to (-1, 1). Each cropped subregion image was resized to 224 × 224 pixels through nearest-neighbor interpolation to conform to the input specifications of the deep learning model.
Training parameters: Given the distinctive features of the image dataset, a cosine decay strategy was employed to modulate the learning rate, thereby improving the model’s generalization capability. The learning rate was dynamically adjusted according to the formula outlined below.
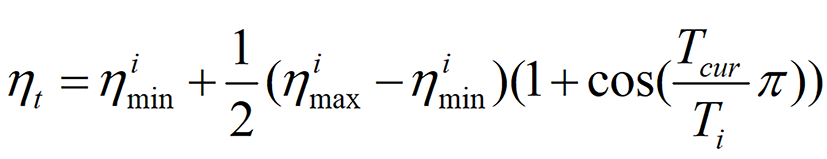
In this instance, parameter ηimin was set to 0, and parameter ηimax was set to 0.01. Parameter Ti denoted the number of iteration cycles. Furthermore, stochastic gradient descent was employed as the optimizer, and softmax cross-entropy was used as the loss function, with 64 training epochs and a batch size of 16. The training process for the deep learning models in this study was conducted using an NVIDIA RTX 5080 graphics processing unit, with each model requiring approximately one hour for training.
Feature fusion in MIL: Feature fusion was employed using two MIL methods to enhance the predictive accuracy of the model. This approach combined multiple data points or instances from a single sample into a unified feature set. The specific steps and techniques implemented were as follows.
Slice prediction: This study utilized a deep learning model to predict each slice, yielding the corresponding probability and label, referred to as slice probability (Sliceprob) and slice prediction (Slicepred), respectively, with the probability rounded to one decimal place.
MIL feature aggregation: The feature aggregation method in MIL utilized the predictive likelihood histogram (PLH) and bag-of-words (BoW) models. In the PLH feature aggregation method, each distinct number was treated as a “bin” and the frequencies of Sliceprob and Slicepred within each bin were counted. The histogram probability (Histoprob) and histogram prediction (Histopred) features were then obtained through minimum-maximum normalization. The BoW feature aggregation constructed a dictionary from the unique elements of Sliceprob and Slicepred, represented each slice as a vector recording the frequency of dictionary elements, and then used the term frequency-inverse document frequency transformation to highlight key features, ultimately generating a BoW feature representation that included both feature presence and importance.
Early fusion of features: The final stage involved integrating Histoprob, Histopred, BoW probability (BoWprob), and BoW prediction (BoWpred), using a feature connection method (+) to merge these sets into a comprehensive feature vector as follows: Featurefusion = Histoprob + Histopred + BoWprob + BoWpred.
MIL: To mitigate model overfitting, we standardized all MIL features using Z-score normalization, followed by t-tests or Mann-Whitney U tests to identify statistically significant features (P < 0.05). To minimize collinearity, features with a Pearson correlation coefficient exceeding 0.9 were selectively excluded. Subsequently, we enhanced the feature set using least absolute shrinkage and selection operator (Lasso) regression within a 10-fold cross-validation framework, optimizing the regularization parameter λ to select the most relevant features for the model. Finally, we constructed predictive models for the dimensionality-reduced MIL features using three well-established machine learning models: ExtraTrees, LightGBM, and multilayer perceptron (MLP). To address the issue of sample imbalance, we integrated the synthetic minority oversampling technique method during the training phase and ensured the model’s robustness through 5-fold cross-validation and hyperparameter optimization using grid search. The model demonstrating the best predictive performance was selected as the MIL signature.
Radiomics: We assessed the predictive performance of the traditional radiomics method, which involves the extraction of features through manual delineation (the extracted radiomics features and their distribution are shown in Supplementary Figure 1), as a benchmark for the radiomics model. This evaluation is valuable for comparison with the MIL signature. The radiomics modeling process and its results are documented in detail in Supplementary material (development of radiomics models), with the model demonstrating the best predictive performance designated as the radiomics signature.
Clinical: We used the Shapiro-Wilk test to assess differences in clinical features, selecting those with statistical significance (P < 0.05) through t-tests, Mann-Whitney U tests, or χ² tests. The selected clinical features were modeled using the same machine learning algorithm as MIL, with the best model ultimately defined as the clinical signature.
Sample size estimation was conducted using MedCalc (https://www.medcalc.org) for statistical analysis. Based on the following assumptions and parameters, a minimum of 26 samples were necessary in both the training and validation groups (13 MVI-positive and 13 MVI-negative): Statistical power of 80%; A two-tailed significance level of 0.05; The alternative hypothesis for the area under the receiver operating characteristic (ROC) curve (AUC) set at 0.800, compared to the null hypothesis AUC of 0.500; And an equal allocation ratio of samples between the negative and positive groups.
The analysis of baseline clinical characteristics, MIL features, and radiomics features, as well as the construction of predictive models, were all conducted using Python version 3.7.12. Statistical analysis was performed using stats models version 0.13.2, and radiomics feature extraction was done using PyRadiomics version 3.0.1. Machine learning algorithms were implemented using Scikit-learn version 1.0.2, while our deep learning model was developed using PyTorch version 1.11.0 and performance optimization was carried out using compute unified device architecture (CUDA) 11.3.1 and CUDA deep neural network library 8.2.1. Continuous variables were compared between groups using t-tests or the Mann-Whitney U test, and categorical variables were analyzed using the χ2 test. The diagnostic performance of the model was quantified using ROC curves, and decision curve analysis was performed to determine the clinical utility of the model. The AUC comparisons between different models were analyzed using the Delong test.
For the model with the best predictive performance among the MIL, radiomics, and clinical signatures, we divided the training set, validation set, and TACE treatment cohort into high- and low-risk subgroups based on the median prediction score of the model. The Kaplan-Meier method was used to evaluate the RFS in the HCC surgical treatment cohort and the PFS in the TACE treatment cohort, and the log-rank test was used to compare the recurrence/progression distribution differences between the stratified subgroups, with P < 0.05 considered statistically significant. The log-rank test analysis was conducted in R software (version 4.2.2, http://www.Rproject.org).
Slice-level prediction results: In the comparative analysis of the ResNet18, VGG19, and DenseNet121 models, ResNet18 demonstrated superior performance in the validation set, with an AUC of 0.777, higher than VGG19 (0.749) and DenseNet121 (0.645) (Table 2 and Figure 3). Moreover, ResNet18 also maintained high sensitivity (0.705) and specificity (0.777) in the validation set, making it the preferred choice for further development in MIL applications. Figure 3 shows the visualization of activations in the final convolutional layer associated with class prediction using the gradient-weighted class activation mapping (Grad-CAM) technique.

| Dataset | Model | Accuracy | AUC (95%CI) | Sensitivity | Specificity |
| Training | Resnet18 | 0.771 | 0.841 (0.820-0.861) | 0.701 | 0.814 |
| Validation | Resnet18 | 0.757 | 0.777 (0.739-0.814) | 0.705 | 0.777 |
| Training | VGG19 | 0.695 | 0.770 (0.745-0.794) | 0.708 | 0.688 |
| Validation | VGG19 | 0.790 | 0.749 (0.708-0.791) | 0.472 | 0.911 |
| Training | Densenet121 | 0.750 | 0.845 (0.825-0.866) | 0.809 | 0.714 |
| Validation | Densenet121 | 0.704 | 0.645 (0.596-0.694) | 0.437 | 0.805 |
MIL fusion results: The features derived from MIL aggregation consist of 13 PLH features and 13 BoW features. Following dimensionality reduction of these MIL features, five features (Figure 4) were selected to develop the prediction model. In the validation set, while the sensitivities of the ExtraTrees, LightGBM, and MLP models were comparable, the LightGBM model (AUC = 0.877, accuracy = 0.793, specificity = 0.756) exhibited superior AUC, accuracy, and specificity when compared to ExtraTrees (AUC = 0.861, accuracy = 0.776, specificity = 0.732) and MLP (AUC = 0.841, accuracy = 0.776, specificity = 0.732) (Table 3 and Figure 4). Based on its higher AUC, accuracy, and specificity scores in the validation set, the LightGBM model was identified as the most effective model in MIL and was subsequently designated as MIL signature, which served as the foundation for the subsequent model comparison analyses.

| Dataset | Model | Accuracy | AUC (95%CI) | Sensitivity | Specificity |
| Training | ExtraTrees | 0.821 | 0.917 (0.874-0.961) | 0.784 | 0.843 |
| Validation | ExtraTrees | 0.776 | 0.861 (0.756-0.966) | 0.882 | 0.732 |
| Training | LightGBM | 0.821 | 0.880 (0.821-0.940) | 0.824 | 0.819 |
| Validation | LightGBM | 0.793 | 0.877 (0.784-0.970) | 0.882 | 0.756 |
| Training | MLP | 0.836 | 0.914 (0.868-0.959) | 0.824 | 0.843 |
| Validation | MLP | 0.776 | 0.841 (0.727-0.956) | 0.882 | 0.732 |
After conducting intraclass correlation coefficient analysis, t-tests/Mann-Whitney U tests, Pearson correlation analysis, and dimensionality reduction via Lasso regression, 10 radiomics features were selected to construct the prediction model. Among the three models: ExtraTrees, LightGBM, and MLP. MLP exhibited the highest overall predictive performance, with an accuracy of 0.672, an AUC of 0.727, a sensitivity of 0.882, and a specificity of 0.585 in the validation set (Supplementary Figure 2 and Supplementary Table 1). Consequently, MLP was identified as the radiomics signature.
The age (49.45 ± 8.71 vs 53.63 ± 9.92, P = 0.015) and AFP (606.46 ± 538.15 vs 380.89 ± 489.91, P = 0.005) demonstrated statistically significant differences between the MVI-positive and MVI-negative groups within the training set of the HCC surgery treatment cohort, whereas no other clinical features exhibited statistically significant differences (P > 0.05) (Supplementary Table 2).
The three models (ExtraTrees, LightGBM, and MLP) developed using age and AFP demonstrated an overall moderate predictive performance (Supplementary Figure 3 and Supplementary Table 3), with MLP exhibiting the highest perfor
The predictive metrics for different signatures are shown in Table 4 and Figure 5, with the results indicating that the MIL signature has the best overall predictive performance. The Delong test found that the predictive performance of the MIL signature (AUC = 0.877) was significantly better than that of the clinical signature (AUC = 0.631, P = 0.004) and the radiomics signature (AUC = 0.727, P = 0.047). The decision curve analysis results (Figure 5) showed that the decision curve for MIL consistently lies above the reference line in the test set, indicating that it provides significant clinical net benefit and has a great advantage in prediction probability. Furthermore, compared to other signatures, the MIL signature consistently demonstrates greater net benefit potential.

| Dataset | Signature | Accuracy | AUC (95%CI) | Sensitivity | Specificity |
| Training | Clinical | 0.530 | 0.655 (0.559-0.751) | 0.882 | 0.313 |
| Validation | Clinical | 0.500 | 0.631 (0.470-0.793) | 0.882 | 0.341 |
| Training | Radiomics | 0.687 | 0.770 (0.691-0.849) | 0.765 | 0.639 |
| Validation | Radiomics | 0.672 | 0.727 (0.597-0.857) | 0.882 | 0.585 |
| Training | MIL | 0.821 | 0.880 (0.821-0.940) | 0.824 | 0.819 |
| Validation | MIL | 0.793 | 0.877 (0.784-0.970) | 0.882 | 0.756 |
Stratification of the risk for disease recurrence and progression was conducted using the MIL signature, which demonstrated the highest predictive performance for MVI in HCC. According to the Kaplan-Meier curve (Figure 6), both the training set (P = 0.0058) and the validation set (P = 0.031) revealed that the RFS of high-risk patients was significantly shorter than that of low-risk patients. In the TACE treatment cohort, after stratifying high-risk and low-risk patients using the MIL signature, it was observed that high-risk patients exhibited a significantly shorter PFS than low-risk patients (P = 0.045).

This study focused on the preoperative prediction of MVI in HCC and the evaluation of HCC prognosis. We developed a 2.5D deep learning multiple instance learning model based on CT arterial phase data and compared it with the traditional radiomics and clinical models. The results showed that the MIL signature performed excellently in several aspects.
MIL signature demonstrated remarkable superiority in predicting MVI of HCC. In the training and validation sets, this signature achieved AUC values of 0.880 and 0.877, respectively, outperforming Liu et al’s 2D deep learning model based on CT for predicting MVI of HCC (internal validation: AUC = 0.845; external validation: AUC = 0.777)[15]. This superiority can be attributed to several aspects. First, our CT 2.5D data architecture selected multiple slices (11 slices in total) from the tumor’s maximum cross-sectional area and adjacent layers, preserving the spatial context of the tumor and surrounding structures. This approach fully captured the spatial relationship between the tumor and surrounding blood vessels, while effectively balancing computational complexity and enhancing model efficiency[8,9,14,16]. Secondly, MIL integrated the slice-level prediction results using PLH and BoW techniques, effectively capturing and enhancing the heterogeneity of both the tumor’s internal structure and its surrounding environment[10,17]. The Delong test results demonstrated that the MIL signature outperformed the traditional radiomics signature (AUC: 0.877 vs 0.727, P = 0.047) and the clinical signature (AUC: 0.877 vs 0.631, P = 0.004) in predicting MVI within the validation set. This phenomenon can be attributed to the multiple limitations inherent in traditional radiomics, including reliance on manually designed feature extraction, which is both subjective and time-consuming; excessive feature redundancy, which leads to overfitting; and insufficient data standardization, which hinders model generalization[18,19]. These factors ultimately result in suboptimal predictive performance. In contrast, deep learning methods can autonomously learn complex features from images, reducing manual intervention, and may better capture subtle radiological features related to MVI[20]. The limitations of the clinical model stem from the reliance on a single biomarker[21,22]. Although age and AFP demonstrated significant group differences in the training set (P = 0.015 and 0.005), the accuracy of the clinical signature in the validation set was only 0.500, highlighting its limited ability to predict MVI. The reasons for this are that AFP, a traditional tumor marker, is influenced by various liver diseases (e.g., acute and chronic hepatitis and cirrhosis)[23], leading to a nonspecific elevation in its levels, which diminishes its specificity in predicting MVI. Age, as a systemic factor, lacks a direct causal relationship with the biological mechanism of tumor angiogenesis, making it challenging to accurately reflect the invasive nature of tumors. Together, these factors reduce the predictive value and clinical applicability of models for MVI.
The results of the decision curve analysis further emphasized the clinical utility of the MIL signature. At different prediction probability thresholds, the decision curve of the MIL signature consistently remained above the reference line, suggesting that, in clinical practice, the MIL signature for MVI prediction could offer more significant decision-making support to physicians, leading to favorable clinical net benefits.
From the perspective of model visualization analysis, the Grad-CAM technique revealed that the MIL signature selectively focused on the tumor edges and vascular-rich areas in the image during prediction. Tumor edges are commonly associated with cancer cell invasion[24] and active angiogenesis[25], whereas vascular-rich areas promote the entry of tumor cells into the vascular system, which is closely linked to the onset of MVI[26,27]. The precise focus of MIL signature on these regions enables it to effectively capture key pathological sites and functional units associated with tumor invasion and metastasis. The high degree of alignment between the visualization results and the mechanism of MVI validates the biological rationale behind model feature extraction from the image-pathology correlation perspective, providing strong evidence for the validity of MIL signature in predicting MVI.
MIL signature has played a pivotal role in prognostic stratification for both the HCC surgical resection and TACE treatment cohorts. In patients undergoing surgical resection, individuals were categorized into high-risk and low-risk groups based on the MIL signature predictive score. The results indicated that the high-risk group exhibited significantly shorter RFS in both the training set (P = 0.0058) and validation set (P = 0.031) compared to the low-risk group. This finding is consistent with the established understanding that MVI is a significant risk factor for postoperative recurrence of HCC[22,28,29], indicating that MIL signature can effectively identify patients at high risk of recurrence and provide a robust basis for selecting postoperative adjuvant therapies.
For patients receiving TACE, the MIL signature effectively stratified prognosis, with the PFS of the high-risk group being significantly lower than that of the low-risk group (P = 0.045). TACE primarily inhibits tumor growth by embolizing the tumor-supplying arteries; however, tumor angiogenesis and invasiveness influence treatment efficacy and disease progression[30], which may lead to lower PFS in the high-risk MVI group. This is consistent with the under
Despite the promising results of this study in predicting MVI in HCC and risk stratification, some limitations should still be concerned. First, this study was based on a single-center, retrospective cohort with a relatively small sample size, which may have introduced selection bias and limited the generalizability of the model. Additionally, the absence of external multicenter validation hindered the assessment of cross-institutional generalizability, despite the inclusion of a TACE validation cohort. Second, although the 2.5D deep learning method strikes a balance between spatial information and computational efficiency, it fails to fully capture the 3D tumor structure, potentially overlooking features associated with MVI[14,16,31]. In the future, we aim to incorporate 3D convolutional neural network technology to address this limitation. Third, this study is based solely on CT arterial phase images and does not incorporate multimodal imaging, including CT plain scan, portal venous phase, delayed-phase images, and molecular biological information, potentially limiting the comprehensiveness and accuracy of the model. In the future, we will prospectively collect data from more centers to significantly increase the sample size and explore directions such as lightweight 3D convolutional networks, multimodal 3D feature fusion, and weakly supervised 3D feature enhancement to address these potential issues.
In conclusion, the MIL signature based on CT arterial phase images can effectively predict the MVI status of HCC and the prognosis risk across different treatment cohorts. Since CT scans are routinely performed in clinical practice, it can serve as a complementary tool to the current risk stratification strategies, without incurring additional costs.
We would like acknowledge all funding organizations and patients of this study.
| 1. | Singal AG, Kanwal F, Llovet JM. Global trends in hepatocellular carcinoma epidemiology: implications for screening, prevention and therapy. Nat Rev Clin Oncol. 2023;20:864-884. [RCA] [PubMed] [DOI] [Full Text] [Cited by in Crossref: 13] [Cited by in RCA: 337] [Article Influence: 168.5] [Reference Citation Analysis (1)] |
| 2. | Barcena-Varela M, Monga SP, Lujambio A. Precision models in hepatocellular carcinoma. Nat Rev Gastroenterol Hepatol. 2025;22:191-205. [RCA] [PubMed] [DOI] [Full Text] [Cited by in Crossref: 3] [Cited by in RCA: 7] [Article Influence: 7.0] [Reference Citation Analysis (0)] |
| 3. | Lee S, Kang TW, Song KD, Lee MW, Rhim H, Lim HK, Kim SY, Sinn DH, Kim JM, Kim K, Ha SY. Effect of Microvascular Invasion Risk on Early Recurrence of Hepatocellular Carcinoma After Surgery and Radiofrequency Ablation. Ann Surg. 2021;273:564-571. [RCA] [PubMed] [DOI] [Full Text] [Cited by in Crossref: 77] [Cited by in RCA: 216] [Article Influence: 54.0] [Reference Citation Analysis (0)] |
| 4. | Yang M, Song X, Zhang F, Li M, Chang W, Wang Z, Li M, Shan H, Li D. Spatial proteomic landscape of primary and relapsed hepatocellular carcinoma reveals immune escape characteristics in early relapse. Hepatology. 2025;81:1452-1467. [RCA] [PubMed] [DOI] [Full Text] [Cited by in Crossref: 5] [Cited by in RCA: 7] [Article Influence: 7.0] [Reference Citation Analysis (0)] |
| 5. | Li K, Zhang R, Wen F, Zhao Y, Meng F, Li Q, Hao A, Yang B, Lu Z, Cui Y, Zhou M. Single-cell dissection of the multicellular ecosystem and molecular features underlying microvascular invasion in HCC. Hepatology. 2024;79:1293-1309. [RCA] [PubMed] [DOI] [Full Text] [Cited by in Crossref: 4] [Cited by in RCA: 30] [Article Influence: 30.0] [Reference Citation Analysis (0)] |
| 6. | Yang Y, Dang Z, Lu P, Qian Y, Lin K, Pan Z, Lau WY, Zhou W. Impact of pathological response after preoperative transcatheter arterial chemoembolization (TACE) on incidences of microvascular invasion and early tumor recurrence in hepatocellular carcinoma: a multicenter propensity score matching analysis. Hepatobiliary Surg Nutr. 2022;11:386-399. [RCA] [PubMed] [DOI] [Full Text] [Cited by in Crossref: 5] [Cited by in RCA: 21] [Article Influence: 7.0] [Reference Citation Analysis (0)] |
| 7. | Yang C, Liang Z, Zhao L, Li R, Ma P. Prediction of microvascular invasion in hepatocellular carcinoma using a preoperative serum C-reactive protein-based nomogram. Sci Rep. 2025;15:522. [RCA] [PubMed] [DOI] [Full Text] [Cited by in RCA: 1] [Reference Citation Analysis (0)] |
| 8. | Zhang YB, Chen ZQ, Bu Y, Lei P, Yang W, Zhang W. Construction of a 2.5D Deep Learning Model for Predicting Early Postoperative Recurrence of Hepatocellular Carcinoma Using Multi-View and Multi-Phase CT Images. J Hepatocell Carcinoma. 2024;11:2223-2239. [RCA] [PubMed] [DOI] [Full Text] [Full Text (PDF)] [Cited by in RCA: 2] [Reference Citation Analysis (0)] |
| 9. | Lin C, Cao T, Tang M, Pu W, Lei P. Predicting hepatocellular carcinoma response to TACE: A machine learning study based on 2.5D CT imaging and deep features analysis. Eur J Radiol. 2025;187:112060. [RCA] [PubMed] [DOI] [Full Text] [Cited by in Crossref: 1] [Reference Citation Analysis (0)] |
| 10. | Su Z, Rezapour M, Sajjad U, Gurcan MN, Niazi MKK. Attention2Minority: A salient instance inference-based multiple instance learning for classifying small lesions in whole slide images. Comput Biol Med. 2023;167:107607. [RCA] [PubMed] [DOI] [Full Text] [Cited by in Crossref: 5] [Cited by in RCA: 7] [Article Influence: 3.5] [Reference Citation Analysis (0)] |
| 11. | Cong WM, Bu H, Chen J, Dong H, Zhu YY, Feng LH, Chen J; Guideline Committee. Practice guidelines for the pathological diagnosis of primary liver cancer: 2015 update. World J Gastroenterol. 2016;22:9279-9287. [RCA] [PubMed] [DOI] [Full Text] [Full Text (PDF)] [Cited by in CrossRef: 185] [Cited by in RCA: 291] [Article Influence: 32.3] [Reference Citation Analysis (0)] |
| 12. | Brandão ABM, Rodriguez S, Marroni CA, Junior AMF, Fernandes MV, Mucenic M. Performance of eight predictive models for hepatocellular carcinoma recurrence after liver transplantation: A comparative study. Ann Hepatol. 2024;29:101184. [RCA] [PubMed] [DOI] [Full Text] [Reference Citation Analysis (0)] |
| 13. | Zhang L, Zhang X, Li Q, Makamure J, Liu Z, Zhao D, Li X, Shi H, Zheng C, Liu F, Liang B. Transarterial chemoembolization failure in patients with hepatocellular carcinoma: Incidence, manifestation and risk factors. Clin Res Hepatol Gastroenterol. 2023;47:102071. [RCA] [PubMed] [DOI] [Full Text] [Cited by in RCA: 3] [Reference Citation Analysis (0)] |
| 14. | Zhu J, Zou L, Xie X, Xu R, Tian Y, Zhang B. 2.5D deep learning based on multi-parameter MRI to differentiate primary lung cancer pathological subtypes in patients with brain metastases. Eur J Radiol. 2024;180:111712. [RCA] [PubMed] [DOI] [Full Text] [Cited by in RCA: 4] [Reference Citation Analysis (0)] |
| 15. | Liu SC, Lai J, Huang JY, Cho CF, Lee PH, Lu MH, Yeh CC, Yu J, Lin WC. Predicting microvascular invasion in hepatocellular carcinoma: a deep learning model validated across hospitals. Cancer Imaging. 2021;21:56. [RCA] [PubMed] [DOI] [Full Text] [Full Text (PDF)] [Cited by in Crossref: 4] [Cited by in RCA: 34] [Article Influence: 8.5] [Reference Citation Analysis (1)] |
| 16. | Zeng Y, Zhang X, Kawasumi Y, Usui A, Ichiji K, Funayama M, Homma N. A 2.5D Deep Learning-Based Method for Drowning Diagnosis Using Post-Mortem Computed Tomography. IEEE J Biomed Health Inform. 2023;27:1026-1035. [RCA] [PubMed] [DOI] [Full Text] [Cited by in Crossref: 15] [Cited by in RCA: 7] [Article Influence: 3.5] [Reference Citation Analysis (0)] |
| 17. | Chang B, Geng Z, Mei J, Wang Z, Chen P, Jiang Y, Niu C. Application of multimodal deep learning and multi-instance learning fusion techniques in predicting STN-DBS outcomes for Parkinson's disease patients. Neurotherapeutics. 2024;21:e00471. [RCA] [PubMed] [DOI] [Full Text] [Cited by in RCA: 2] [Reference Citation Analysis (0)] |
| 18. | Afshar P, Mohammadi A, Plataniotis KN, Oikonomou A, Benali H. From Handcrafted to Deep-Learning-Based Cancer Radiomics: Challenges and Opportunities. IEEE Signal Process Mag. 2019;36:132-160. [DOI] [Full Text] |
| 19. | Huynh BN, Groendahl AR, Tomic O, Liland KH, Knudtsen IS, Hoebers F, van Elmpt W, Malinen E, Dale E, Futsaether CM. Head and neck cancer treatment outcome prediction: a comparison between machine learning with conventional radiomics features and deep learning radiomics. Front Med (Lausanne). 2023;10:1217037. [RCA] [PubMed] [DOI] [Full Text] [Cited by in Crossref: 4] [Cited by in RCA: 17] [Article Influence: 8.5] [Reference Citation Analysis (0)] |
| 20. | Zhang W, Guo Q, Zhu Y, Wang M, Zhang T, Cheng G, Zhang Q, Ding H. Cross-institutional evaluation of deep learning and radiomics models in predicting microvascular invasion in hepatocellular carcinoma: validity, robustness, and ultrasound modality efficacy comparison. Cancer Imaging. 2024;24:142. [RCA] [PubMed] [DOI] [Full Text] [Cited by in RCA: 4] [Reference Citation Analysis (0)] |
| 21. | Kang I, Kwon WY, Lee SH. Abstract 7364: Comprehensive multi-omics analysis for resectable hepatocellular carcinoma uncovers biomarkers to predict microvascular invasion. Cancer Res. 2024;84:7364-7364. [DOI] [Full Text] |
| 22. | Birgin E, Nebelung H, Abdelhadi S, Rink JS, Froelich MF, Hetjens S, Rahbari M, Téoule P, Rasbach E, Reissfelder C, Weitz J, Schoenberg SO, Riediger C, Plodeck V, Rahbari NN. Development and validation of a digital biopsy model to predict microvascular invasion in hepatocellular carcinoma. Front Oncol. 2024;14:1360936. [RCA] [PubMed] [DOI] [Full Text] [Cited by in RCA: 1] [Reference Citation Analysis (0)] |
| 23. | Park C, Hwang G, Choi WM, Han JE, Kim C, Lee DY, Heo S, Park RW. Baseline Alpha-Fetoprotein Elevation and the Risk of Hepatocellular Carcinoma in Chronic Hepatitis B: A Multicentre Cohort Study. J Viral Hepat. 2025;32:e70006. [RCA] [PubMed] [DOI] [Full Text] [Cited by in RCA: 1] [Reference Citation Analysis (0)] |
| 24. | Nimitrungtawee N, Inmutto N, Amantakul A, Jantarangkoon A. Prediction microvascular invasion of hepatocellular carcinoma based on tumour margin enhancing pattern in multiphase computed tomography images. Pol J Radiol. 2023;88:e238-e243. [RCA] [PubMed] [DOI] [Full Text] [Full Text (PDF)] [Cited by in Crossref: 2] [Cited by in RCA: 2] [Article Influence: 1.0] [Reference Citation Analysis (0)] |
| 25. | Lin CM, Yu CF, Huang HY, Chen FH, Hong JH, Chiang CS. Distinct Tumor Microenvironment at Tumor Edge as a Result of Astrocyte Activation Is Associated With Therapeutic Resistance for Brain Tumor. Front Oncol. 2019;9:307. [RCA] [PubMed] [DOI] [Full Text] [Full Text (PDF)] [Cited by in Crossref: 11] [Cited by in RCA: 19] [Article Influence: 3.2] [Reference Citation Analysis (0)] |
| 26. | Zhang ZH, Jiang C, Qiang ZY, Zhou YF, Ji J, Zeng Y, Huang JW. Role of microvascular invasion in early recurrence of hepatocellular carcinoma after liver resection: A literature review. Asian J Surg. 2024;47:2138-2143. [RCA] [PubMed] [DOI] [Full Text] [Cited by in RCA: 20] [Reference Citation Analysis (0)] |
| 27. | Fukushima R, Harimoto N, Okuyama T, Seki T, Hoshino K, Hagiwara K, Kawai S, Ishii N, Tsukagoshi M, Igarashi T, Araki K, Tomonaga H, Higuchi T, Shimokawa M, Shirabe K. New predictors of microvascular invasion for small hepatocellular carcinoma ≤ 3 cm. Int J Clin Oncol. 2024;29:1182-1190. [RCA] [PubMed] [DOI] [Full Text] [Cited by in RCA: 1] [Reference Citation Analysis (0)] |
| 28. | Hwang YJ, Bae JS, Lee Y, Hur BY, Lee DH, Kim H. Classification of microvascular invasion of hepatocellular carcinoma: correlation with prognosis and magnetic resonance imaging. Clin Mol Hepatol. 2023;29:733-746. [RCA] [PubMed] [DOI] [Full Text] [Cited by in Crossref: 9] [Cited by in RCA: 27] [Article Influence: 13.5] [Reference Citation Analysis (0)] |
| 29. | Zhang XP, Xu S, Lin ZY, Gao QL, Wang K, Chen ZL, Yan ML, Zhang F, Tang YF, Zhao ZM, Li CG, Lau WY, Cheng SQ, Hu MG, Liu R. Significance of anatomical resection and resection margin status in patients with HBV-related hepatocellular carcinoma and microvascular invasion: a multicenter propensity score-matched study. Int J Surg. 2023;109:679-688. [RCA] [PubMed] [DOI] [Full Text] [Cited by in Crossref: 3] [Cited by in RCA: 36] [Article Influence: 18.0] [Reference Citation Analysis (0)] |
| 30. | Li J, Liu Y, Zheng R, Qu C, Li J. Molecular mechanisms of TACE refractoriness: Directions for improvement of the TACE procedure. Life Sci. 2024;342:122540. [RCA] [PubMed] [DOI] [Full Text] [Cited by in RCA: 10] [Reference Citation Analysis (0)] |
| 31. | Song S, Zhang G, Yao Z, Chen R, Liu K, Zhang T, Zeng G, Wang Z, Liu R. Deep learning based on intratumoral heterogeneity predicts histopathologic grade of hepatocellular carcinoma. BMC Cancer. 2025;25:497. [RCA] [PubMed] [DOI] [Full Text] [Full Text (PDF)] [Cited by in RCA: 1] [Reference Citation Analysis (0)] |