


Published online Apr 14, 2025. doi: 10.3748/wjg.v31.i14.104588
Revised: February 22, 2025
Accepted: March 21, 2025
Published online: April 14, 2025
Processing time: 107 Days and 10.2 Hours
Colorectal cancer (CRC) is a common malignancy that has become a global burden. The prognostic prediction of CRC patients on the basis of inflammatory biomarkers and nutritional biomarkers has shown some potential but has not been fully explored.
To develop and validate a prognostic model for CRC based on inflammation and nutrition-related biomarkers and to evaluate its predictive value for patient outcomes.
Patients were randomized at a 3:2 ratio into a training cohort (n = 282) or a vali
In the training cohort, univariate analysis of all the inflammatory and nutritional biomarkers demonstrated some predictive value. A LASSO-Cox analysis included four biomarkers and constructed an RS. Through ROC analysis, the area under the prognostic curve was 0.795. K-M survival curve analyses revealed that the five-year OS was significantly greater in the Low-RS group than in the High-RS group (P < 0.001). Multivariate analysis demon
This study developed a nomogram based on the RS to predict the OS of CRC patients. This nomogram can guide treatment decisions and enable the formulation of personalized follow-up strategies on the basis of predicted recurrence risk, aiming to improve long-term prognosis.
Core Tip: This study developed a nomogram incorporating inflammatory and nutritional biomarkers to predict the overall survival of patients with colorectal cancer (CRC). The nomogram, which is based on a risk score derived from four selected biomarkers, demonstrated high prognostic accuracy and clinical utility. This information can help guide treatment decisions and personalize follow-up strategies, ultimately improving long-term outcomes for CRC patients.
- Citation: Li KJ, Zhang ZY, Wang K, Sulayman S, Zeng XY, Liu J, Chen Y, Zhao ZL. Prognostic scoring system using inflammation- and nutrition-related biomarkers to predict prognosis in stage I-III colorectal cancer patients. World J Gastroenterol 2025; 31(14): 104588
- URL: https://www.wjgnet.com/1007-9327/full/v31/i14/104588.htm
- DOI: https://dx.doi.org/10.3748/wjg.v31.i14.104588
Colorectal cancer (CRC) is among the most frequently diagnosed cancers worldwide, ranking third in incidence and second in cancer-related mortality[1]. The prognosis of CRC patients primarily depends on the stage of the disease at diagnosis, and early-stage CRC patients generally have a better prognosis than do advanced-stage patients[2]. Despite advances in surgical techniques and significant improvements in treatment strategies in recent years, CRC remains associated with substantial mortality, and postoperative outcomes can vary greatly among patients[3]. Thus, developing a reliable prognostic indicator to predict recurrence and survival after CRC surgery is essential for personalizing treatment plans.
Inflammation is crucial in cancer initiation[4] and progression, contributing to the onset and development of various malignancies[5]. Tumor-associated inflammatory factors include cytokines, immune cells, and small inflammatory mediators derived from both the tumor and the host[6]. Many studies have shown that nutritional status plays a pro
Several inflammation- and nutrition-related biomarkers, including the neutrophil-to-lymphocyte ratio (NLR)[10], monocyte-to-lymphocyte ratio (MLR)[11], platelet-to-lymphocyte ratio (PLR)[12], advanced lung cancer inflammation index (ALI)[13], panimmune-inflammation index (PIV)[14], systemic immune inflammation index (SII)[15], systemic inflammation response index (SIRI)[16], prognostic nutritional index (PNI)[17], geriatric nutrition risk index (GNRI)[18], and albumin-to-globulin ratio (AGR)[19], have been identified. These biomarkers are easily accessible and cost-effective. However, the optimal combination and cutoff values may vary depending on the cancer type. We aimed to identify the optimal combination for assessing CRC patient prognosis. In this study, we performed a comprehensive analysis of inflammation- and nutrition-related biomarkers using LASSO Cox regression to construct a risk score (RS). We then examined the relationship between the RS and CRC prognosis, developing a novel nomogram to predict survival outcomes. This model aims to provide clinicians with a more comprehensive and systematic reference for the prognostic evaluation of CRC patients, thereby offering valuable support and guidance for clinical decision-making.
We retrospectively gathered data from 470 CRC patients who underwent radical resection between January 2016 and December 2018. All patients included in the study were pathologically confirmed to have stage I to III CRC. Patient classification was based on the pathological criteria of the 8th edition of the American Joint Committee on Cancer guidelines.
The inclusion criteria were as follows: (1) Available follow-up data; (2) Histopathologically confirmed stage I to III CRC; (3) Complete clinical and pathological records; (4) Age > 18 years; and (5) Complete preoperative blood test results within one week before surgery. The exclusion criteria were as follows: (1) Patients with stage IV metastatic CRC; (2) Patients who received neoadjuvant chemotherapy or radiation therapy; and (3) Patients with a history of hematological disorders, autoimmune diseases, or immunodeficiency.
Patients were strictly followed up according to a standardized protocol. Follow-up was conducted one month after surgery, every three months for the first two years, and then every six months thereafter. The primary endpoint was overall survival (OS), defined as the time from surgery to all-cause death or the last follow-up. The follow-up period continued until the endpoint of death or March 2023.
A list of patients who underwent radical CRC surgery was obtained from the Department of Information. The laboratory data were cross-checked through the electronic medical records system and systematically recorded in Excel. The collected variables included the following: Sex, age, height, body weight, body mass index (BMI), smoking history, alcohol consumption history, carcinoembryonic antigen (CEA), preoperative blood cell counts (albumin, globulin, white blood cell count, lymphocyte count, monocyte count, neutrophil count, and platelet count), T stage, N stage, tumor-node-metastasis (TNM) stage, gross tumor appearance, histological type, tumor differentiation grade, perineural invasion, vascular invasion, and follow-up information (survival outcomes and survival time). In this study, missing data values in clinical and laboratory variables were identified. The overall proportion of missing data for each variable was calculated, and missing data were categorized on the basis of variable type. For handling missing data and to ensure the robustness of the analysis and minimize bias, we adopted a complete case analysis approach. Patients with missing data on key variables, such as tumor staging and biomarker values, were excluded.
The following biomarkers were calculated on the basis of preoperative blood cell counts obtained within one week before surgery:
NLR: Neutrophil count/lymphocyte count
MLR: Monocyte count/lymphocyte count
PLR: Platelet count/lymphocyte count
ALI: BMI × albumin/NLR
PIV: (neutrophil count × platelet count × monocyte count)/lymphocyte count
SII: Platelet count × absolute neutrophil count/absolute lymphocyte count
SIRI: Neutrophil count × monocyte count/lymphocyte count
PNI: Albumin + 5 × lymphocyte count
GNRI: 1.489 × albumin 41.7 × body weight/ideal body weight
AGR: Albumin/globulin
The dataset was randomly divided into a training set and a validation set at a ratio of 3:2. In the training cohort, receiver operating characteristic (ROC) curves were applied to identify the optimal cutoff values for inflammation and nutrition-related biomarkers. LASSO Cox regression analysis, implemented using the "glmnet" package in R, was performed to identify the most significant prognostic factors. Biomarkers with nonzero coefficients were included in the RS, which was calculated as follows:
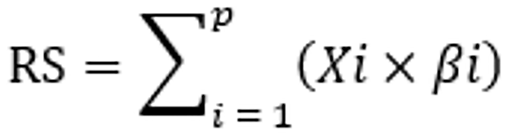
Here, P represents the number of biomarkers, Xi is the value of the i-th biomarker, and βi is the regression coefficient for the corresponding feature. In the training cohort, ROC curves were used to assess the predictive value of the RS for postoperative OS in CRC patients and identify the optimal cutoff value.
The data were analyzed using SPSS 26.0 and R 4.2.1. The Kolmogorov-Smirnov test was used to assess the normality of the variables. Continuous variables with a normal distribution are presented as the means ± SD, with group comparisons made via t tests. Nonnormally distributed variables are presented as the medians (interquartile ranges) and were compared using the rank-sum test. Continuous variables were analyzed using the Mann-Whitney U test or Student’s t test, whereas categorical variables were compared using the χ2 test or Fisher's exact test.
Kaplan-Meier (K-M) survival curves were plotted for OS and compared using the log-rank test. Variables with P < 0.05 in the univariate analysis were included in the multivariate Cox regression analysis to identify independent risk factors. On the basis of these independent risk factors from the development set, a survival nomogram was constructed using the "rms" package in R software.
The concordance index was used to evaluate the predictive accuracy of the nomogram. Calibration curves were used to assess the agreement between the predicted survival and actual survival. Decision curve analysis (DCA) was performed to evaluate the clinical utility of the nomogram. Two-tailed P values less than 0.05 were considered statistically signi
Patients were randomly divided into a training cohort (n = 282) and a validation cohort (n = 188) at a 3:2 ratio. The median follow-up time was 72 months. Overall, 59.4% of the patients were male, and 54.0% had a BMI > 24. Most patients had no history of smoking (68.1%) or alcohol consumption (81.1%). The majority of patients did not present with nerve invasion (82.1%) or vascular cancer emboli (81.5%). In terms of TNM staging, stage III patients accounted for a smaller proportion of patients (39.6%). The detailed clinicopathological characteristics are shown in Table 1. Additionally, there were no significant differences in variables between the training and validation cohorts.
| Characteristic | Overall, n = 470 | Training cohort, n = 282 | Test cohort, n = 188 | P value |
| Gender | 0.283 | |||
| Male | 279 (59.4) | 173 (61.3) | 106 (56.4) | |
| Female | 191 (40.6) | 109 (38.7) | 82 (43.6) | |
| Age, years | 0.404 | |||
| ≤ 60 | 209 (44.5) | 121 (42.9) | 88 (46.8) | |
| > 60 | 261 (55.5) | 161 (57.1) | 100 (53.2) | |
| BMI, kg/m2 | 0.762 | |||
| ≤ 24 | 216 (46.0) | 128 (45.4) | 88 (46.8) | |
| > 24 | 254 (54.0) | 154 (54.6) | 100 (53.2) | |
| Smoking | 0.419 | |||
| Yes | 150 (31.9) | 94 (33.3) | 56 (29.8) | |
| No | 320 (68.1) | 188 (66.7) | 132 (70.2) | |
| Alcohol | 0.113 | |||
| Yes | 89 (18.9) | 60 (21.3) | 29 (15.4) | |
| No | 381 (81.1) | 222 (78.7) | 159 (84.6) | |
| CEA | 0.639 | |||
| Normal | 299 (63.6) | 177 (62.8) | 122 (64.9) | |
| High | 171 (36.4) | 105 (37.2) | 66 (35.1) | |
| Gross appearance | 0.741 | |||
| Bulge | 139 (29.6) | 85 (30.1) | 54 (28.7) | |
| Infiltration or ulcer | 331 (70.4) | 197 (69.9) | 134 (71.3) | |
| Histological type | 0.418 | |||
| Adenocarcinoma | 437 (93.0) | 260 (92.2) | 177 (94.1) | |
| Mucinous adenocarcinoma or signet ring cell cancer | 33 (7.0) | 22 (7.8) | 11 (5.9) | |
| Nerve invasion | 0.883 | |||
| Negative | 386 (82.1) | 231 (81.9) | 155 (82.4) | |
| Positive | 84 (17.9) | 51 (18.1) | 33 (17.6) | |
| Intravascular tumor emboli | 0.846 | |||
| Negative | 383 (81.5) | 229 (81.2) | 154 (81.9) | |
| Positive | 87 (18.5) | 53 (18.8) | 34 (18.1) | |
| T stage | 0.221 | |||
| T1-T2 | 104 (22.1) | 57 (20.2) | 47 (25.0) | |
| T3-T4 | 366 (77.9) | 225 (79.8) | 141 (75.0) | |
| N stage | 0.506 | |||
| N0-N1 | 394 (83.8) | 239 (84.8) | 155 (82.4) | |
| N2-N3 | 76 (16.2) | 43 (15.2) | 33 (17.6) | |
| TNM stage | 0.298 | |||
| I-II | 284 (60.4) | 165 (58.5) | 119 (63.3) | |
| III | 186 (39.6) | 117 (41.5) | 69 (36.7) | |
| Differentiated degree | 0.176 | |||
| Well/moderate | 73 (15.5) | 49 (17.4) | 24 (12.8) | |
| Poor/undifferentiated | 397 (84.5) | 233 (82.6) | 164 (87.2) | |
| NLR median (IQR) | 2.00 (1.50, 2.69) | 2.03 (1.51, 2.82) | 1.96 (1.49, 2.56) | 0.333 |
| MLR median (IQR) | 0.24 (0.19, 0.33) | 0.25 (0.20, 0.33) | 0.24 (0.19, 0.31) | 0.342 |
| PLR median (IQR) | 131.32 (101.58, 173.39) | 130 (101, 175) | 132 (103, 173) | 0.905 |
| ALI median (IQR) | 486.92 (371.72, 673.36) | 486 (366, 674) | 492 (378, 669) | 0.499 |
| PIV median (IQR) | 210.31 (135.42, 334.68) | 220 (137, 337) | 204 (130, 333) | 0.403 |
| SII median (IQR) | 473.60 (330.39, 703.21) | 474 (333, 712) | 472 (326, 680) | 0.732 |
| SIRI median (IQR) | 0.86 (0.59, 1.34) | 0.88 (0.61, 1.40) | 0.81 (0.57, 1.25) | 0.171 |
| PNI median (IQR) | 50.20 (46.86, 52.94) | 49.9 (46.8, 53.0) | 50.4 (47.0, 52.8) | 0.486 |
| GNRI median (IQR) | 106.50 (100.81, 112.72) | 106 (100, 113) | 107 (101, 113) | 0.630 |
| AGR median (IQR) | 1.49 (1.33, 1.68) | 1.49 (1.32, 1.72) | 1.49 (1.34, 1.65) | 0.975 |
The optimal cutoff values for inflammation- and nutrition-related biomarkers in the training cohort were determined via ROC curves. Patients were subsequently divided into high and low groups on the basis of these cutoff values. Univariate Cox regression analysis for all inflammation- and nutrition-related biomarkers revealed that patients in the high-nutrition-related biomarker group had higher OS rates than did those in the low-nutrition-related biomarker group. However, the opposite trend was observed in the inflammation-related biomarker groups. All biomarkers demonstrated significant predictive value for OS (P < 0.05; Table 2).
| Variable | Cutoff value | Categories | HR | 95%CI | P value |
| NLR | 2.07 | High (≥ 2.07) vs low (< 2.07) | 3.07 | 1.86, 5.05 | < 0.001 |
| MLR | 0.28 | High (≥ 0.28) vs low (< 0.28) | 4.09 | 2.52, 6.62 | < 0.001 |
| PLR | 166.66 | High (≥ 166.66) vs low (< 166.66) | 2.74 | 1.74, 4.34 | < 0.001 |
| PIV | 348.45 | High (≥ 348.45) vs low (< 348.45) | 7.23 | 4.52, 11.57 | < 0.001 |
| SII | 576.92 | High (≥ 576.92) vs low (< 576.92) | 3.40 | 2.12, 5.44 | < 0.001 |
| SIRI | 14.15 | High (≥ 14.15) vs low (< 14.15) | 6.45 | 4.02, 10.34 | < 0.001 |
| PNI | 47.05 | High (≥ 47.05) vs low (< 47.05) | 0.50 | 0.32, 0.79 | 0.003 |
| GNRI | 103.95 | High (≥ 103.95) vs low (< 103.95) | 0.40 | 0.25, 0.63 | < 0.001 |
| AGR | 1.40 | High (≥ 1.40) vs low (< 1.40) | 0.23 | 0.14, 0.38 | < 0.001 |
| ALI | 367.75 | High (≥ 367.75) vs low (< 367.75) | 0.27 | 0.17, 0.42 | < 0.001 |
Biomarkers with P < 0.05 from univariate Cox regression in the training cohort were incorporated into the LASSO-Cox analysis. Among the 10 candidate parameters, 5 potential factors were selected (Figure 1). The RS was calculated on the basis of the corresponding coefficients from the LASSO analysis via the following formula: RS = 0.0981 × MLR + 0.7689 × PIV + 0.5351 × SIRI - 0.0318 × PNI - 0.5125 × AGR.

The optimal cutoff value for the RS was determined to be 266.24 using ROC curve analysis (Figure 2A). On the basis of this cutoff, patients were categorized into high-RS and low-RS groups. K-M survival curves revealed that the OS probability was significantly greater in the low-RS group than in the high-RS group (P < 0.01; Figure 2B).

Table 3 presents the results of univariate and multivariate Cox regression analyses in the training cohort, highlighting the impact of baseline characteristics and the RS on OS. Univariate analysis revealed that gross appearance, T stage, N stage, TNM stage, degree of differentiation, nerve invasion, intravascular tumor emboli, CEA, and the RS were significantly associated with OS (P < 0.05). Multivariate Cox regression analysis revealed that the degree of differentiation [hazard ratio (HR) = 2.04, 95%CI: 1.33-3.13, P = 0.001], degree of nerve invasion (HR = 1.66, 95%CI: 1.08-2.55, P = 0.022), and RS (HR = 6.62, 95%CI: 4.56-9.62, P < 0.001) were independent prognostic factors for CRC patients.
| Characteristics | Univariate analysis HR (95%CI) | P value | Multivariate analysis HR (95%CI) | P value |
| Age, years | ||||
| ≤ 60 | Reference | |||
| > 60 | 0.98 (0.68-1.41) | 0.921 | ||
| Gender | ||||
| Male | Reference | |||
| Female | 1.30 (0.90-1.87) | 0.163 | ||
| BMI, kg/m2 | ||||
| ≤ 24 | Reference | |||
| > 24 | 1.12 (0.78-1.60) | 0.550 | ||
| Smoking | ||||
| Yes | Reference | |||
| No | 1.50 (1.00-2.26) | 0.051 | ||
| Alcohol | ||||
| Yes | Reference | |||
| No | 1.20 (0.75-1.92) | 0.453 | ||
| Gross appearance | ||||
| Bulge | Reference | Reference | ||
| Infiltration or ulcer | 1.58 (1.03-2.42) | 0.037 | 1.06 (0.67-1.68) | 0.812 |
| Histological type | ||||
| Adenocarcinoma | Reference | |||
| Mucinous adenocarcinoma or signet ring cell cancer | 1.56 (0.86-2.84) | 0.141 | ||
| T stage | ||||
| T1-T2 | Reference | Reference | ||
| T3-T4 | 4.12 (2.09-8.12) | < 0.001 | 1.66 (0.80-3.43) | 0.175 |
| N stage | ||||
| N0-N1 | Reference | Reference | ||
| N2-N3 | 2.40 (1.61-3.58) | < 0.001 | 1.61 (1.00-2.59) | 0.052 |
| TNM stage | ||||
| I-II | Reference | Reference | ||
| III | 2.09 (1.46-2.98) | < 0.001 | 1.26 (0.82-1.93) | 0.285 |
| Differentiated degree | ||||
| Poor/undifferentiated | Reference | Reference | ||
| Well/moderate | 2.64 (1.77-3.92) | < 0.001 | 2.04 (1.33-3.13) | 0.001 |
| Nerve invasion | ||||
| Negative | Reference | Reference | ||
| Positive | 2.48 (1.69-3.66) | < 0.001 | 1.66 (1.08-2.55) | 0.022 |
| Intravascular tumor emboli | ||||
| Negative | Reference | Reference | ||
| Positive | 1.56 (1.03-2.37) | 0.036 | 1.05 (0.67-1.65) | 0.837 |
| CEA | ||||
| Normal | Reference | Reference | ||
| High | 1.69 (1.19-2.42) | 0.004 | 1.25 (0.85-1.82) | 0.255 |
| RS | ||||
| < 266.24 | Reference | Reference | ||
| ≥ 266.24 | 6.86 (4.77-9.86) | < 0.001 | 6.62 (4.56-9.62) | < 0.001 |
On the basis of the results of multivariate Cox regression analyses, three independent risk factors (differentiation degree, nerve invasion, and RS) were included in the construction of the nomogram. These factors can predict the 1-year, 3-year, and 5-year OS rates of CRC patients. The nomogram was visualized using the "egplot" package (Figure 3). In the nomogram, the score assigned to each variable was determined by drawing a vertical line corresponding to its specific value on the scale. In the training cohort, the areas under the curve for 1-year, 3-year, and 5-year OS in the clinical model were 0.767, 0.823, and 0.831, respectively (Figure 4A). In the validation cohort, the areas were 0.945 for 1-year OS, 0.825 for 3-year OS, and 0.839 for 5-year OS (Figure 4B). These values indicate that the predictive model has strong discriminative ability. The calibration curves of the model were closely aligned with the ideal curve, suggesting that the predicted outcomes were consistent with the actual results (Figure 5). Moreover, DCA further confirmed the significant clinical efficacy of the model in predicting the 1-year, 3-year, and 5-year survival probabilities in both the training and validation cohorts (Figure 6).


This study constructed and validated a clinical model for predicting the OS of CRC patients on the basis of 470 CRC patients who underwent radical resection, incorporating inflammatory and nutrition-related biomarkers. The patients were randomly divided into a training group (n = 282) and a validation group (n = 188) at a 3:2 ratio, with no significant differences in baselines between the two groups, ensuring the robustness of model development and validation. Univariate Cox regression analysis revealed a positive correlation between higher levels of nutrition-related biomarkers and OS, whereas higher levels of inflammation-related biomarkers were negatively correlated with OS. In the training group, five independent factors (MLR, PIV, SIRI, PNI, and AGR) were selected from 10 candidate parameters using LASSO regression to construct an RS formula. Patients were categorized into high-RS and low-RS groups on the basis of the cutoff value derived from the ROC curve. K-M analysis revealed that the OS of the low-RS group was significantly greater than that of the high-RS group (P < 0.01). This risk scoring model effectively integrates inflammatory and nutritional indicators into a single score, facilitating clinical application. Multivariate Cox regression analysis identified differentiation degree, degree of neural invasion, and the RS as independent risk factors. A nomogram model based on these three independent risk factors was created to predict the 1-year, 3-year, and 5-year OS of CRC patients. ROC curve analysis for both groups demonstrated excellent predictive performance (area under the curve > 0.75). The calibration curves showed high consistency between the predicted and actual results, whereas the DCA confirmed the clinical utility of the model. These findings highlight the potential clinical value of this model.
The prognosis of patients with CRC is influenced by various factors, among which inflammation and nutritional status are recognized as significant biomarkers. Chronic inflammation has been demonstrated to promote tumor initiation and progression and may affect the tumor's response to chemotherapy and immunotherapy. Our study revealed that biomarkers associated with inflammation may be closely related to patients' treatment responsiveness, particularly in response to chemotherapy or immunotherapy. Furthermore, malnutrition can potentially lead to a decline in immune function, thereby affecting patients' tolerance to treatment. On the basis of these mechanisms, our model can provide valuable information for individualized treatment, especially in high-risk patients with poor inflammation and nutritional status.
Inflammation is closely linked to cancer and plays a key role in its initiation and progression[20]. Inflammatory cells such as macrophages and neutrophils release reactive oxygen species (ROS) and reactive nitrogen species, causing oxidative stress and DNA damage and increasing the risk of genetic mutations[21]. Inflammation-induced DNA damage and epigenetic changes can inactivate tumor suppressor genes or activate oncogenes. Chronic inflammation promotes the clonal expansion of mutated cells through the secretion of inflammatory cytokines [e.g., interleukin-6 (IL-6) and tumor necrosis factor-α] and growth factors. However, tumorigenesis also induces inflammation[22]. CRC cells interact with immune cells in the tumor microenvironment (TME), suppressing T cell activity and inducing an immunosuppressive environment[23]. Tumor-induced inflammation also supports tumor growth and invasion through the secretion of cytokines [e.g., IL-10 and transforming growth factor (TGF-β)] and the promotion of angiogenesis[24,25]. Tumor cells alter the TME by secreting factors such as TGF-β, which suppresses antitumor immunity. Regulatory T cells (Tregs) and myeloid-derived suppressor cells are recruited to the TME, further enhancing immunosuppression[26]. Cancer-associated fibroblasts and myeloid cells, such as tumor-associated macrophages (TAMs), are polarized under inflammatory signaling[27], promoting tumor cell survival, invasion, and metastasis. Inflammation also strengthens the physical barrier of the TME, hindering T-cell entry into the tumor core[6]. Inflammation promotes the initiation and progression of CRC and also significantly influences treatment response[5]. Radiation and chemotherapy cause tumor cell death, releasing damage-associated molecular patterns that activate antigen-presenting cells and enhance tumor antigen-specific T cell responses[28,29]. However, treatment-induced inflammation may also weaken the effectiveness of immunotherapy by recruiting immunosuppressive cells (e.g., Tregs) or promoting the polarization of TAMs[30,31].
Growing evidence indicates that nutrition is vital for cancer onset, progression, and prognosis[32,33]. Studies on nutrition have shown that diet significantly influences the development of cancer, with both anti-inflammatory and proinflammatory foods modulating the body’s inflammatory response, thus either increasing or decreasing the risk of cancer. The intake of proinflammatory foods, such as those high in refined sugars, fats, and processed meats, can promote inflammation in the body, leading to the development of conditions that favor tumor growth. Conversely, a diet rich in anti-inflammatory foods, such as fruits, vegetables, and omega-3 fatty acids, has been shown to reduce inflammation, potentially lowering cancer risk and supporting the body’s immune response in combating malignant cells.
Obesity, especially excess fat accumulation, is a well-established risk factor for various cancers, including colorectal, breast, and pancreatic cancer[34-36]. The link between obesity and cancer is due not only to the mechanical effects of increased body mass but also to metabolic and hormonal changes associated with excess fat. In obese individuals, the body experiences dysregulated metabolism, which impacts cellular function and promotes an environment conducive to cancer development. This phenomenon is especially evident in the modification of key intracellular signaling pathways, such as the mTOR, PI3K/AKT, and MAPK pathways, which play roles in cell growth, survival, and transformation from normal to cancerous cells[37,38]. Furthermore, obesity is often associated with chronic low-grade systemic inflammation, a condition in which low-level inflammatory markers are constantly elevated in the bloodstream; this can further facilitate tumor development and progression by creating a microenvironment that promotes cancer cell survival, migration, and invasion[39,40].
Preoperative malnutrition is highly prevalent among CRC patients and has a profound negative impact on their postoperative recovery and overall prognosis[8]. Malnutrition in cancer patients can result from multiple factors, including the metabolic demands of the tumor, treatment-related side effects (such as nausea, vomiting, and reduced appetite), and difficulty in maintaining adequate nutritional intake. This condition significantly increases the risk of complications such as postoperative infections, delayed wound healing, extended hospital stays, and a slower recovery process. Malnourished patients are also more likely to experience a weakened immune response, which further heightens their vulnerability to infections and poor surgical outcomes.
Early identification and management of malnutrition in CRC patients are essential for better clinical outcomes. Several studies have shown that addressing nutritional deficiencies through early interventions, such as supplementation or nutritional support, can reduce the incidence of postoperative complications, shorten hospital stays, and improve OS rates. Preoperative nutritional assessment, including screening for malnutrition, should be a routine part of presurgical evaluation. Nutritional interventions, such as optimizing protein intake, correcting deficiencies in vitamins and minerals, and managing inflammation, can enhance patients’ abilities to recover and improve their response to surgery and chemotherapy.
Owing to the high prevalence of malnutrition in cancer patients and its significant impact on outcomes, health care providers must prioritize thorough preoperative nutritional assessments and interventions. Such efforts minimize the risks of postoperative complications and contribute to an overall improvement in the quality of life and prognosis for CRC patients undergoing surgery. By optimizing the nutritional status of patients before surgery, clinicians can increase recovery times, reduce hospital readmissions, and improve the likelihood of successful cancer treatment outcomes.
To improve the survival rate of these patients, researchers have focused on developing and utilizing biomarkers to predict disease recurrence or poor prognosis, aiding clinicians in identifying patients who may require more aggressive treatment strategies[41-44]. Both the systemic inflammatory response and nutritional status are closely associated with the prognosis of cancer patients. Numerous studies have identified serum biomarkers related to inflammation and nutrition, which can be easily obtained through routine blood tests and serve as effective predictors of prognosis in CRC patients. However, the optimal combination and cutoff values for these biomarkers may differ depending on the cancer type and individual patient characteristics. Additionally, cancer treatments may influence the inflammatory status, necessitating in-depth studies of specific cancer types to ensure the accuracy of prognostic assessments.
In our study, we performed a comprehensive analysis of 10 commonly used biomarkers based on inflammation- and nutrition-related markers, including the NLR, MLR, PLR, PIV, SII, SIRI, PNI, and GNRI, all of which offer prognostic value. To address multicollinearity, we conducted a LASSO Cox regression analysis and identified five significant inflammatory biomarkers to construct an RS. LASSO was chosen because it imposes a penalty on the magnitude of regression coefficients, which helps reduce the complexity of the model by excluding less relevant features. To assess the stability and robustness of the selected features, we employed k-fold cross-validation. Cross-validation ensures that the model is not overly fitted to any one subset of the data by repeatedly splitting the dataset into training and validation sets. This approach provides a more reliable estimate of model performance and helps prevent overfitting. We found that, in the training set, the RS was a significant independent prognostic factor, and its prognostic value was further validated in the entire cohort.
However, several limitations in our study must be acknowledged. This was a single-center, retrospective study with a relatively small sample size, which limits the generalizability and external validity of our findings. Retrospective studies often rely on already collected clinical data, which, while cost-effective and easier to conduct, are more susceptible to selection bias. Specifically, patient selection may not fully represent the target population, making the results difficult to generalize to a broader patient group. Additionally, the small sample size may have affected the statistical power of the study, especially when subgroup analyses were performed. An insufficient sample size may fail to capture population-level differences, increasing the likelihood of false-positive or false-negative results. Moreover, the smaller sample size makes the influence of confounding factors more pronounced. Although we controlled for some known confounders using multivariable analysis, many potential confounders - especially those not accounted for - could still have significant effects on the results. The limitation in sample size also reduces the stability and reliability of the models, which in turn challenges the generalizability and applicability of the conclusions. Therefore, to further validate our findings and provide more robust evidence, future studies should be conducted on a larger scale with a prospective, multicenter design. Multicenter studies involving diverse populations from different regions and hospitals can help mitigate selection bias and improve the representativeness and external validity of the findings. Furthermore, prospective study designs would reduce potential biases related to data collection or measurement, increasing the reliability of the results. An expanded sample size would also increase statistical power, allowing for the detection of smaller differences, and could provide more precise control over confounding factors, enhancing the accuracy and stability of the findings. Since all the participants were from a single institution, the results may not be applicable to other health care settings. Differences in clinical practices, patient demographics, and disease characteristics across institutions could affect the outcomes. External validation in diverse cohorts from various centers is essential to assess the broader applicability of the biomarkers identified. While internal validation is a useful first step, it cannot confirm the model's applicability across different patient populations or clinical settings. External validation is critical for determining whether the model's predictive power holds in independent datasets from other institutions. Future research should focus on testing the model with data from multiple centers or external cohorts to establish its broader applicability and clinical relevance. Our study focused only on nonmetastatic CRC patients, which limits the applicability of the findings to patients with metastatic disease. Metastatic CRC involves different clinical dynamics, treatment approaches, and prognoses. Further research involving both metastatic and nonmetastatic patients is needed to determine whether these biomarkers have predictive value across different stages of CRC. Future studies should aim to include metastatic CRC cohorts to assess whether the proposed model is applicable to advanced disease stages. This will help validate the model’s robustness and enhance its potential clinical utility across all stages of CRC. Although the chosen thresholds were statistically derived from our cohort and showed prognostic value, these values may not be suitable for other patient populations or clinical environments. The variability in biomarker thresholds across different cohorts underscores the need for external validation in diverse, independent populations. Future research should focus on establishing standardized, evidence-based cutoff values through large multicenter studies and external validation cohorts. This would improve the generalizability and clinical applicability of the proposed risk model, ensuring consistent results across different health care systems. Potential confounders, including treatment protocols, tumor heterogeneity, and patient-specific characteristics, represent significant factors that could affect the prognostic accuracy of biomarkers in patients with CRC. In our study, although we attempted to control for key clinical variables, the influence of treatment modality and tumor heterogeneity was not comprehensively addressed. Tumor heterogeneity, particularly genetic mutations and microenvironment variations, could influence biomarker expression and, subsequently, their prognostic value. Additionally, patient-specific factors, such as comorbidities and lifestyle choices, could further confound the results. Future research should incorporate these variables into more sophisticated multivariable models to better isolate the impact of biomarkers. Moreover, prospective, multicenter studies with larger sample sizes are needed to validate the findings in diverse populations and clinical settings. One key limitation of our study is the lack of longitudinal analysis, which could provide valuable insights into how biomarkers change over time in response to treatment or disease progression. Biomarkers measured at a single time point may not fully reflect their dynamic role in predicting long-term patient outcomes. Previous research has demonstrated that biomarkers can fluctuate during treatment, and these changes can have important implications for prognosis. Incorporating longitudinal assessments of biomarkers would allow for a more accurate and nuanced evaluation of their predictive capacity. Future research should aim to include repeated biomarker measurements at various time points throughout treatment to better understand their role in disease progression and therapeutic response. Future studies should incorporate longitudinal data to improve the prognostic accuracy of biomarkers and validate their predictive value across different stages of CRC treatment.
Despite these limitations, our results indicate that the RS is an independent prognostic factor for CRC patients. A higher preoperative RS is linked to poorer survival outcomes, underscoring its potential as a prognostic biomarker. Assessing inflammatory and nutritional status preoperatively can help clinicians identify high-risk patients and guide treatment decisions, potentially personalizing strategies and improving CRC outcomes.
In conclusion, while further validation through larger, multicenter prospective studies is needed, our findings highlight the potential for incorporating inflammatory and nutritional biomarkers into clinical practice, which could improve prognostic assessments and inform more effective treatment strategies.
| 1. | Siegel RL, Miller KD, Wagle NS, Jemal A. Cancer statistics, 2023. CA Cancer J Clin. 2023;73:17-48. [RCA] [PubMed] [DOI] [Full Text] [Cited by in Crossref: 116] [Cited by in RCA: 9898] [Article Influence: 4949.0] [Reference Citation Analysis (2)] |
| 2. | Baidoun F, Elshiwy K, Elkeraie Y, Merjaneh Z, Khoudari G, Sarmini MT, Gad M, Al-Husseini M, Saad A. Colorectal Cancer Epidemiology: Recent Trends and Impact on Outcomes. Curr Drug Targets. 2021;22:998-1009. [RCA] [PubMed] [DOI] [Full Text] [Cited by in Crossref: 26] [Cited by in RCA: 154] [Article Influence: 38.5] [Reference Citation Analysis (2)] |
| 3. | Gillis C, Richer L, Fenton TR, Gramlich L, Keller H, Culos-Reed SN, Sajobi TT, Awasthi R, Carli F. Colorectal cancer patients with malnutrition suffer poor physical and mental health before surgery. Surgery. 2021;170:841-847. [RCA] [PubMed] [DOI] [Full Text] [Cited by in Crossref: 11] [Cited by in RCA: 36] [Article Influence: 9.0] [Reference Citation Analysis (0)] |
| 4. | Schmitt M, Greten FR. The inflammatory pathogenesis of colorectal cancer. Nat Rev Immunol. 2021;21:653-667. [RCA] [PubMed] [DOI] [Full Text] [Cited by in Crossref: 109] [Cited by in RCA: 420] [Article Influence: 105.0] [Reference Citation Analysis (0)] |
| 5. | Piotrowski I, Kulcenty K, Suchorska W. Interplay between inflammation and cancer. Rep Pract Oncol Radiother. 2020;25:422-427. [RCA] [PubMed] [DOI] [Full Text] [Full Text (PDF)] [Cited by in Crossref: 60] [Cited by in RCA: 110] [Article Influence: 22.0] [Reference Citation Analysis (0)] |
| 6. | Grivennikov SI, Greten FR, Karin M. Immunity, inflammation, and cancer. Cell. 2010;140:883-899. [RCA] [PubMed] [DOI] [Full Text] [Full Text (PDF)] [Cited by in Crossref: 8437] [Cited by in RCA: 8170] [Article Influence: 544.7] [Reference Citation Analysis (0)] |
| 7. | Sinicrope FA, Foster NR, Yothers G, Benson A, Seitz JF, Labianca R, Goldberg RM, Degramont A, O'Connell MJ, Sargent DJ; Adjuvant Colon Cancer Endpoints (ACCENT) Group. Body mass index at diagnosis and survival among colon cancer patients enrolled in clinical trials of adjuvant chemotherapy. Cancer. 2013;119:1528-1536. [RCA] [PubMed] [DOI] [Full Text] [Cited by in Crossref: 112] [Cited by in RCA: 143] [Article Influence: 11.9] [Reference Citation Analysis (0)] |
| 8. | Gupta A, Gupta E, Hilsden R, Hawel JD, Elnahas AI, Schlachta CM, Alkhamesi NA. Preoperative malnutrition in patients with colorectal cancer. Can J Surg. 2021;64:E621-E629. [RCA] [PubMed] [DOI] [Full Text] [Full Text (PDF)] [Cited by in Crossref: 6] [Cited by in RCA: 61] [Article Influence: 15.3] [Reference Citation Analysis (0)] |
| 9. | Almasaudi AS, McSorley ST, Dolan RD, Edwards CA, McMillan DC. The relation between Malnutrition Universal Screening Tool (MUST), computed tomography-derived body composition, systemic inflammation, and clinical outcomes in patients undergoing surgery for colorectal cancer. Am J Clin Nutr. 2019;110:1327-1334. [RCA] [PubMed] [DOI] [Full Text] [Cited by in Crossref: 45] [Cited by in RCA: 62] [Article Influence: 10.3] [Reference Citation Analysis (0)] |
| 10. | Guthrie GJ, Charles KA, Roxburgh CS, Horgan PG, McMillan DC, Clarke SJ. The systemic inflammation-based neutrophil-lymphocyte ratio: experience in patients with cancer. Crit Rev Oncol Hematol. 2013;88:218-230. [RCA] [PubMed] [DOI] [Full Text] [Cited by in Crossref: 784] [Cited by in RCA: 1091] [Article Influence: 90.9] [Reference Citation Analysis (0)] |
| 11. | Tao BF, Zhu HQ, Qi LN, Zhong JH, Mai RY, Ma L. Preoperative monocyte-to-lymphocyte ratio as a prognosis predictor after curative hepatectomy for intrahepatic cholangiocarcinoma. BMC Cancer. 2024;24:1179. [RCA] [PubMed] [DOI] [Full Text] [Cited by in Crossref: 3] [Reference Citation Analysis (0)] |
| 12. | Fu M, Zhang X, Shen F, Ma J, Li Z. Prognostic value of peripheral blood neutrophil/lymphocyte ratio, platelet/lymphocyte ratio, pan-immune-inflammation value and systemic immune-inflammation index for the efficacy of immunotherapy in patients with advanced gastric cancer. Immunotherapy. 2024. [RCA] [PubMed] [DOI] [Full Text] [Cited by in RCA: 12] [Reference Citation Analysis (0)] |
| 13. | Tan J, Song G, Wang S, Dong L, Liu X, Jiang Z, Qin A, Tang Y, Qin W. Platelet-to-Albumin Ratio: A Novel IgA Nephropathy Prognosis Predictor. Front Immunol. 2022;13:842362. [RCA] [PubMed] [DOI] [Full Text] [Full Text (PDF)] [Cited by in Crossref: 2] [Cited by in RCA: 28] [Article Influence: 9.3] [Reference Citation Analysis (0)] |
| 14. | Fucà G, Guarini V, Antoniotti C, Morano F, Moretto R, Corallo S, Marmorino F, Lonardi S, Rimassa L, Sartore-Bianchi A, Borelli B, Tampellini M, Bustreo S, Claravezza M, Boccaccino A, Murialdo R, Zaniboni A, Tomasello G, Loupakis F, Adamo V, Tonini G, Cortesi E, de Braud F, Cremolini C, Pietrantonio F. The Pan-Immune-Inflammation Value is a new prognostic biomarker in metastatic colorectal cancer: results from a pooled-analysis of the Valentino and TRIBE first-line trials. Br J Cancer. 2020;123:403-409. [RCA] [PubMed] [DOI] [Full Text] [Full Text (PDF)] [Cited by in Crossref: 30] [Cited by in RCA: 191] [Article Influence: 38.2] [Reference Citation Analysis (0)] |
| 15. | He K, Si L, Pan X, Sun L, Wang Y, Lu J, Wang X. Preoperative Systemic Immune-Inflammation Index (SII) as a Superior Predictor of Long-Term Survival Outcome in Patients With Stage I-II Gastric Cancer After Radical Surgery. Front Oncol. 2022;12:829689. [RCA] [PubMed] [DOI] [Full Text] [Full Text (PDF)] [Cited by in Crossref: 6] [Cited by in RCA: 65] [Article Influence: 21.7] [Reference Citation Analysis (0)] |
| 16. | Pacheco-Barcia V, Mondéjar Solís R, France T, Asselah J, Donnay O, Zogopoulos G, Bouganim N, Guo K, Rogado J, Martin E, Alcindor T, Colomer R. A systemic inflammation response index (SIRI) correlates with survival and predicts oncological outcome for mFOLFIRINOX therapy in metastatic pancreatic cancer. Pancreatology. 2020;20:254-264. [RCA] [PubMed] [DOI] [Full Text] [Cited by in Crossref: 24] [Cited by in RCA: 53] [Article Influence: 10.6] [Reference Citation Analysis (1)] |
| 17. | Lei W, Wang W, Qin S, Yao W. Predictive value of inflammation and nutritional index in immunotherapy for stage IV non-small cell lung cancer and model construction. Sci Rep. 2024;14:17511. [RCA] [PubMed] [DOI] [Full Text] [Cited by in RCA: 6] [Reference Citation Analysis (0)] |
| 18. | Xiang S, Yang YX, Pan WJ, Li Y, Zhang JH, Gao Y, Liu S. Prognostic value of systemic immune inflammation index and geriatric nutrition risk index in early-onset colorectal cancer. Front Nutr. 2023;10:1134300. [RCA] [PubMed] [DOI] [Full Text] [Full Text (PDF)] [Cited by in RCA: 11] [Reference Citation Analysis (0)] |
| 19. | Lv GY, An L, Sun XD, Hu YL, Sun DW. Pretreatment albumin to globulin ratio can serve as a prognostic marker in human cancers: a meta-analysis. Clin Chim Acta. 2018;476:81-91. [RCA] [PubMed] [DOI] [Full Text] [Cited by in Crossref: 56] [Cited by in RCA: 87] [Article Influence: 10.9] [Reference Citation Analysis (0)] |
| 20. | Singh N, Baby D, Rajguru JP, Patil PB, Thakkannavar SS, Pujari VB. Inflammation and cancer. Ann Afr Med. 2019;18:121-126. [RCA] [PubMed] [DOI] [Full Text] [Cited by in Crossref: 267] [Cited by in RCA: 831] [Article Influence: 166.2] [Reference Citation Analysis (0)] |
| 21. | Greten FR, Grivennikov SI. Inflammation and Cancer: Triggers, Mechanisms, and Consequences. Immunity. 2019;51:27-41. [RCA] [PubMed] [DOI] [Full Text] [Cited by in Crossref: 922] [Cited by in RCA: 2413] [Article Influence: 402.2] [Reference Citation Analysis (0)] |
| 22. | Petty AJ, Yang Y. Tumor-associated macrophages: implications in cancer immunotherapy. Immunotherapy. 2017;9:289-302. [RCA] [PubMed] [DOI] [Full Text] [Cited by in Crossref: 176] [Cited by in RCA: 268] [Article Influence: 33.5] [Reference Citation Analysis (0)] |
| 23. | Liu J, Lin PC, Zhou BP. Inflammation fuels tumor progress and metastasis. Curr Pharm Des. 2015;21:3032-3040. [RCA] [PubMed] [DOI] [Full Text] [Cited by in Crossref: 47] [Cited by in RCA: 72] [Article Influence: 8.0] [Reference Citation Analysis (0)] |
| 24. | Aguilar-Cazares D, Chavez-Dominguez R, Carlos-Reyes A, Lopez-Camarillo C, Hernadez de la Cruz ON, Lopez-Gonzalez JS. Contribution of Angiogenesis to Inflammation and Cancer. Front Oncol. 2019;9:1399. [RCA] [PubMed] [DOI] [Full Text] [Full Text (PDF)] [Cited by in Crossref: 243] [Cited by in RCA: 226] [Article Influence: 37.7] [Reference Citation Analysis (0)] |
| 25. | Bujak JK, Kosmala D, Szopa IM, Majchrzak K, Bednarczyk P. Inflammation, Cancer and Immunity-Implication of TRPV1 Channel. Front Oncol. 2019;9:1087. [RCA] [PubMed] [DOI] [Full Text] [Full Text (PDF)] [Cited by in Crossref: 86] [Cited by in RCA: 193] [Article Influence: 32.2] [Reference Citation Analysis (0)] |
| 26. | Anderson NM, Simon MC. The tumor microenvironment. Curr Biol. 2020;30:R921-R925. [RCA] [PubMed] [DOI] [Full Text] [Cited by in Crossref: 232] [Cited by in RCA: 1517] [Article Influence: 379.3] [Reference Citation Analysis (0)] |
| 27. | Mao X, Xu J, Wang W, Liang C, Hua J, Liu J, Zhang B, Meng Q, Yu X, Shi S. Crosstalk between cancer-associated fibroblasts and immune cells in the tumor microenvironment: new findings and future perspectives. Mol Cancer. 2021;20:131. [RCA] [PubMed] [DOI] [Full Text] [Full Text (PDF)] [Cited by in Crossref: 1314] [Cited by in RCA: 1311] [Article Influence: 327.8] [Reference Citation Analysis (0)] |
| 28. | Kaczmarek A, Vandenabeele P, Krysko DV. Necroptosis: the release of damage-associated molecular patterns and its physiological relevance. Immunity. 2013;38:209-223. [RCA] [PubMed] [DOI] [Full Text] [Cited by in Crossref: 833] [Cited by in RCA: 1167] [Article Influence: 97.3] [Reference Citation Analysis (0)] |
| 29. | Hernandez C, Huebener P, Schwabe RF. Damage-associated molecular patterns in cancer: a double-edged sword. Oncogene. 2016;35:5931-5941. [RCA] [PubMed] [DOI] [Full Text] [Full Text (PDF)] [Cited by in Crossref: 229] [Cited by in RCA: 346] [Article Influence: 38.4] [Reference Citation Analysis (0)] |
| 30. | Sun L, Clavijo PE, Robbins Y, Patel P, Friedman J, Greene S, Das R, Silvin C, Van Waes C, Horn LA, Schlom J, Palena C, Maeda D, Zebala J, Allen CT. Inhibiting myeloid-derived suppressor cell trafficking enhances T cell immunotherapy. JCI Insight. 2019;4:e126853. [RCA] [PubMed] [DOI] [Full Text] [Cited by in Crossref: 108] [Cited by in RCA: 180] [Article Influence: 30.0] [Reference Citation Analysis (0)] |
| 31. | Shaked Y. The pro-tumorigenic host response to cancer therapies. Nat Rev Cancer. 2019;19:667-685. [RCA] [PubMed] [DOI] [Full Text] [Cited by in Crossref: 102] [Cited by in RCA: 144] [Article Influence: 24.0] [Reference Citation Analysis (0)] |
| 32. | Liu Y, Liu X, Duan L, Zhao Y, He Y, Li W, Cui J. Prognostic value of the combined effect of nutritional status and body water component in patients with colorectal cancer. Sci Rep. 2023;13:17570. [RCA] [PubMed] [DOI] [Full Text] [Reference Citation Analysis (0)] |
| 33. | Wiseman MJ. Nutrition and cancer: prevention and survival. Br J Nutr. 2019;122:481-487. [RCA] [PubMed] [DOI] [Full Text] [Cited by in Crossref: 38] [Cited by in RCA: 64] [Article Influence: 9.1] [Reference Citation Analysis (0)] |
| 34. | Quail DF, Dannenberg AJ. The obese adipose tissue microenvironment in cancer development and progression. Nat Rev Endocrinol. 2019;15:139-154. [RCA] [PubMed] [DOI] [Full Text] [Cited by in Crossref: 251] [Cited by in RCA: 364] [Article Influence: 60.7] [Reference Citation Analysis (0)] |
| 35. | Lee K, Kruper L, Dieli-Conwright CM, Mortimer JE. The Impact of Obesity on Breast Cancer Diagnosis and Treatment. Curr Oncol Rep. 2019;21:41. [RCA] [PubMed] [DOI] [Full Text] [Full Text (PDF)] [Cited by in Crossref: 93] [Cited by in RCA: 215] [Article Influence: 35.8] [Reference Citation Analysis (0)] |
| 36. | Avgerinos KI, Spyrou N, Mantzoros CS, Dalamaga M. Obesity and cancer risk: Emerging biological mechanisms and perspectives. Metabolism. 2019;92:121-135. [RCA] [PubMed] [DOI] [Full Text] [Cited by in Crossref: 522] [Cited by in RCA: 928] [Article Influence: 154.7] [Reference Citation Analysis (0)] |
| 37. | Ahmad R, Singh JK, Wunnava A, Al-Obeed O, Abdulla M, Srivastava SK. Emerging trends in colorectal cancer: Dysregulated signaling pathways (Review). Int J Mol Med. 2021;47:14. [RCA] [PubMed] [DOI] [Full Text] [Full Text (PDF)] [Cited by in Crossref: 29] [Cited by in RCA: 109] [Article Influence: 27.3] [Reference Citation Analysis (0)] |
| 38. | Wen X, Zhang B, Wu B, Xiao H, Li Z, Li R, Xu X, Li T. Signaling pathways in obesity: mechanisms and therapeutic interventions. Signal Transduct Target Ther. 2022;7:298. [RCA] [PubMed] [DOI] [Full Text] [Full Text (PDF)] [Cited by in Crossref: 1] [Cited by in RCA: 177] [Article Influence: 59.0] [Reference Citation Analysis (0)] |
| 39. | Calder PC, Ahluwalia N, Brouns F, Buetler T, Clement K, Cunningham K, Esposito K, Jönsson LS, Kolb H, Lansink M, Marcos A, Margioris A, Matusheski N, Nordmann H, O'Brien J, Pugliese G, Rizkalla S, Schalkwijk C, Tuomilehto J, Wärnberg J, Watzl B, Winklhofer-Roob BM. Dietary factors and low-grade inflammation in relation to overweight and obesity. Br J Nutr. 2011;106 Suppl 3:S5-78. [RCA] [PubMed] [DOI] [Full Text] [Cited by in Crossref: 630] [Cited by in RCA: 763] [Article Influence: 58.7] [Reference Citation Analysis (0)] |
| 40. | Khanna D, Khanna S, Khanna P, Kahar P, Patel BM. Obesity: A Chronic Low-Grade Inflammation and Its Markers. Cureus. 2022;14:e22711. [RCA] [PubMed] [DOI] [Full Text] [Full Text (PDF)] [Cited by in Crossref: 4] [Cited by in RCA: 144] [Article Influence: 48.0] [Reference Citation Analysis (0)] |
| 41. | Tang Q, Li X, Sun CR. Predictive value of serum albumin levels on cancer survival: a prospective cohort study. Front Oncol. 2024;14:1323192. [RCA] [PubMed] [DOI] [Full Text] [Cited by in RCA: 25] [Reference Citation Analysis (0)] |
| 42. | An S, Shim H, Kim K, Kim B, Bang HJ, Do H, Lee HR, Kim Y. Pretreatment inflammatory markers predicting treatment outcomes in colorectal cancer. Ann Coloproctol. 2022;38:97-108. [RCA] [PubMed] [DOI] [Full Text] [Full Text (PDF)] [Cited by in Crossref: 1] [Cited by in RCA: 25] [Article Influence: 8.3] [Reference Citation Analysis (0)] |
| 43. | Chung JW, Park DJ, Chun SY, Choi SH, Lee JN, Kim BS, Kim HT, Kim TH, Yoo ES, Byun SS, Hwang EC, Kang SH, Hong SH, Chung J, Kwak C, Kim YJ, Ha YS, Kwon TG. The prognostic role of preoperative serum albumin/globulin ratio in patients with non-metastatic renal cell carcinoma undergoing partial or radical nephrectomy. Sci Rep. 2020;10:11999. [RCA] [PubMed] [DOI] [Full Text] [Full Text (PDF)] [Cited by in Crossref: 10] [Cited by in RCA: 17] [Article Influence: 3.4] [Reference Citation Analysis (0)] |
| 44. | Sun K, Chen S, Xu J, Li G, He Y. The prognostic significance of the prognostic nutritional index in cancer: a systematic review and meta-analysis. J Cancer Res Clin Oncol. 2014;140:1537-1549. [RCA] [PubMed] [DOI] [Full Text] [Full Text (PDF)] [Cited by in Crossref: 311] [Cited by in RCA: 296] [Article Influence: 26.9] [Reference Citation Analysis (0)] |