Published online Apr 7, 2025. doi: 10.3748/wjg.v31.i13.104697
Revised: February 20, 2025
Accepted: March 11, 2025
Published online: April 7, 2025
Processing time: 94 Days and 4.4 Hours
Severe esophagogastric varices (EGVs) significantly affect prognosis of patients with hepatitis B because of the risk of life-threatening hemorrhage. Endoscopy is the gold standard for EGV detection but it is invasive, costly and carries risks. No
To construct and validate a noninvasive predictive model using ML for EGVs in hepatitis B patients.
We retrospectively collected ultrasound and serological data from 310 eligible cases, randomly dividing them into training (80%) and validation (20%) groups. Eleven ML algorithms were used to build predictive models. The performance of the models was evaluated using the area under the curve and decision curve analysis. The best-performing model was further analyzed using SHapley Additive exPlanation to interpret feature importance.
Among the 310 patients, 124 were identified as high-risk for EGVs. The extreme gradient boosting model demonstrated the best performance, achieving an area under the curve of 0.96 in the validation set. The model also exhibited high sensitivity (78%), specificity (94%), positive predictive value (84%), negative predictive value (88%), F1 score (83%), and overall accuracy (86%). The top four predictive variables were albumin, prothrombin time, portal vein flow velocity and spleen stiffness. A web-based version of the model was developed for clinical use, providing real-time predictions for high-risk patients.
We identified an efficient noninvasive predictive model using extreme gradient boosting for EGVs among hepatitis B patients. The model, presented as a web application, has potential for screening high-risk EGV patients and can aid clinicians in optimizing the use of endoscopy.
Core Tip: We constructed a noninvasive predictive model using machine learning for esophagogastric varices in hepatitis B patients. An extreme gradient boosting model, based on ultrasound and serological markers, achieved high accuracy (area under the curve = 0.96) in predicting high-risk esophagogastric varices. Key predictive variables included albumin, prothrombin time, portal vein flow velocity and spleen stiffness. A web-based application was developed to facilitate clinical use, offering real-time risk assessment. This model provides a promising tool for targeted screening, potentially reducing the need for costly and risky endoscopic procedures in low-risk individuals.
- Citation: Feng SY, Ding ZR, Cheng J, Tu HB. Noninvasive prediction of esophagogastric varices in hepatitis B: An extreme gradient boosting model based on ultrasound and serology. World J Gastroenterol 2025; 31(13): 104697
- URL: https://www.wjgnet.com/1007-9327/full/v31/i13/104697.htm
- DOI: https://dx.doi.org/10.3748/wjg.v31.i13.104697
Hepatitis B virus infection affects around 296 million individuals globally[1]. Hsu et al[2] projected a 39% increase in the global annual mortality from hepatitis B between 2015 and 2030. One of the severe complications associated with chronic hepatitis B is the development of esophagogastric varices (EGVs)[3]. These dilated submucosal veins in the esophagus and stomach are a major cause of morbidity and mortality due to the risk of life-threatening hemorrhage[3]. The gold standard for detecting EGVs is endoscopy, which, despite its high sensitivity and specificity, comes with several draw
Machine learning (ML) has emerged as a particularly powerful tool for analyzing complex multidimensional data such as the combination of ultrasound imaging and serological markers. Traditional statistical methods, such as logistic regression, often struggle when dealing with large, complex datasets where interactions between variables are not linear or straightforward. ML algorithms, however, excel at capturing intricate patterns and relationships within data, making them more suitable for identifying subtle, nonlinear associations between clinical variables[9,10]. Unlike traditional methods, which typically rely on predefined relationships, ML models can autonomously uncover new insights from data and are better at handling multicollinearity and other forms of variable interdependence[11,12]. For example, in the context of predicting EGVs, ML can evaluate multiple input factors simultaneously, such as spleen stiffness, pv flow velocity and serological markers, without requiring the simplification or assumptions that traditional methods impose. ML algorithms such as extreme gradient boosting (XGBoost) and random forest (RF) can provide feature importance rankings, aiding in the interpretability of the model by identifying the most critical predictors of outcomes. This makes it possible to build more accurate and clinically applicable models. The use of ML in this study was therefore critical, as it enabled the processing of large amounts of data while improving the precision of predictions over traditional statistical methods.
This study retrospectively analyzed data from 310 hepatitis B patients who underwent endoscopy, including their ultrasound and serological parameters. The aim was to construct a high-accuracy noninvasive predictive model for EGVs by comparing the performance of 11 ML algorithms. By leveraging the strengths of ML, this study aimed to contribute to clinical practice by providing an effective tool for the targeted screening of high-risk patients.
This was a retrospective, observational analysis aimed at developing and validating a noninvasive predictive model for EGVs in patients with hepatitis B. By utilizing historical patient data, we aimed to leverage ML techniques to identify high-risk individuals who would benefit from endoscopic screening. The study was conducted at Mengchao Hepatobiliary Hospital. The data were collected from January 2016 to December 2023.
This study was performed in accordance with the ethical standards of the institutional and national research commi
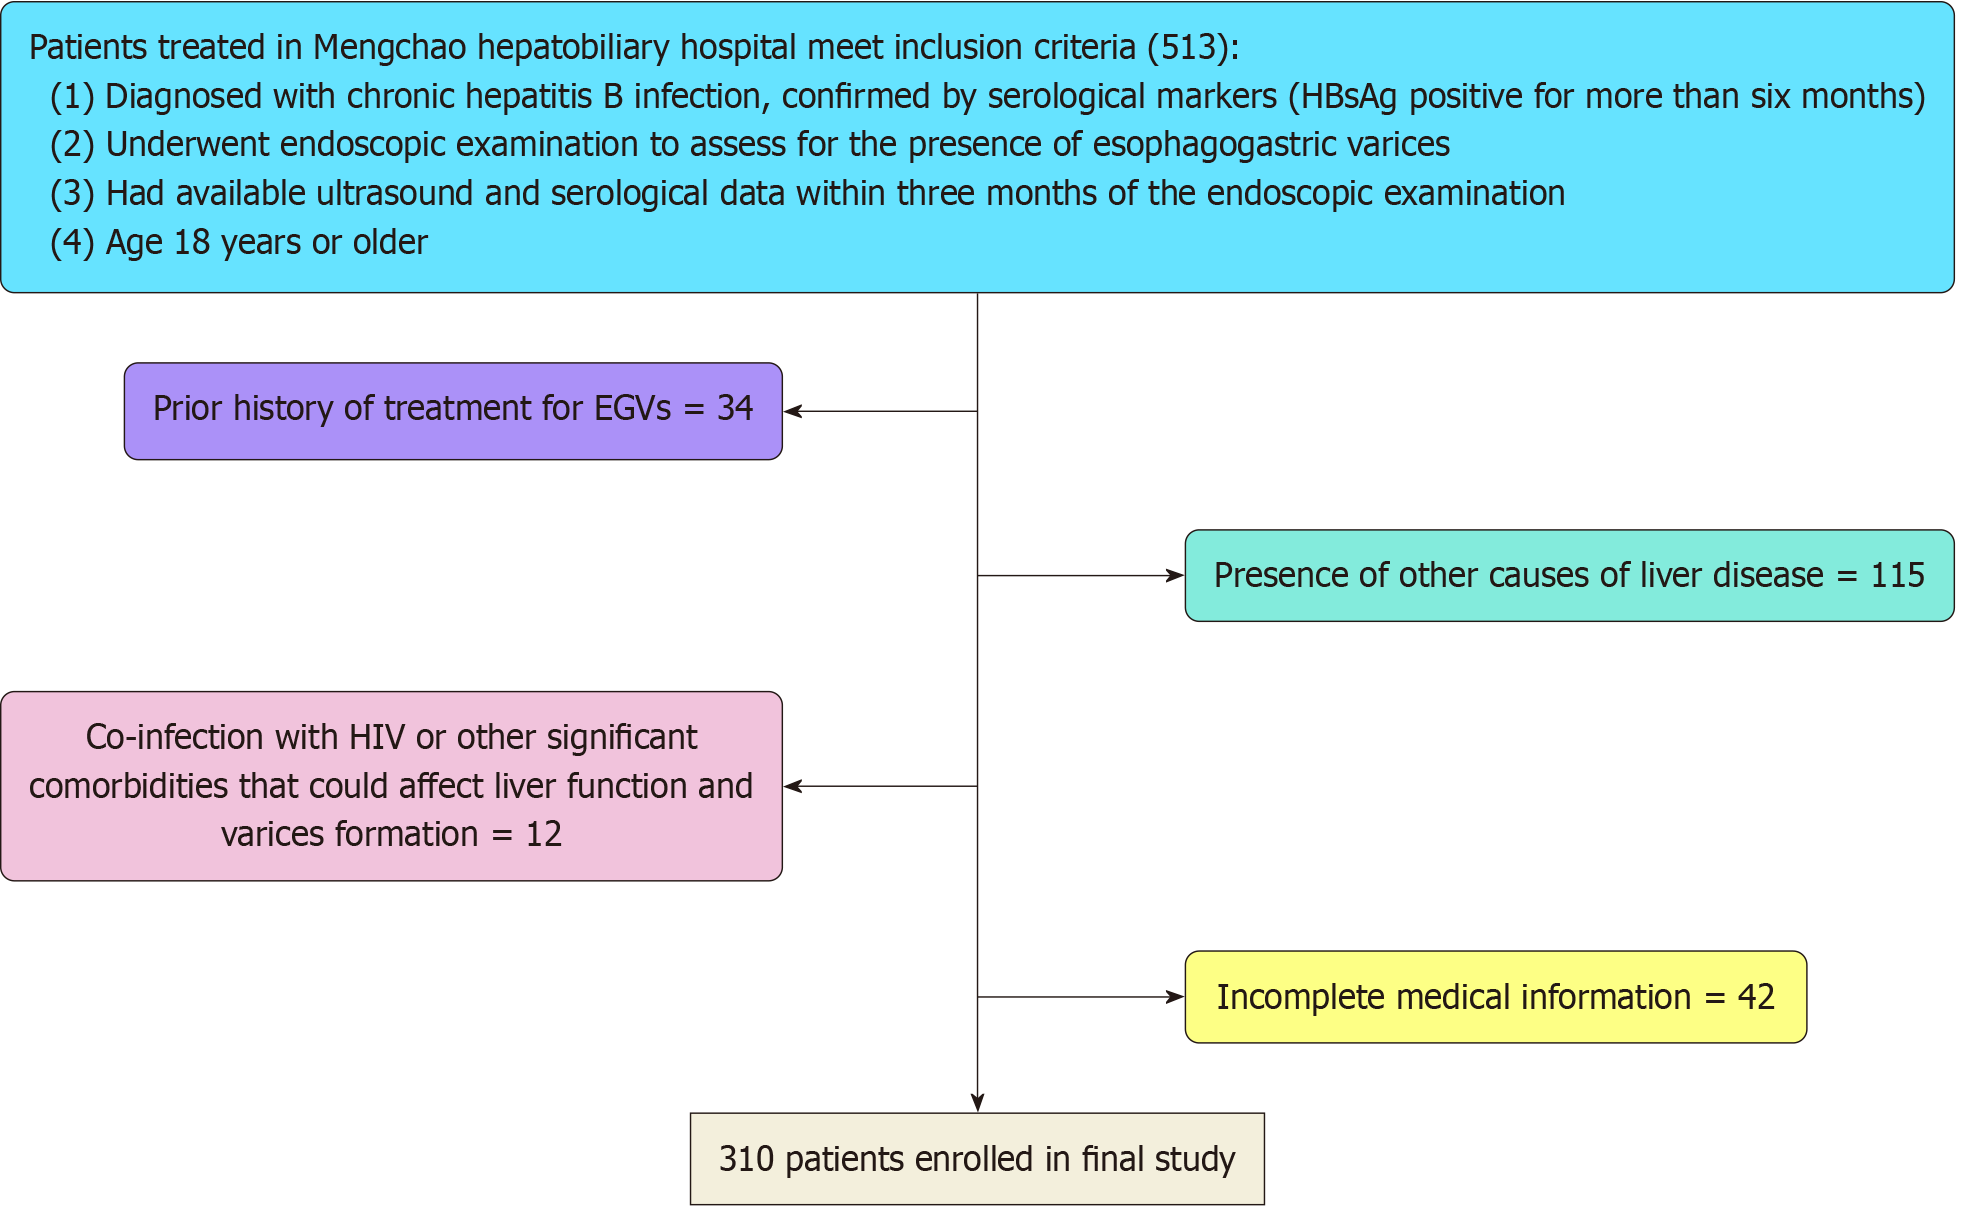
Inclusion criteria were as follows (Figure 1): (1) Diagnosis of chronic hepatitis B, confirmed by serological markers (hepatitis B surface antigen positive for > 6 months); (2) Endoscopic examination to assess the presence of EGVs; (3) Ultrasound and serological data within 3 months of the endoscopic examination; and (4) Age ≥ 18 years. Exclusion criteria were: (1) Other causes of liver disease (e.g., hepatitis C, alcoholic liver disease, or autoimmune hepatitis); (2) Prior history of treatment for EGVs (e.g., banding or sclerotherapy); (3) Incomplete medical records or missing key data points required for the analysis; and (4) Co-infection with human immunodeficiency virus or other significant comorbidities that could affect liver function and varices formation.
The data were obtained from the electronic medical records of patients treated at Mengchao Hepatobiliary Hospital, such as patient demographics (age and gender); medical history (duration of hepatitis B or previous liver-related complications); and clinical signs and symptoms (jaundice, ascites or hepatic encephalopathy).
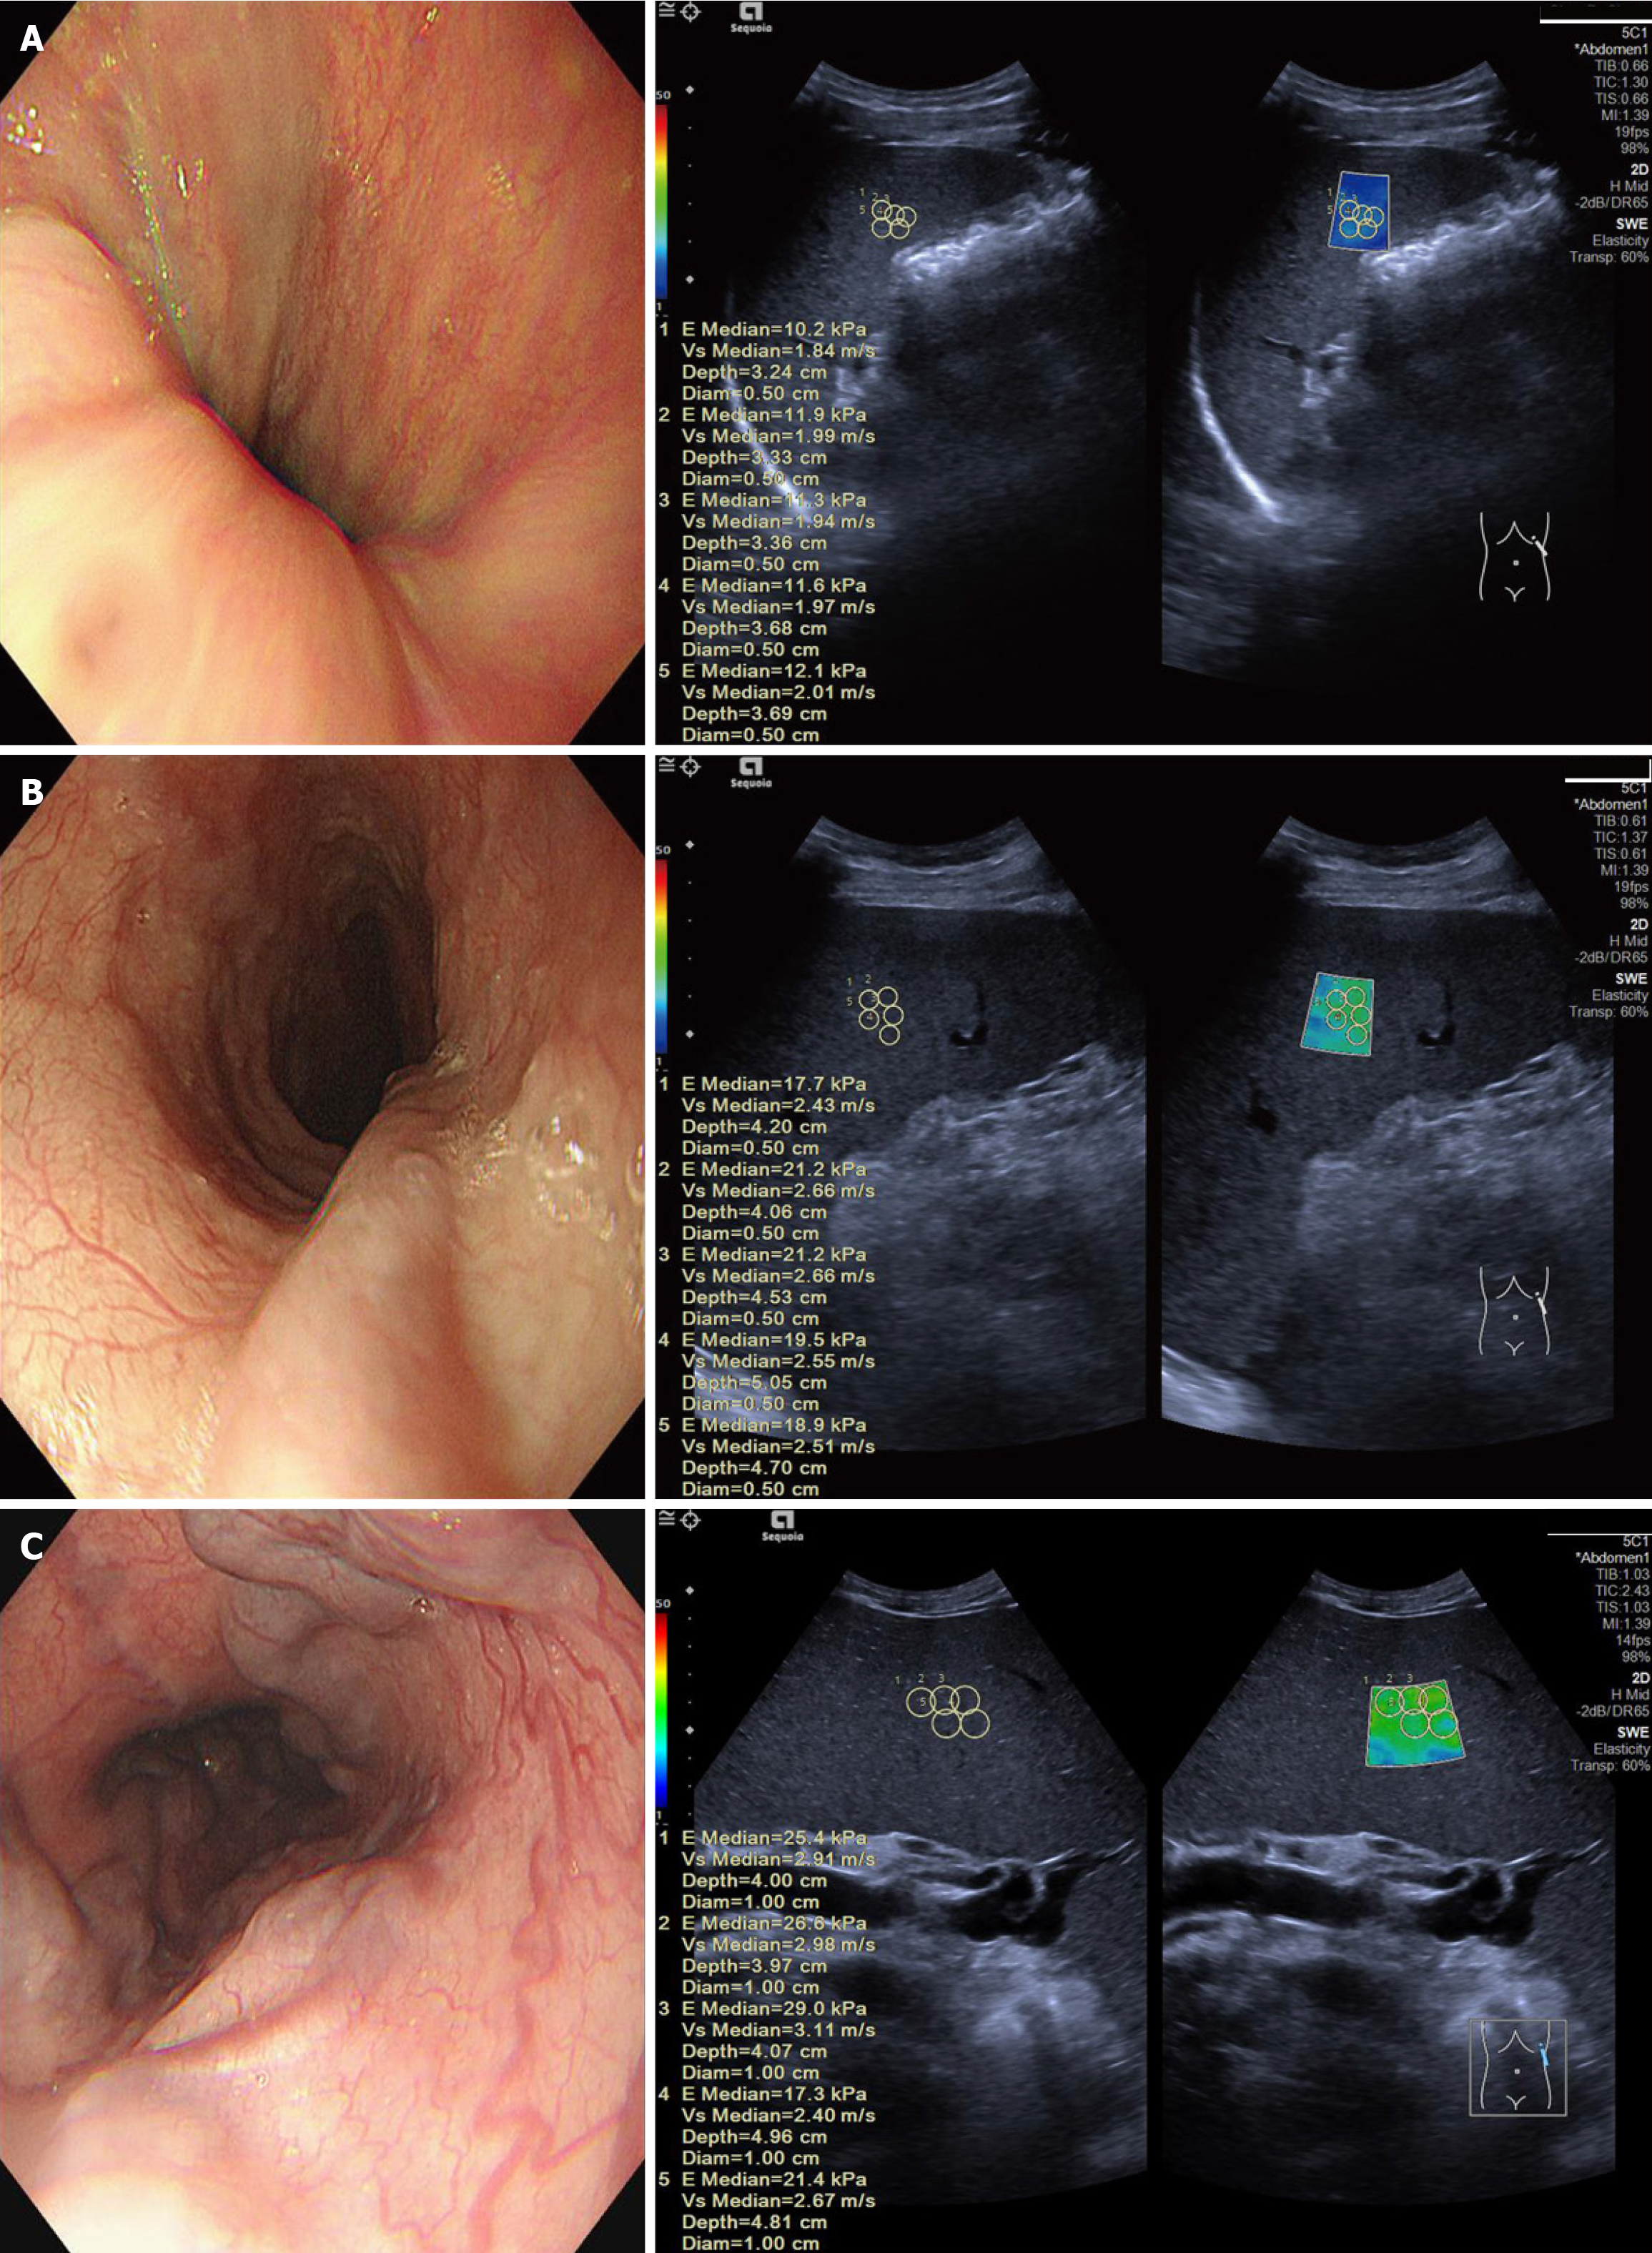
Ultrasound examinations were performed using high-resolution ultrasound machines (Siemens Sequia, 5C-1). The key parameters measured included liver and spleen stiffness (using 2D shear wave elastography to assess tissue stiffness) (Figure 2). Pv flow velocity was measured using Doppler ultrasound. Spleen long diameter and thickness were measured in the coronal plane, and the presence of collateral branches and ascites was assessed using B-mode ultrasound. To ensure optimal imaging quality, all patients fasted for at least 8 hours prior to the examination. Patients were positioned either supine or in the left lateral decubitus position, depending on the parameter being measured.
Liver and spleen stiffness were measured with minimal probe pressure to avoid artifacts. Specifically, measurements were taken from all eight segments of the liver, with five regions of interest in each segment. The stiffness values from these five regions of interest in each segment were averaged to obtain the final measurement for that segment. This method ensured a comprehensive and consistent assessment of liver stiffness across all regions. Pv flow velocity was measured: The sample box was adjusted to 3 mm and placed at the pv 1 cm from the hepatic hilum. By adjusting the pa
Blood samples were collected within 1 week of the endoscopic examination, typically after an 8-hour fast, drawn in the morning to reduce diurnal variability, and processed within 2 hour to ensure accuracy. The following parameters were recorded: Prothrombin time, alanine aminotransferase, aspartate aminotransferase, albumin, total bilirubin, direct bilirubin, indirect bilirubin, creatinine, alkaline phosphatase, red blood cell count, white blood cell count, and international normalized ratio for blood coagulation.
Endoscopic evaluation was performed using standard esophagogastroduodenoscopy procedures, which allowed direct visualization of the esophagus, stomach and upper small intestine using a flexible endoscope with a camera and light source. Patients fasted for > 8 hours before the procedure for better visualization, and pre-procedural assessments were conducted to identify any risks. Moderate sedation with drugs such as midazolam and fentanyl were administered, and vital signs were continuously monitored. The endoscope was gently inserted through the mouth to inspect the mucosal lining of the esophagus, stomach and duodenum for varices, erosions, ulcers and other abnormalities, focusing on grading the varices by size and location. Severe EGVs, named high-risk EGVs, were diagnosed based on size (grade 2: 5-10 mm, grade 3: > 10 mm) and the presence of red signs or bleeding indicators. The procedure was performed by experienced gastroenterologists, assisted by endoscopy technicians and specialized nursing staff, who provided patient care, handled equipment, and ensured all instruments were available and properly disinfected. The findings were documented by the gastroenterologists, who also made clinical decisions based on the observations. The different grades of EGVs are shown in Figure 2.
We used a comprehensive suite of ML algorithms to construct and validate the predictive model for EGVs in hepatitis B patients. The following algorithms were utilized: RF, adaptive boosting, artificial neural network, decision tree, extra trees, gradient boosting machine, k-nearest neighbors, light gradient boosting machine, logistic regression, support vector machine, and XGBoost. Prior to model training, essential feature engineering techniques were applied to the dataset. Continuous variables were normalized to ensure uniformity, and Min-Max scaling was performed to adjust the range of features between 0 and 1. Missing data were handled through multiple imputation by chained equations for continuous variables. For categorical variables, imputation was performed using the most frequent category (mode) or logistic regression imputation, depending on the nature of the variable. This ensured a complete and consistent dataset for model training and validation.
Interpreting ML models can be challenging because of their inherent complexity. In our study, we utilized SHapley Additive exPlanation (SHAP) to address this “black box” issue by ranking the importance of input features and ex
The top five models based on AUC were further analyzed using bee swarm plots. Considering both ROC and DCA results, XGBoost was selected as the final model for our study. Dependency plots, overall force plots and decision plots were generated to illustrate the influence of various factors on the predictions of the model.
SHAP values assisted in feature selection by identifying the most critical predictors. This process reduced the number of features from the initial set to the top four most important, which were used to construct a web-based calculator (https://pectgew2rqefrdqyjgqcrh.streamlit.app/). By inputting specific values, clinicians can determine a patient's risk of severe EGVs. This tool enhanced the practical application of our model in clinical settings, providing a user-friendly interface for healthcare providers. The SHAP method provided both global and local explanations for the model. Global explanations offered consistent attribution values for each feature, showing their associations with the risk of severe EGVs, while local explanations demonstrated specific predictions for individual patients based on their data. This approach ensured that our predictive model was accurate and interpretable and reliable for clinical use.
The statistical analysis and ML model development were conducted using several robust analytical tools, including Python with libraries such as Scikit-learn, Pandas, NumPy and Matplotlib, as well as R for DCA. Descriptive statistics, including mean ± SD, were calculated for continuous variables to summarize central tendencies and variability, while frequency distributions and percentages described categorical variables.
Inferential statistical methods were applied to compare the two groups (patients with and without severe EGVs). t-tests were used to compare the means of continuous variables, χ2 tests assessed associations between categorical variables, and Mann-Whitney U tests were used for nonparametric comparisons when the data did not follow a normal distribution. Pearson and Spearman correlation coefficients were calculated to examine relationships between continuous variables and identify potential collinearities. The performance of the ML models was evaluated using several key metrics to assess their accuracy and clinical utility. AUC measured the ability of the model to distinguish between patients with and without severe EGVs, sensitivity (recall) measured the proportion of actual positive cases correctly identified, and specificity measured the proportion of actual negative cases correctly identified. Positive predictive value and negative predictive value indicated the proportions of true positives and true negatives, respectively. The F1 score, the harmonic mean of precision and recall, balanced false positives and false negatives, while accuracy measured the proportion of correctly classified instances.
To ensure robustness, five-fold cross-validation was used. The training set was divided into five subsets, with the model trained on four subsets and validated on the remaining one. This process was repeated five times, with each subset used once as the validation data. Stratified cross-validation maintained the proportion of severe EGV cases in each fold, preserving the original class distribution of the dataset. This combination of statistical methods and model evaluation techniques provided a comprehensive analysis, ensuring the development of a robust and accurate predictive model for EGVs in hepatitis B patients.
The general characteristics of all patients are shown in Table 1. A total of 310 patients were included in the study, with a mean age of 53.4 ± 12.3 years. Among them, 124 patients were identified as high risk for EGV. The training cohort included 248 patients, with 99 identified as high risk. The validation cohort included 62 patients, with 25 identified as high risk. The baseline characteristics of the training cohort and the validation cohort were matched and comparable.
| Index | Total | Train set | Test set | P value |
| Liver stiffness | 13.2 ± 5.0 | 13.2 ± 5.3 | 12.9 ± 4.0 | 0.91 |
| Spv speed | 35.3 ± 9.1 | 35.5 ± 9.3 | 34.5 ± 8.6 | 0.4 |
| Platelet count | 132.9 ± 63.8 | 131.3 ± 64.7 | 139.4 ± 60.2 | 0.23 |
| Model for end-stage liver disease | 30.2 ± 1.9 | 30.3 ± 1.8 | 29.9 ± 2.1 | 0.044 |
| Creatinine | 75.5 ± 27.1 | 76.2 ± 29.6 | 72.5 ± 12.9 | 0.74 |
| Alanine aminotransferase | 38.0 ± 39.0 | 36.4 ± 34.6 | 44.5 ± 52.8 | 0.046 |
| Aspartate aminotransferase | 47.8 ± 62.1 | 44.7 ± 53.3 | 60.2 ± 88.4 | 0.057 |
| Total bilirubin | 30.5 ± 34.5 | 30.7 ± 34.2 | 29.6 ± 36.0 | 0.43 |
| Direct bilirubin | 16.2 ± 27.8 | 16.4 ± 27.6 | 15.5 ± 29.0 | 0.48 |
| Indirect bilirubin | 14.2 ± 9.8 | 14.3 ± 8.9 | 14.0 ± 13.0 | 0.27 |
| Alkaline phosphatase | 108.8 ± 55.9 | 105.2 ± 53.1 | 123.0 ± 64.4 | 0.027 |
| Red blood cell count | 4.3 ± 0.8 | 4.3 ± 0.8 | 4.4 ± 0.7 | 0.35 |
| White blood cell count | 5.3 ± 1.9 | 5.3 ± 1.9 | 5.3 ± 1.6 | 0.64 |
| Age | 53.4 ± 12.3 | 53.6 ± 12.4 | 52.5 ± 11.8 | 0.57 |
| Spleen stiffness | 15.1 ± 4.8 | 15.2 ± 4.9 | 14.8 ± 4.7 | 0.83 |
| pv | 1.2 ± 0.2 | 1.2 ± 0.2 | 1.2 ± 0.2 | 0.59 |
| pvspeed | 27.5 ± 6.7 | 27.2 ± 6.6 | 28.5 ± 7.2 | 0.14 |
| splong | 13.3 ± 2.6 | 13.3 ± 2.5 | 13.4 ± 2.7 | 0.88 |
| spwide | 4.6 ± 1.0 | 4.7 ± 0.9 | 4.6 ± 1.0 | 0.34 |
| spv | 0.8 ± 0.2 | 0.8 ± 0.2 | 0.9 ± 0.2 | 0.41 |
| Prothrombin time | 15.5 ± 3.2 | 15.7 ± 3.4 | 14.8 ± 2.3 | 0.045 |
| Albumin | 39.7 ± 8.9 | 40.0 ± 8.9 | 38.6 ± 8.8 | 0.4 |
| International normalized ratio | 1.2 ± 0.3 | 1.3 ± 0.3 | 1.2 ± 0.3 | 0.22 |
| Sex, n (%) | ||||
| Female | 84 (27.1) | 67 (27.0) | 17 (27.4) | 1 |
| Male | 226 (72.9) | 181 (73.0) | 45 (72.6) | - |
| Child-Pugh class, n (%) | ||||
| 1 | 168 (54.2) | 131 (52.8) | 37 (59.7) | 0.29 |
| 2 | 119 (38.4) | 100 (40.3) | 19 (30.6) | - |
| 3 | 23 (7.4) | 17 (6.9) | 6 (9.7) | - |
| Collateral, n (%) | ||||
| No | 244 (78.7) | 196 (79.0) | 48 (77.4) | 0.86 |
| Yes | 66 (21.3) | 52 (21.0) | 14 (22.6) | - |
| Severe EGV, n (%) | ||||
| No | 186 (60.0) | 149 (60.1) | 37 (59.7) | 1 |
| Yes | 124 (40.0) | 99 (39.9) | 25 (40.3) | - |
The results of the modeling cohort are shown in Table 2. There were 99 patients in the high-risk group. The following factors showed significant differences between the high- and low-risk groups: Sex, portal vein speed (pvspeed), platelet count, creatinine, total bilirubin, direct bilirubin, indirect bilirubin, spleen stiffness, pvspeed, spleen width (spwide), splenic vein (spv), albumin, prothrombin time and Child-Pugh score. Through collinearity analysis, and included potentially significant predictors for high-risk prediction in subsequent analyses. These included: Age, spleen stiffness, pv, pvspeed, spleen length, spv, prothrombin time, albumin, Child-Pugh score, sex, presence of collateral vessels (colla
| Index | Total | Low risk | High risk | P value |
| Liver stiffness | 13.2 ± 5.3 | 13.2 ± 5.9 | 13.3 ± 4.2 | 0.33 |
| Spv speed | 35.5 ± 9.3 | 36.4 ± 9.2 | 34.1 ± 9.3 | 0.026 |
| Platelet count | 131.3 ± 64.7 | 128.0 ± 73.2 | 136.1 ± 49.2 | 0.048 |
| Model for end-stage liver disease | 30.3 ± 1.8 | 30.5 ± 2.0 | 30.0 ± 1.5 | 0.25 |
| Creatinine | 76.2 ± 29.6 | 76.9 ± 36.8 | 75.2 ± 12.8 | 0.018 |
| Alanine aminotransferase | 36.4 ± 34.6 | 40.0 ± 42.8 | 30.8 ± 14.1 | 0.88 |
| Aspartate aminotransferase | 44.7 ± 53.3 | 43.8 ± 49.7 | 46.1 ± 58.5 | 0.25 |
| Total bilirubin | 30.7 ± 34.2 | 28.3 ± 37.1 | 34.3 ± 29.2 | < 0.001 |
| Direct bilirubin | 16.4 ± 27.6 | 14.5 ± 29.4 | 19.1 ± 24.5 | < 0.001 |
| Indirect bilirubin | 14.3 ± 8.9 | 13.8 ± 9.8 | 14.9 ± 7.4 | 0.042 |
| Alkaline phosphatase | 105.2 ± 53.1 | 101.3 ± 50.0 | 111.1 ± 57.3 | 0.37 |
| Red blood cell count | 4.3 ± 0.8 | 4.3 ± 0.9 | 4.2 ± 0.7 | 0.82 |
| White blood cell count | 5.3 ± 1.9 | 5.4 ± 2.1 | 5.3 ± 1.7 | 0.67 |
| Age | 53.6 ± 12.4 | 52.3 ± 13.7 | 55.6 ± 10.0 | 0.025 |
| Spleen stiffness | 15.2 ± 4.9 | 13.7 ± 4.5 | 17.3 ± 4.7 | < 0.001 |
| pv | 1.2 ± 0.2 | 1.3 ± 0.2 | 1.2 ± 0.1 | 0.16 |
| pvspeed | 27.2 ± 6.6 | 28.0 ± 6.8 | 26.0 ± 6.1 | 0.03 |
| splong | 13.3 ± 2.5 | 13.6 ± 2.8 | 12.9 ± 2.0 | 0.11 |
| spwide | 4.7 ± 0.9 | 4.5 ± 0.9 | 4.8 ± 0.9 | 0.012 |
| spv | 0.8 ± 0.2 | 0.9 ± 0.2 | 0.8 ± 0.2 | 0.016 |
| Prothrombin time | 15.7 ± 3.4 | 15.5 ± 3.2 | 17.8 ± 3.6 | 0.032 |
| Albumin | 40.0 ± 8.9 | 40.7 ± 8.9 | 25.13 ± 6.5 | 0.015 |
| International normalized ratio | 1.3 ± 0.3 | 1.2 ± 0.3 | 1.3 ± 0.4 | 0.25 |
| Sex, n (%) | ||||
| Female | 67 (27.0) | 26 (17.4) | 41 (41.4) | < 0.001 |
| Male | 181 (73.0) | 123 (82.6) | 58 (58.6) | - |
| Child–Pugh class, n (%) | ||||
| 1 | 131 (52.8) | 71 (47.7) | 60 (60.6) | 0.025 |
| 2 | 100 (40.3) | 70 (47.0) | 30 (30.3) | - |
| 3 | 17 (6.9) | 8 (5.4) | 9 (9.1) | - |
| Collateral, n (%) | ||||
| No | 196 (79.0) | 120 (80.5) | 76 (76.8) | 0.53 |
| Yes | 52 (21.0) | 29 (19.5) | 23 (23.2) | - |
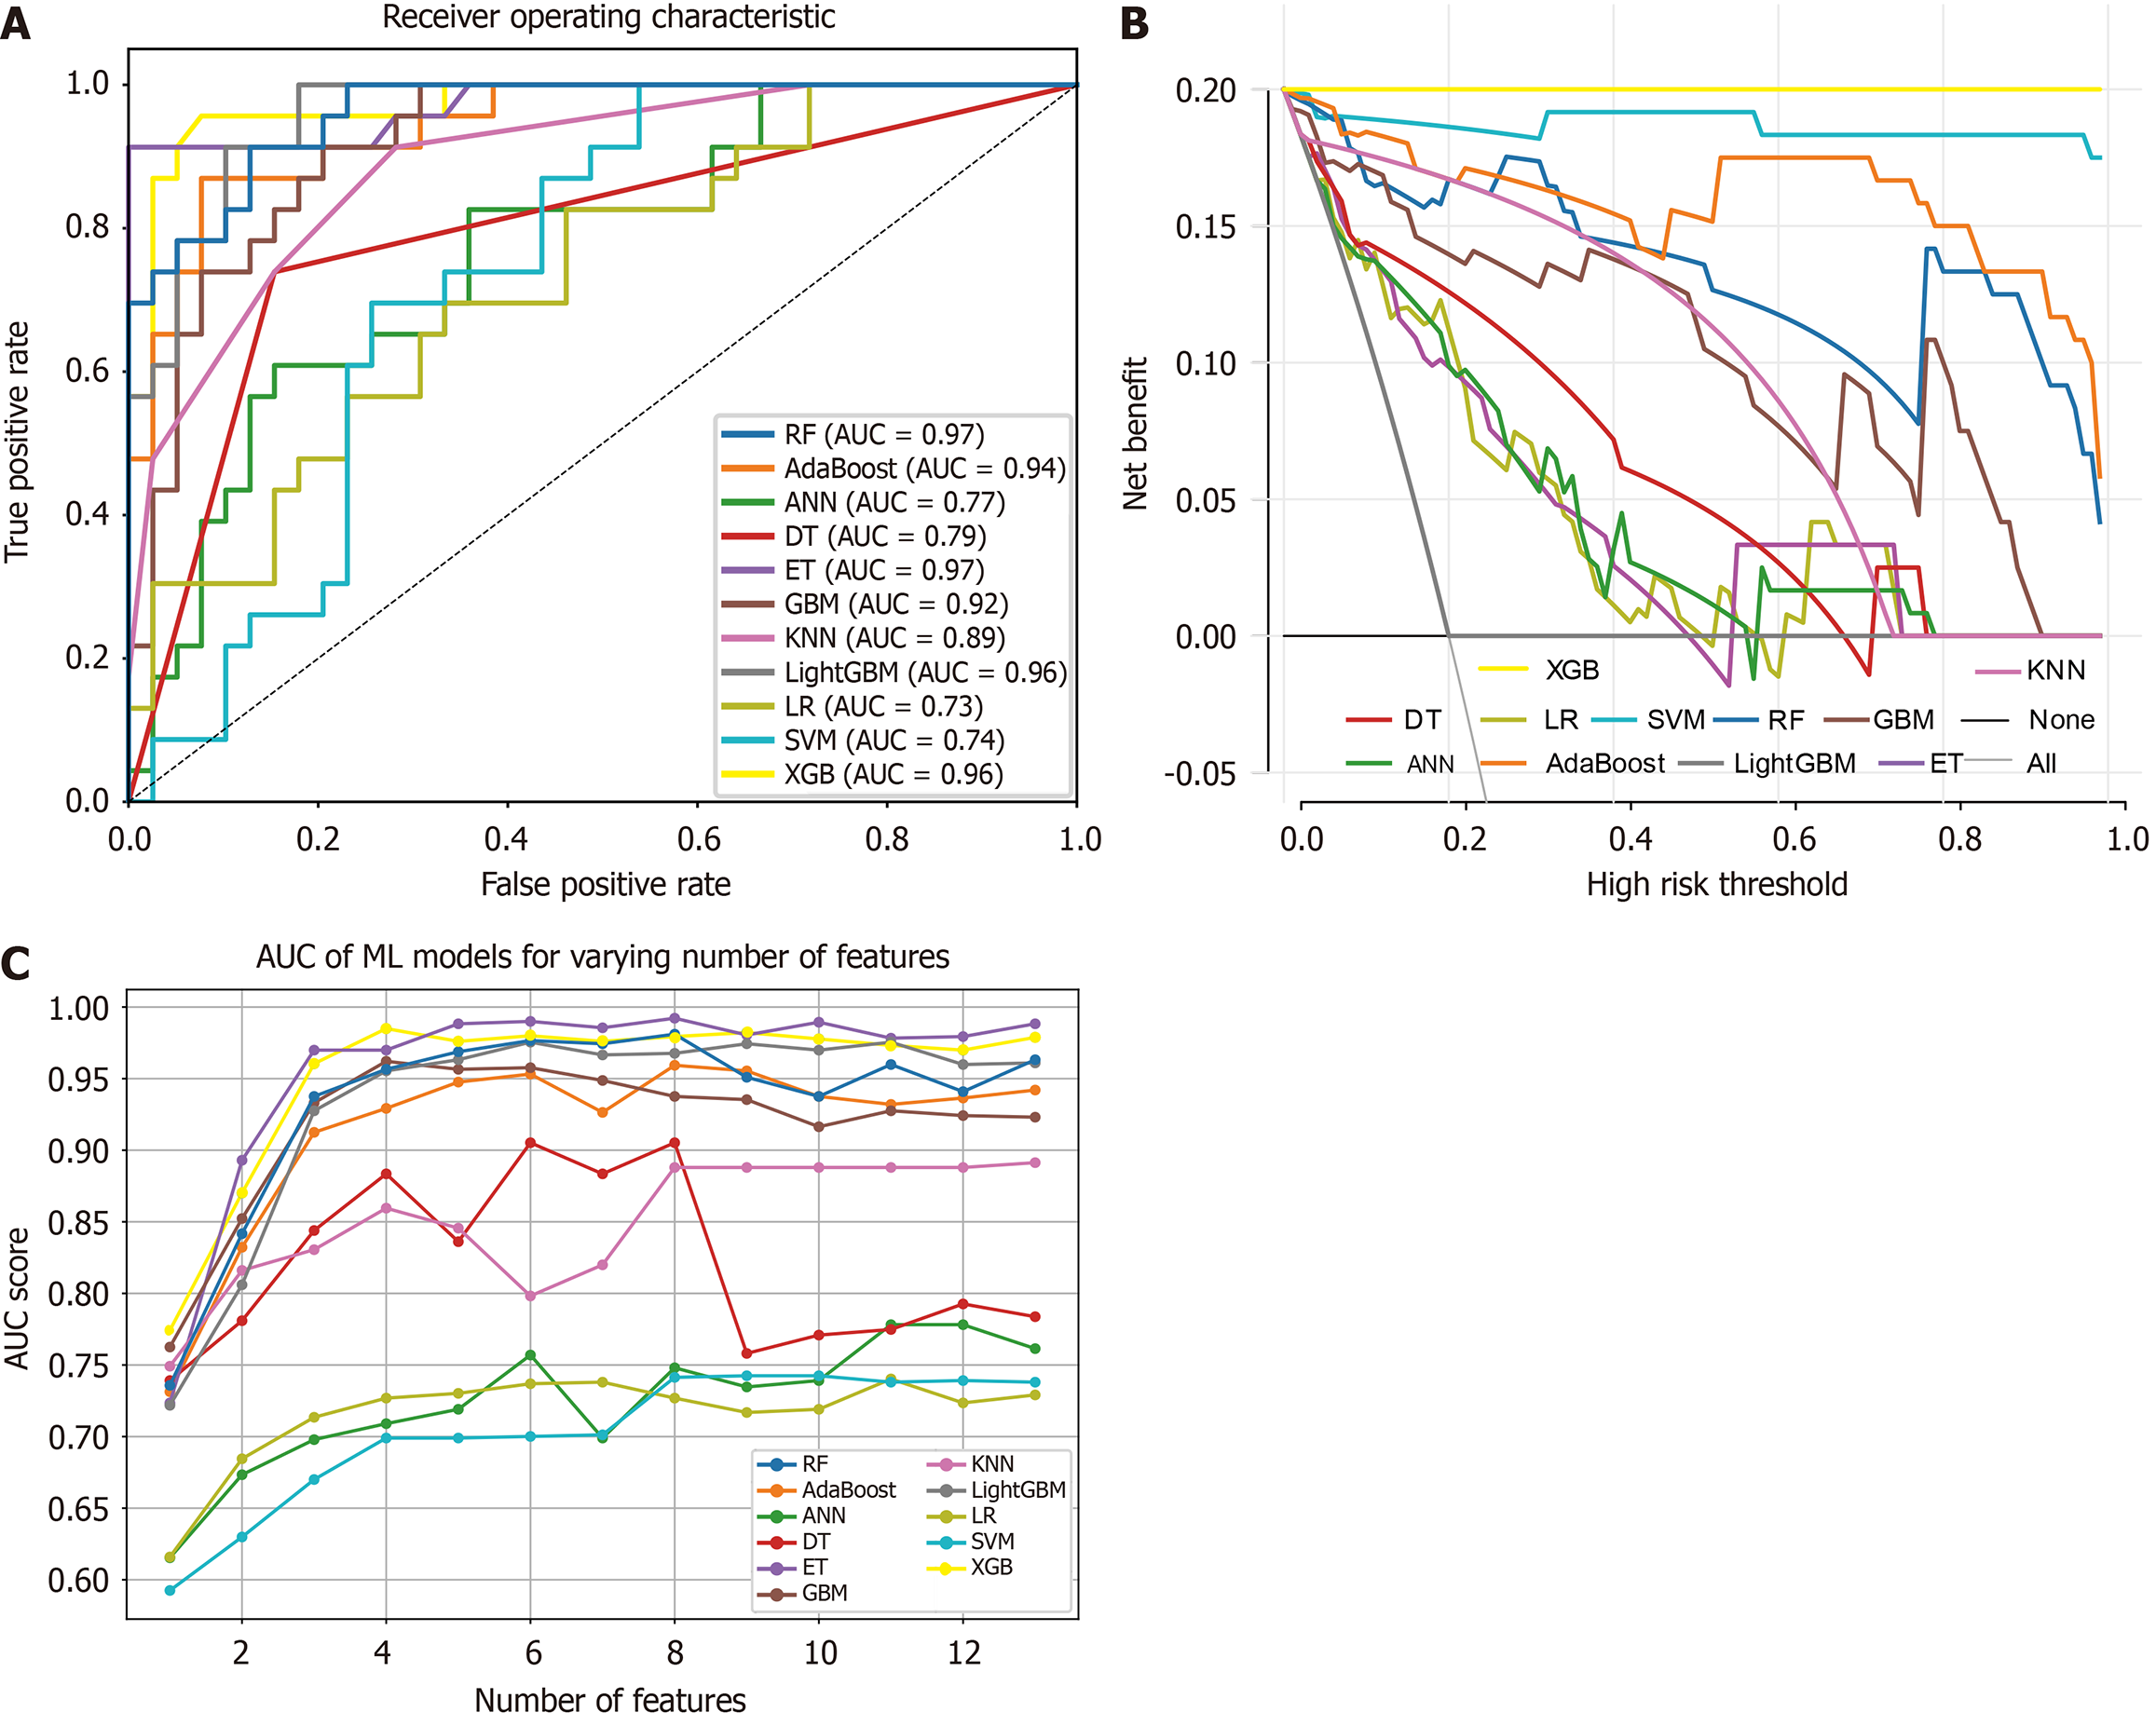
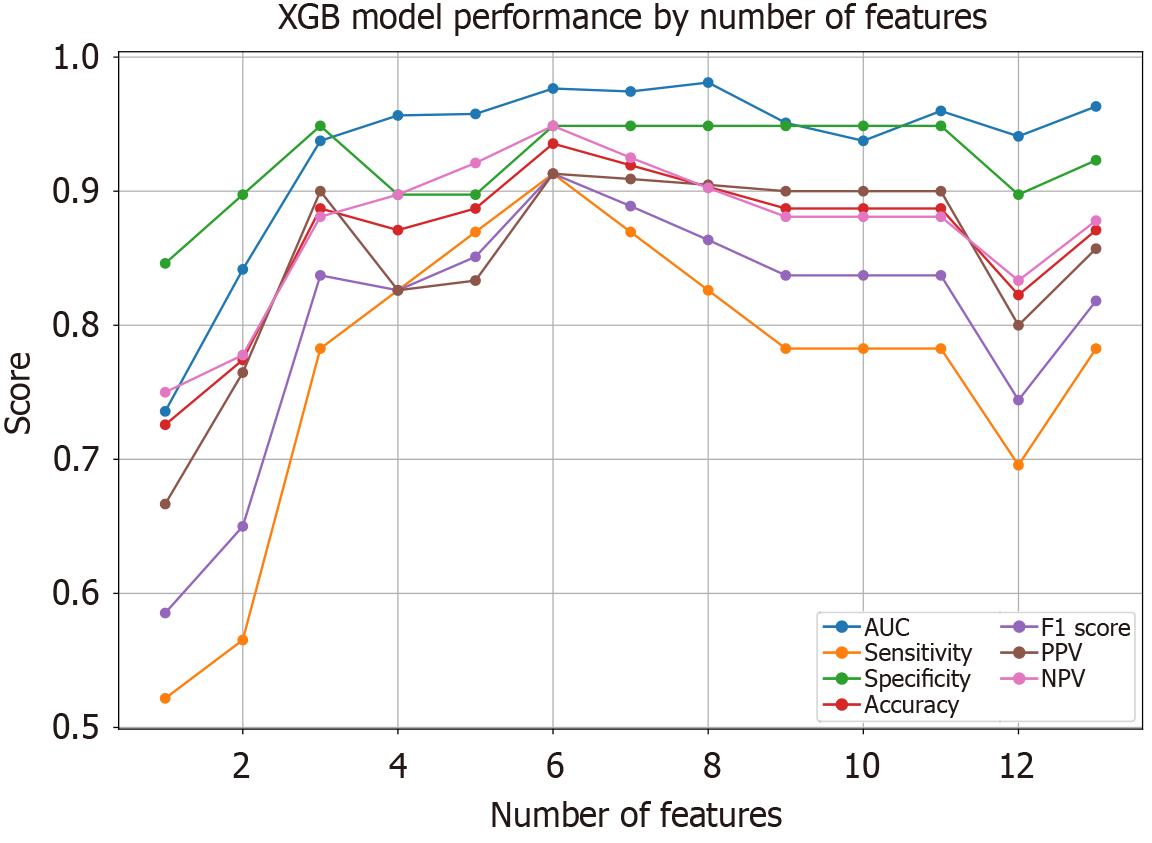
We used 11 ML methods for model construction and validation. Initially, we included all 13 selected factors and plotted the ROC curve DCA curves for all models in the validation cohort (Figure 3A and B). These models had the largest AUC: Extra tree (0.97), RF (0.97), XGBoost (0.96), light gradient boosting machine (0.96) and adaptive boosting (0.94). Sensitivity, specificity and other metrics for all models were calculated and presented in Table 3. To explore the impact of different numbers of variables on the overall AUC, we used recursive feature elimination to evaluate and rank feature importance. We analyzed how the AUC varied with different numbers of features for each model and plotted the corresponding AUCs (Figure 3C). Through comparison, we found that incorporating the top four ranked variables was sufficient for the model to achieve a high AUC. Based on a comprehensive consideration of AUC and DCA, XGBoost was selected as the primary model for further study.
| Model name | Area under curve | Accuracy | Precision | Recall | Specificity | F1 score | Positive predict value | Positive predict value |
| Random forest | 0.97 (0.94-1.00) | 0.93 (0.87-0.98) | 0.92 (0.85-1.00) | 0.87 (0.72-1.00) | 0.95 (0.92-1.00) | 0.88 (0.80-0.98) | 0.92 (0.85-1.00) | 0.91 (0.84-1.00) |
| AdaBoost | 0.94 (0.88-0.99) | 0.84 (0.76-0.94) | 0.85 (0.69-1.00) | 0.71 (0.53-0.90) | 0.91 (0.84-1.00) | 0.76 (0.62-0.91) | 0.88 (0.69-1.00) | 0.85 (0.74-0.95) |
| Artificial neural network | 0.77 (0.61-0.85) | 0.63 (0.52-0.74) | 0.51 (0.30-0.70) | 0.49 (0.31-0.73) | 0.69 (0.55-0.83) | 0.47 (0.32-0.67) | 0.46 (0.30-0.70) | 0.73 (0.56-0.85) |
| Decision tree | 0.79 (0.67-0.89) | 0.81 (0.69-0.90) | 0.74 (0.56-0.94) | 0.69 (0.50-0.86) | 0.85 (0.75-0.97) | 0.71 (0.55-0.86) | 0.74 (0.56-0.94) | 0.84 (0.71-0.93) |
| Extra tree | 0.97 (0.95-1.00) | 0.94 (0.87-0.98) | 0.91 (0.83-1.00) | 0.85 (0.71-1.00) | 0.91 (0.91-1.00) | 0.88 (0.80-0.98) | 0.93 (0.83-1.00) | 0.92 (0.84-1.00) |
| Gradient boosting machine | 0.92 (0.84-0.98) | 0.86 (0.75-0.94) | 0.83 (0.67-1.00) | 0.72 (0.55-0.92) | 0.91 (0.83-1.00) | 0.76 (0.64-0.91) | 0.84 (0.67-1.00) | 0.84 (0.75-0.96) |
| K-nearest neighbors | 0.89 (0.80-0.96) | 0.82 (0.71-0.90) | 0.73 (0.54-0.90) | 0.72 (0.55-0.91) | 0.83 (0.72-0.95) | 0.68 (0.57-0.86) | 0.73 (0.54-0.90) | 0.85 (0.72-0.95) |
| Lightgbm | 0.96 (0.91-0.99) | 0.86 (0.79-0.95) | 0.81 (0.73-1.00) | 0.74 (0.54-0.92) | 0.94 (0.87-1.00) | 0.79 (0.65-0.92) | 0.85 (0.74-1.00) | 0.86 (0.76-0.95) |
| Logistic regression | 0.73 (0.60-0.85) | 0.67 (0.55-0.77) | 0.54 (0.33-0.74) | 0.61 (0.41-0.82) | 0.68 (0.53-0.83) | 0.58 (0.38-0.73) | 0.58 (0.33-0.74) | 0.76 (0.61-0.89) |
| Support vector machine | 0.74 (0.62-0.86) | 0.61 (0.50-0.73) | 0.47 (0.23-0.72) | 0.34 (0.15-0.56) | 0.77 (0.64-0.90) | 0.39 (0.19-0.58) | 0.47 (0.23-0.72) | 0.63 (0.52-0.80) |
| Extreme gradient boosting | 0.96 (0.92-0.99) | 0.86 (0.81-0.97) | 0.87 (0.74-1.00) | 0.78 (0.62-0.95) | 0.94 (0.86-1.00) | 0.83 (0.70-0.94) | 0.84 (0.74-1.00) | 0.88 (0.78-0.98) |
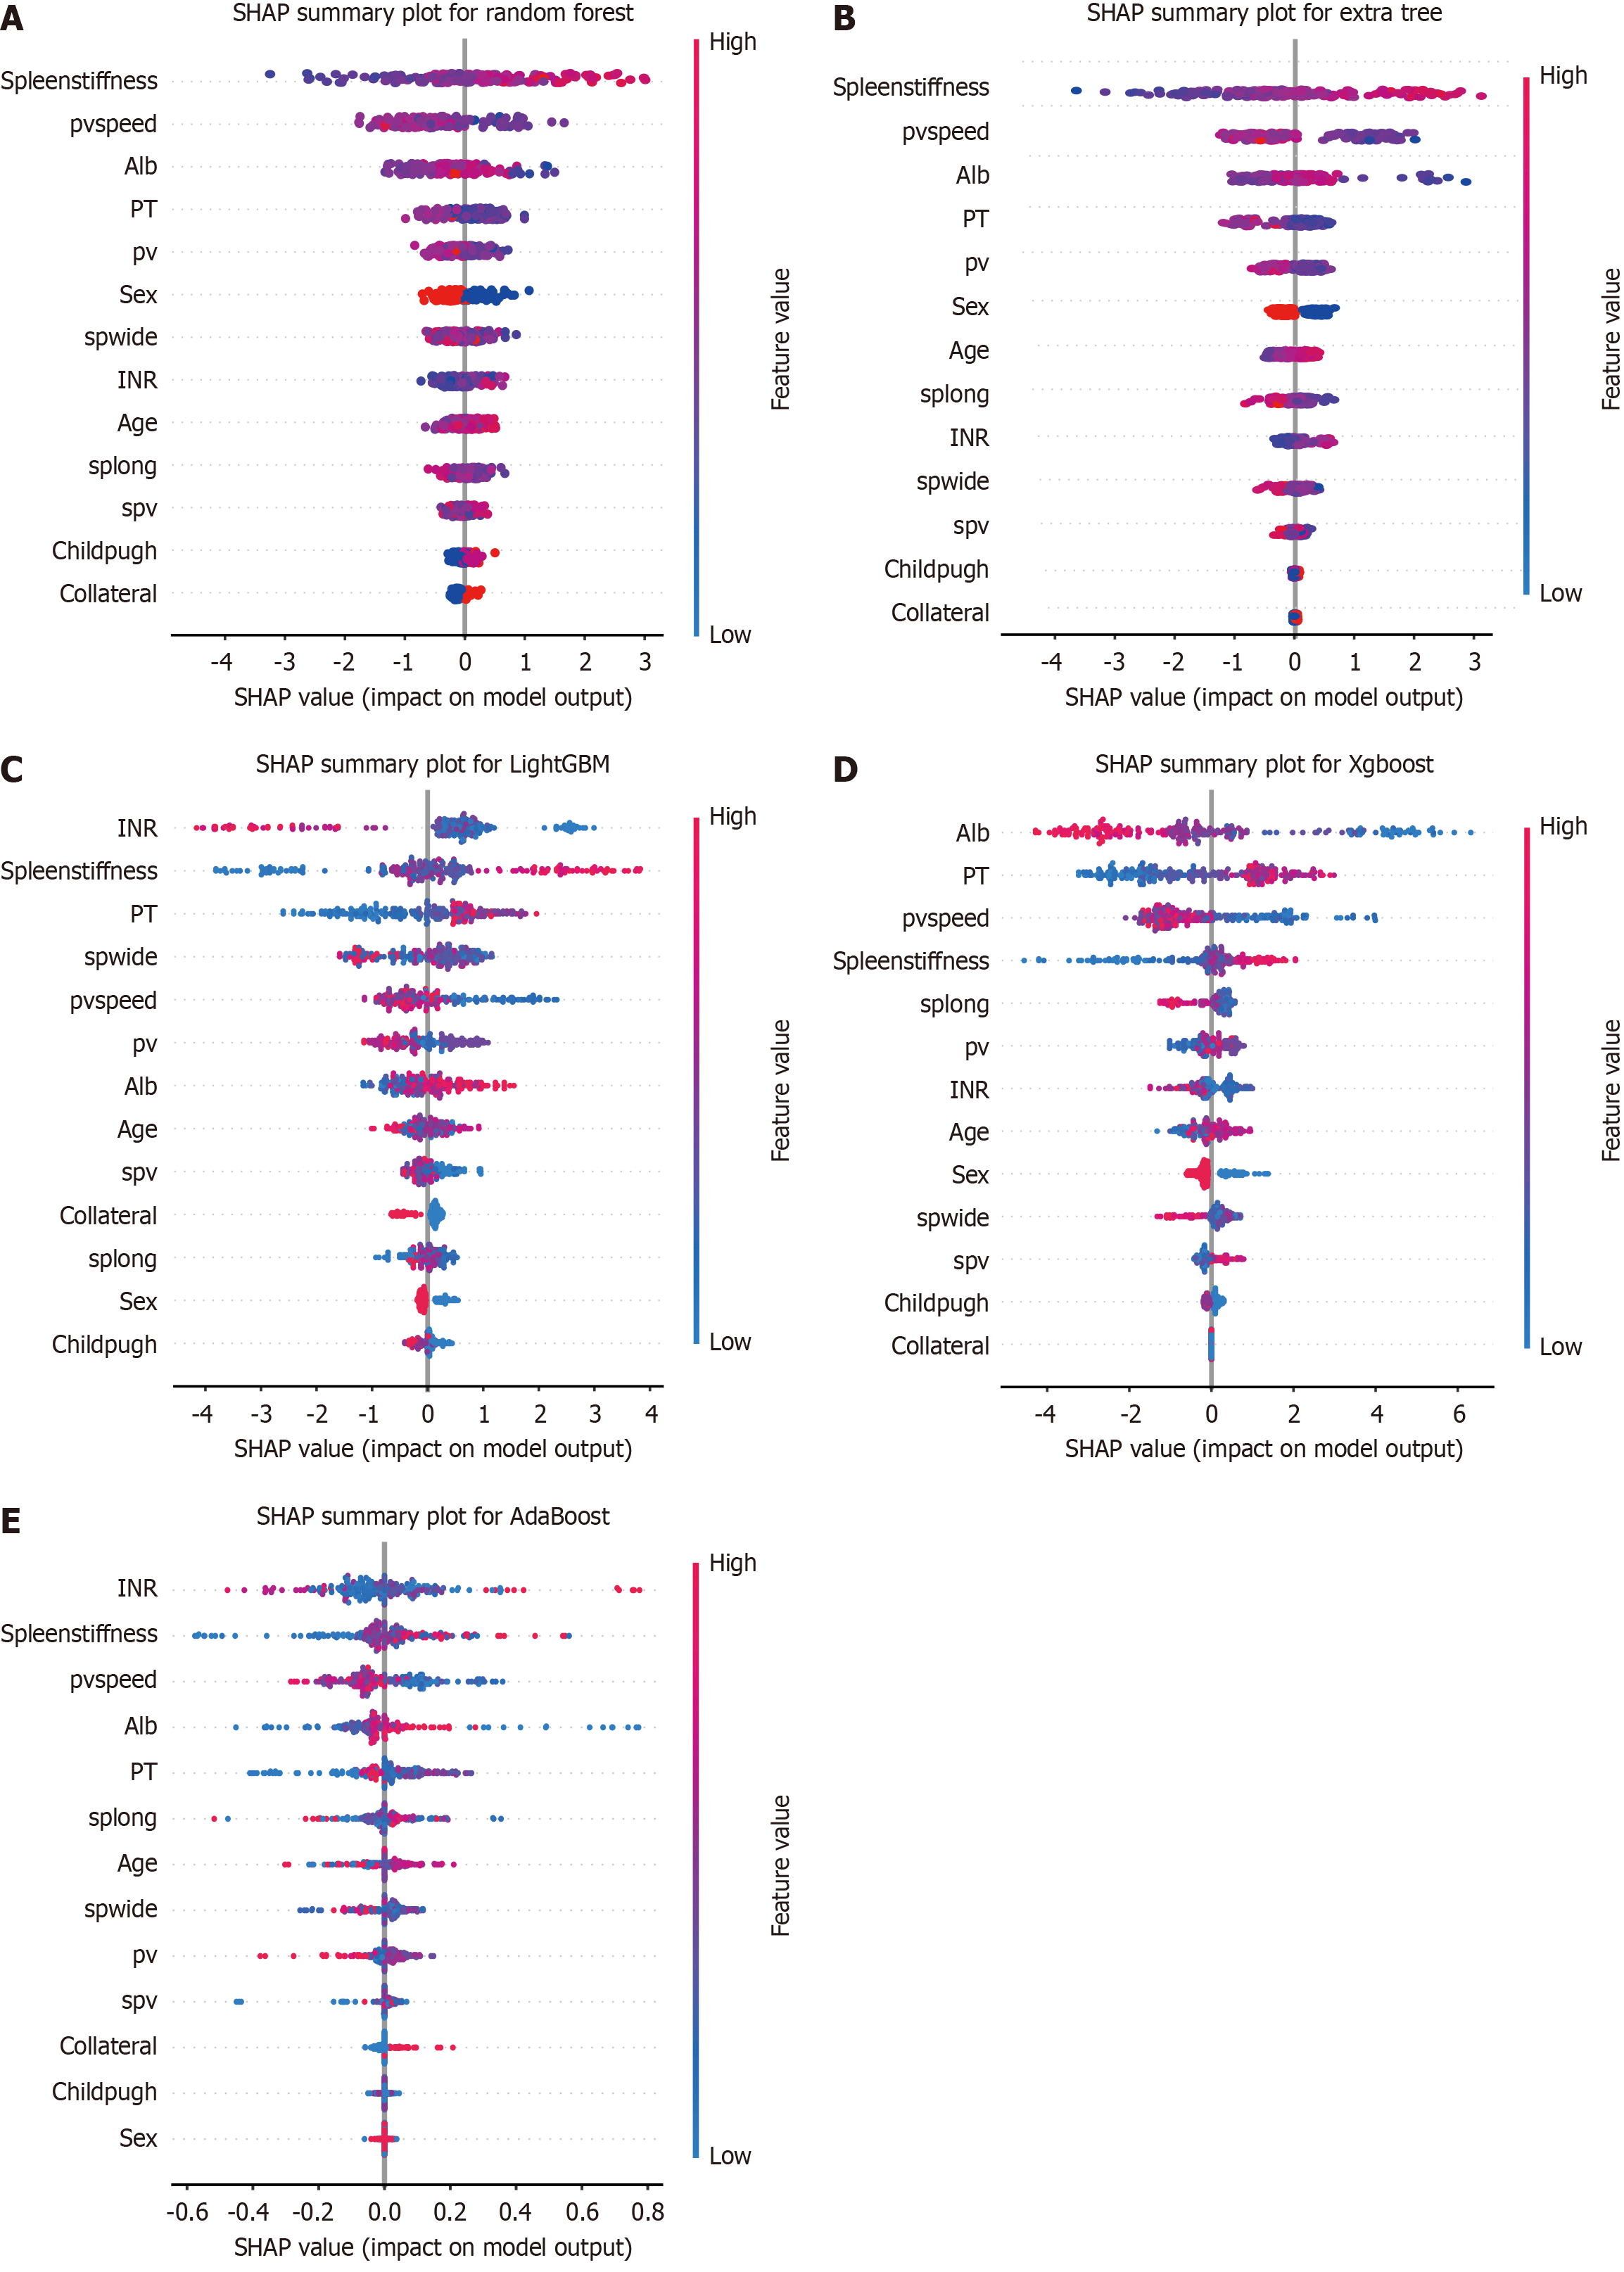
We generated bee swarm plots for the top five models based on AUCs (Figure 4). Beeswarm plots provided a visual representation of feature importance and the direction of the effect of each feature on the model output. In these plots, each point represented a patient, and it was positioned along the x-axis according to the SHAP value of the corresponding feature for that patient. Features were ranked in descending order of importance from top to bottom. For example, in the bee swarm plot for the XGBoost model (Figure 4D), we observed the impact of different features on the predicted probability of EGVs. A positive SHAP value for a feature indicated that the feature contributed to increasing the predicted probability of EGVs, while a negative SHAP value indicated decrease. Specifically, for XGBoost, the plot suggested that lower album in levels, higher prothrombin time (PT) values, lower pvspeed, and higher spleen stiffness were associated with an increased EGV risk.
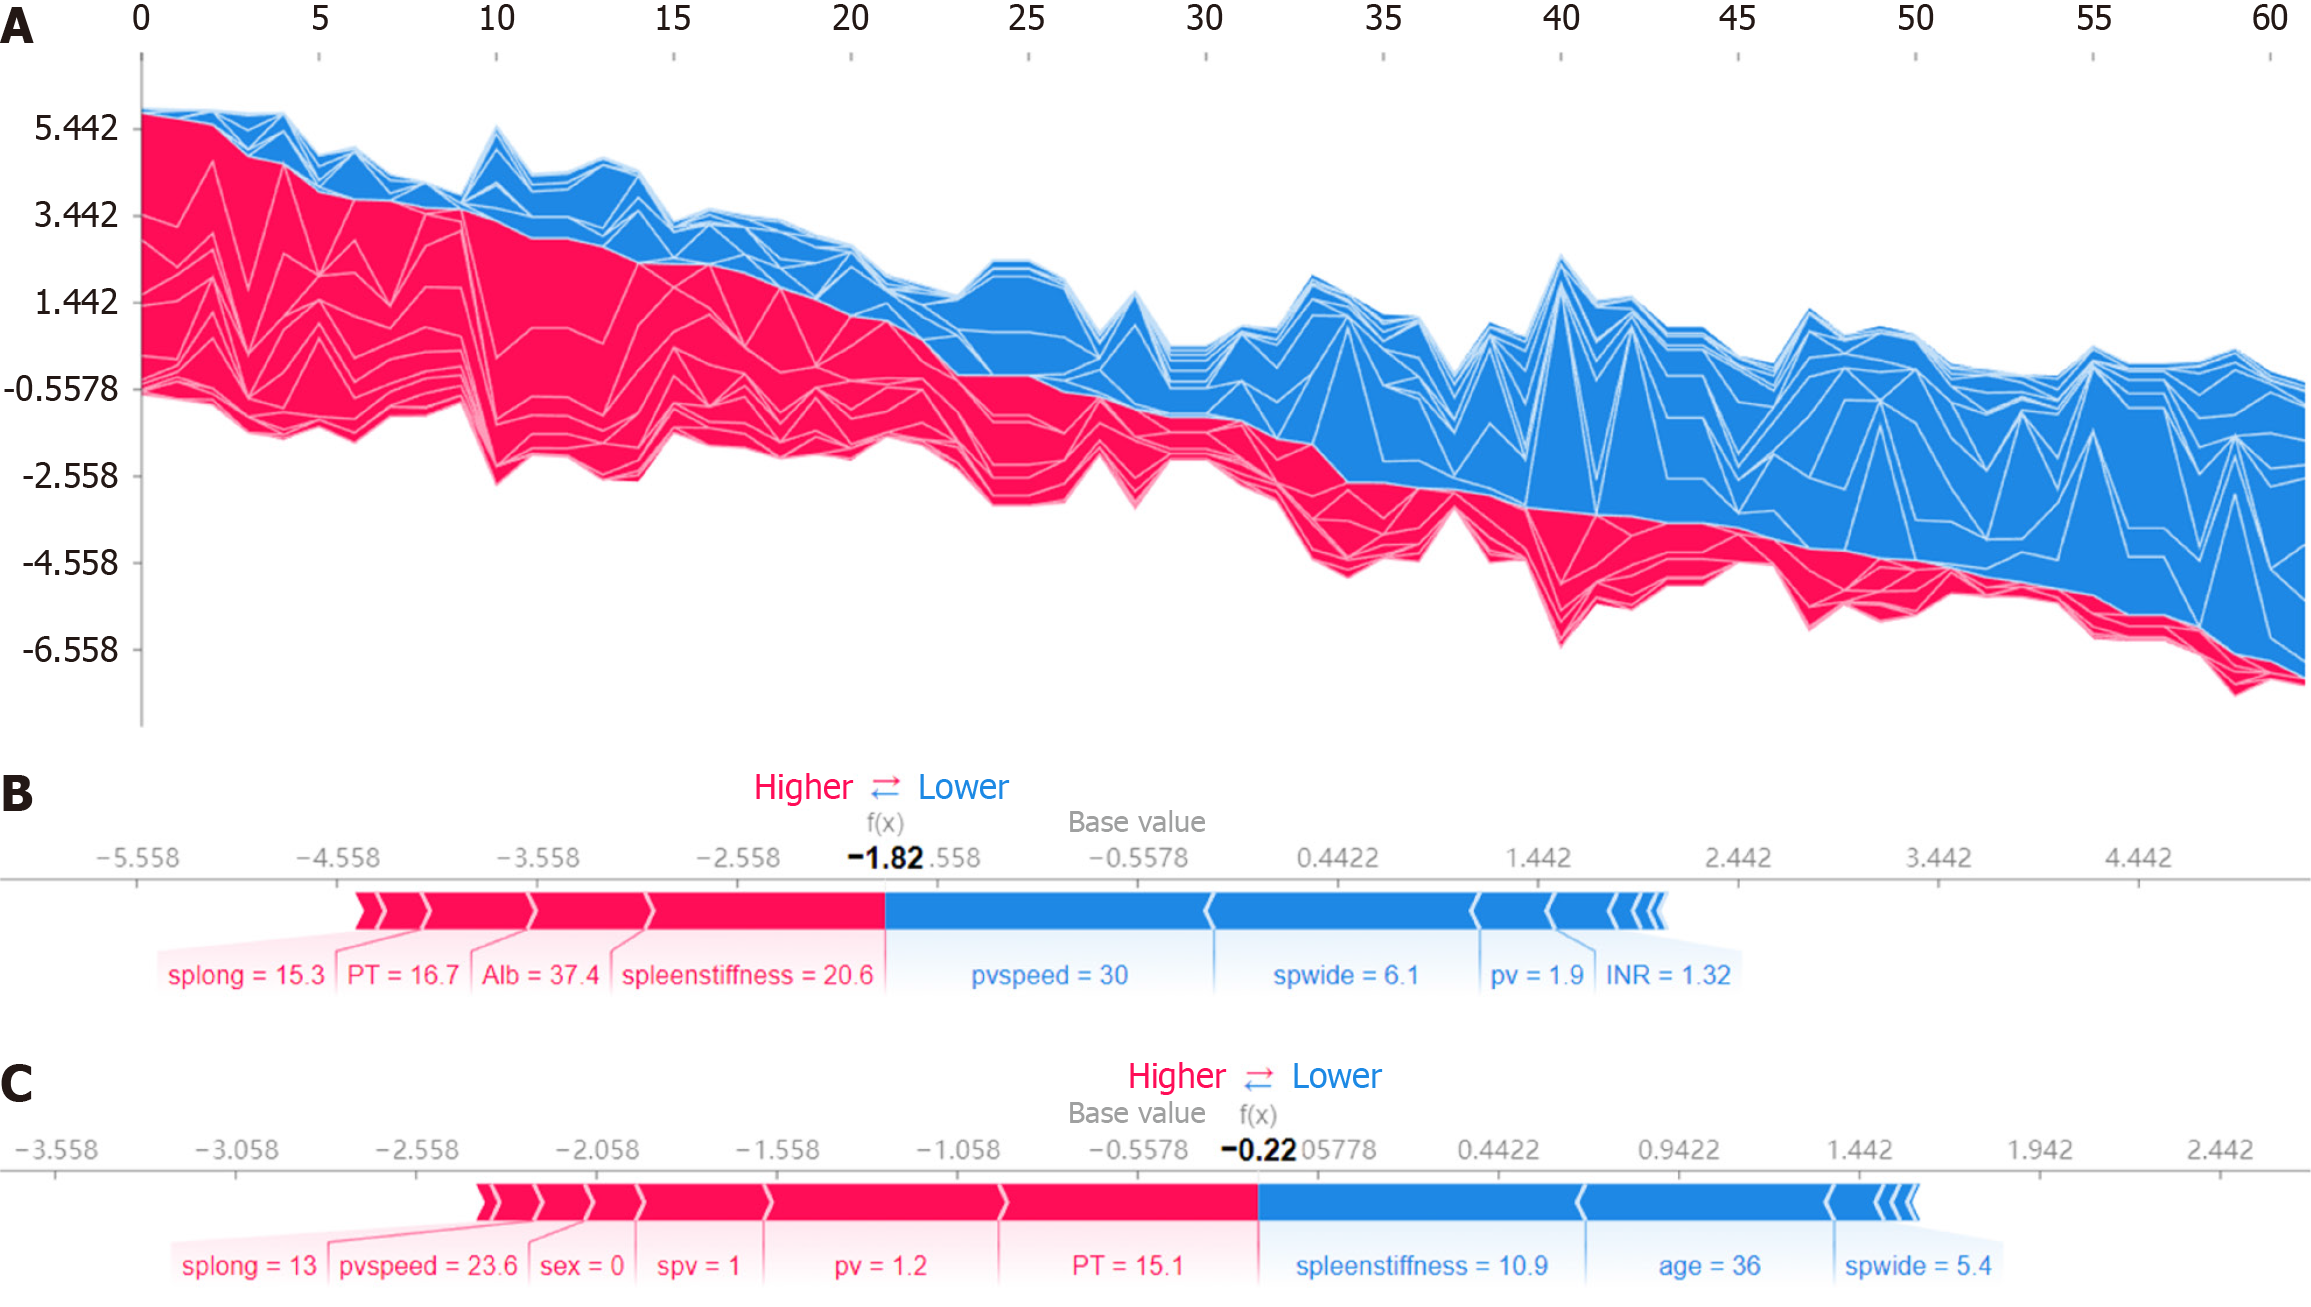
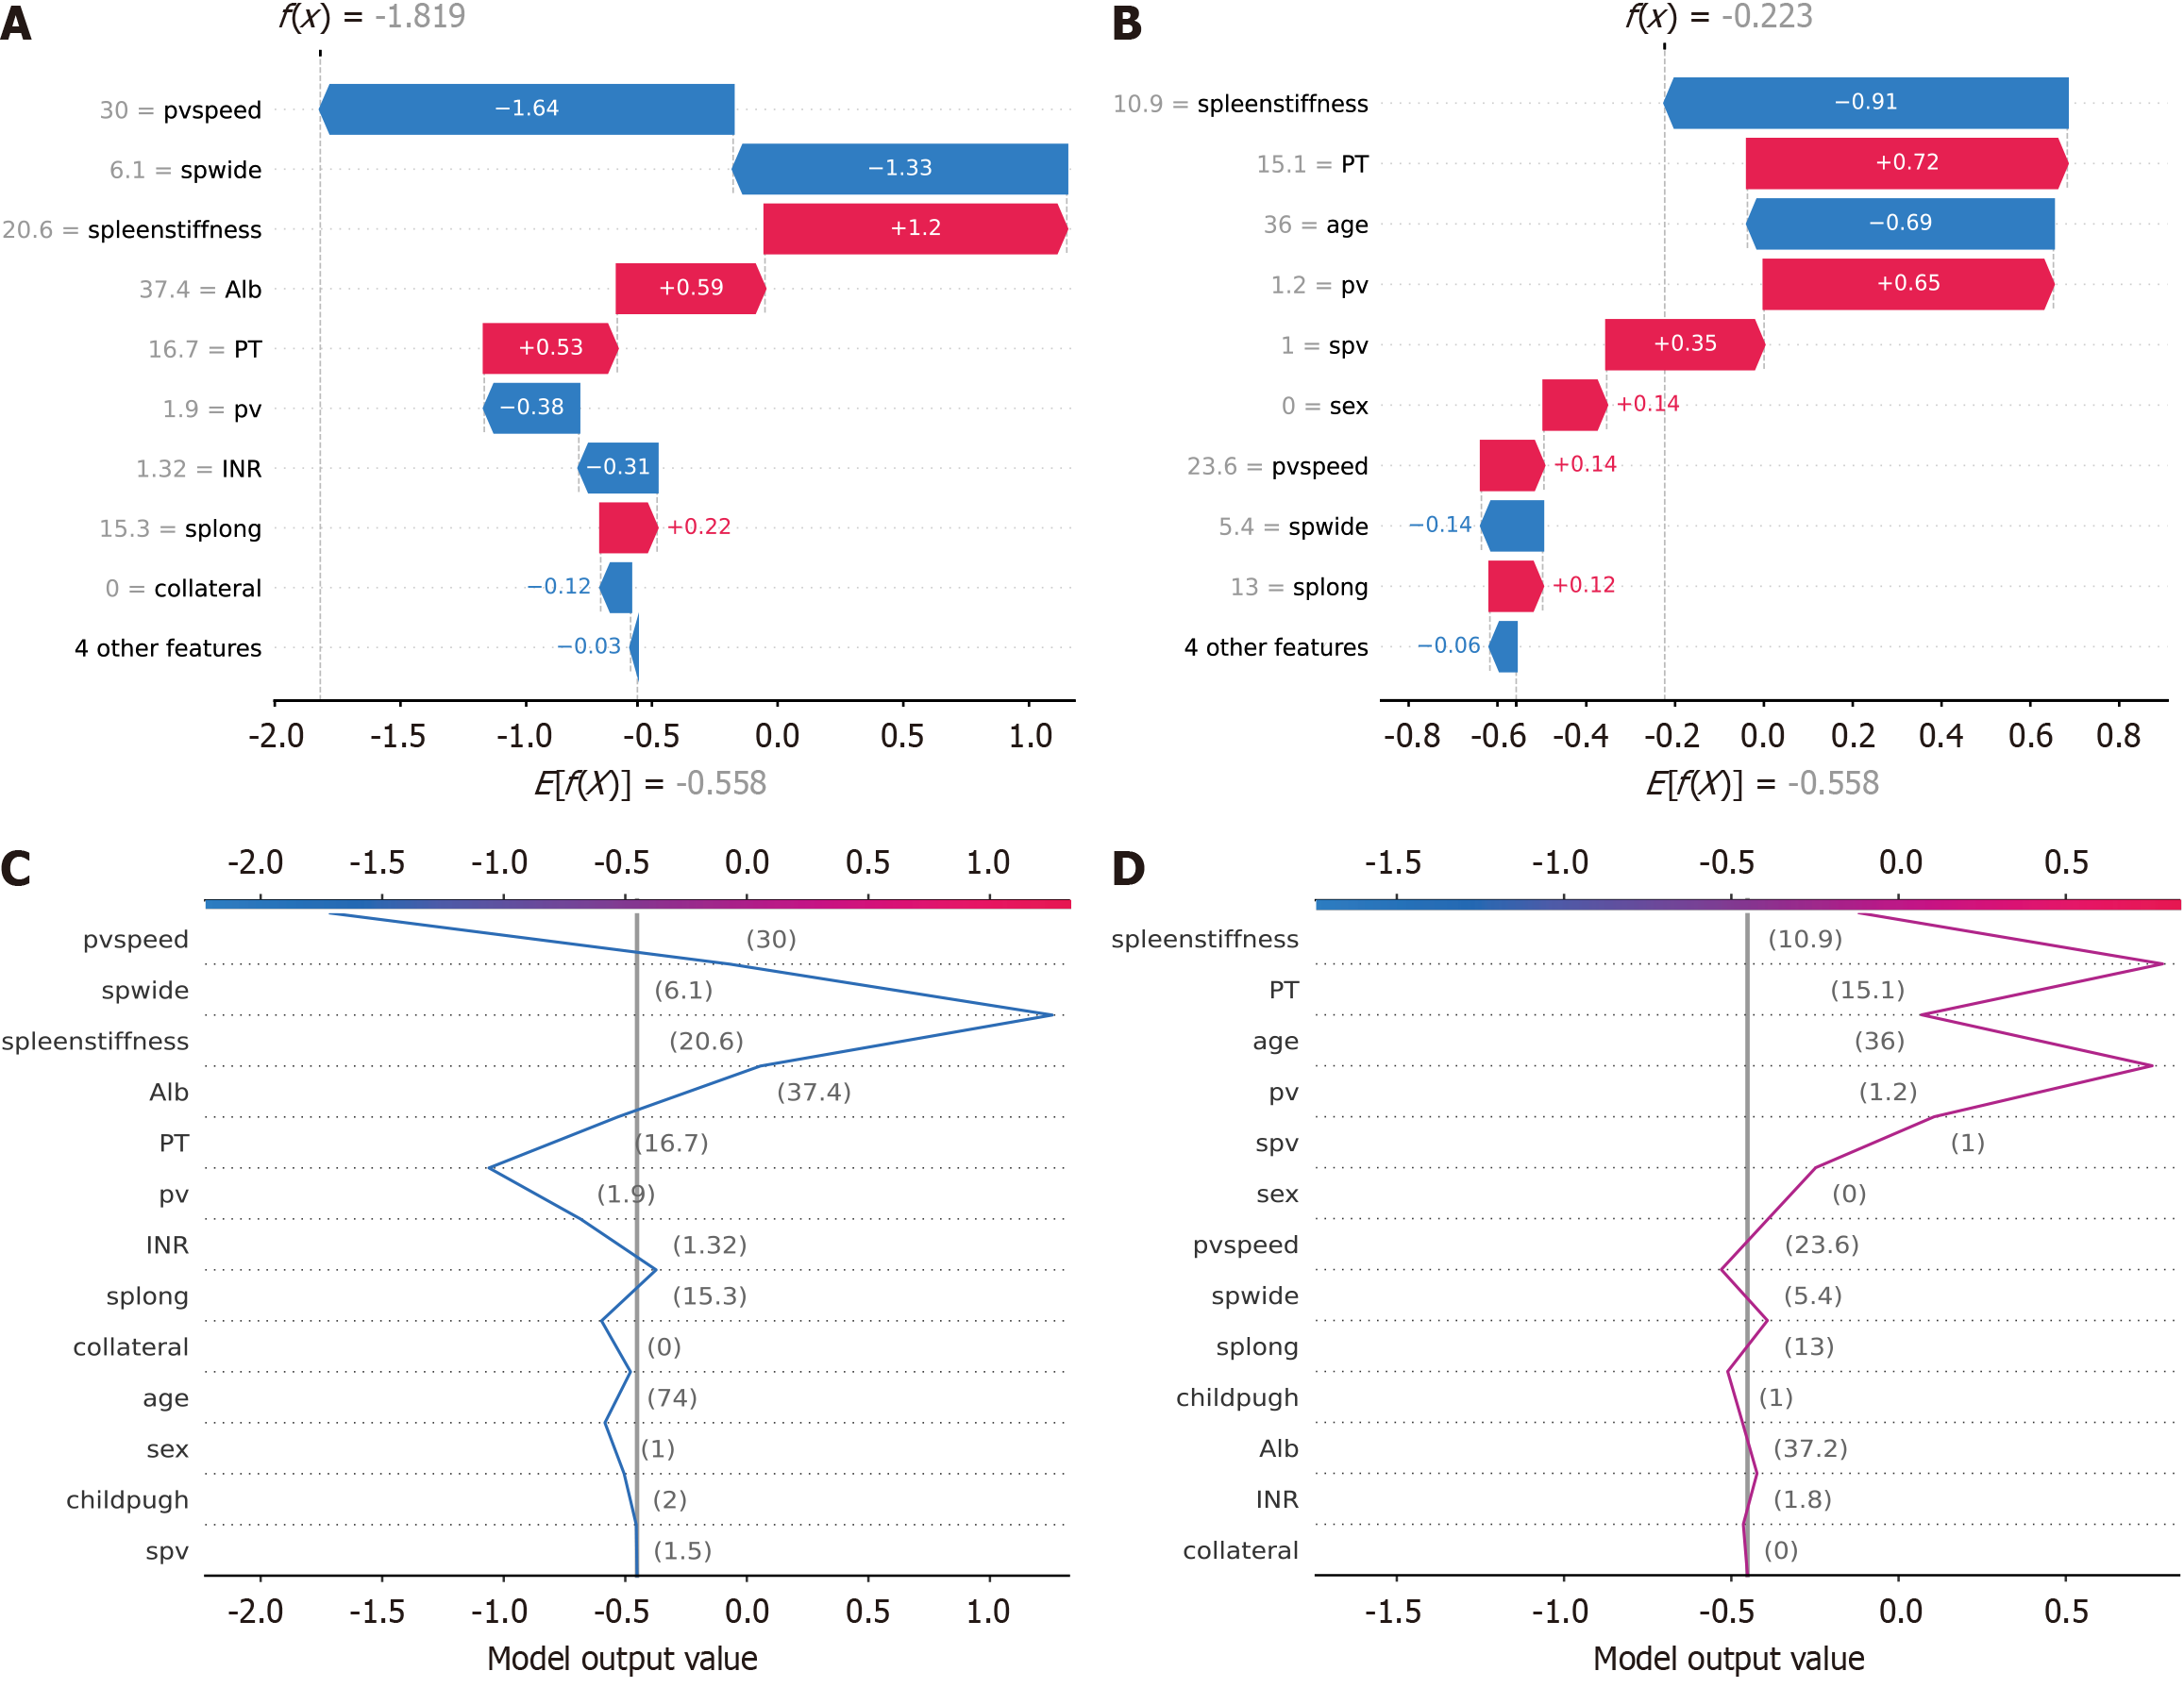
To enhance interpretability, SHAP force plots were generated to illustrate the impact of individual features on the predictions of the model. Figure 5A displays force plots for all patients, providing a comprehensive view of the contribution of each feature to the model output. These plots demonstrated how features such as pvspeed, spwide, spleen stiffness and PT influenced the risk predictions for EGVs. Red segments indicate factors that increased the predictive score (higher risk), while blue segments represent factors that decreased it (lower risk). Figure 5B and C highlights the application of SHAP force plots in specific cases, with separate plots for accurately and inaccurately predicted patients. Figure 5B focuses on incorrectly predicted cases, emphasizing features like spleen length, albumin and PT, which were associated with deviations from the correct outcome. Figure 5C depicts correctly predicted cases, showing the contributions of features such as spleen stiffness, age and spwide, and demonstrating how these factors collectively led to accurate risk assessments. To further analyze the predictions, Figure 6 presents waterfall plots and decision plots for accurately and inaccurately predicted patients. In the waterfall plots, the individual contribution of each feature is displayed, illustrating how cumulative effects led to either corrector incorrect predictions. For correctly predicted patients (Figure 6A), features such as pvspeed, spleen stiffness and spwide strongly influenced the final risk score. Conversely, in inaccurately predicted cases (Figure 6B), misalignment in the contributions of these features resulted in predictive errors. The decision plots (Figure 6C and D) offer a cumulative perspective, showing how the inclusion of each feature incre
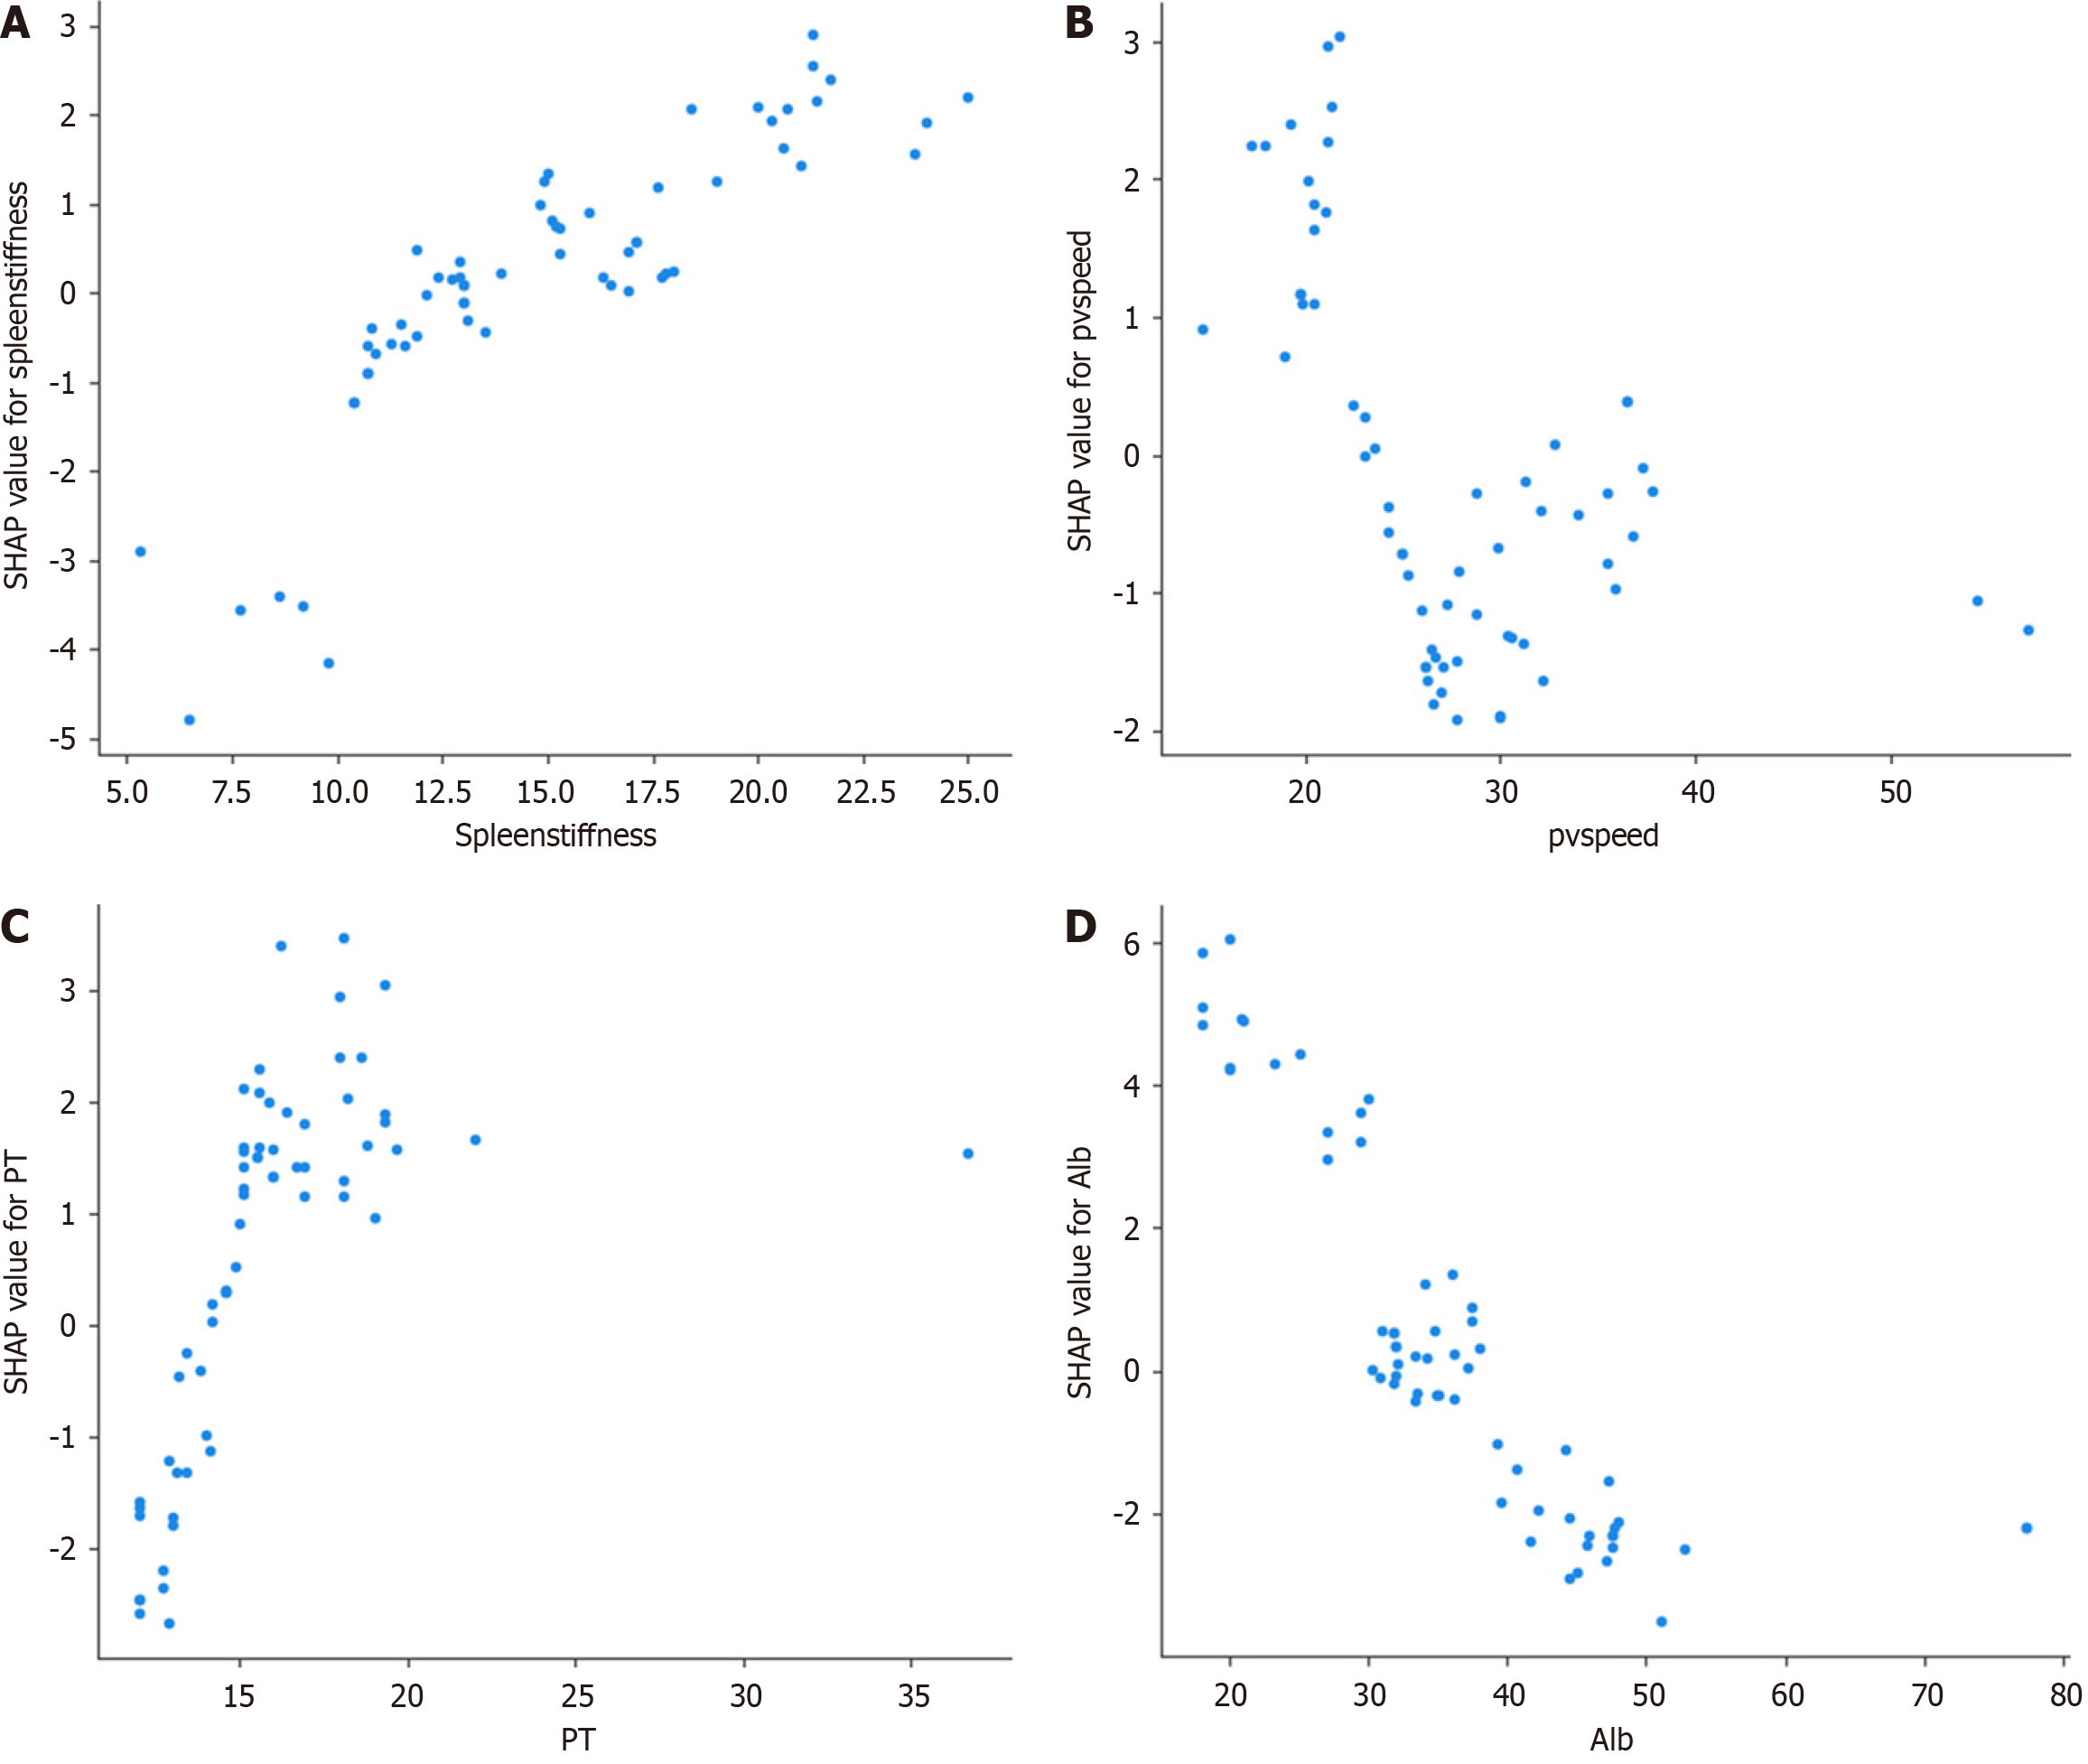
The top four variables identified were spleen stiffness, pvspeed, PT and albumin. Dependency plots for these factors illustrate the relationships between these features and their respective SHAP values, providing insights into their impact on the predictions (Figure 8). Spleen stiffness demonstrated a strong positive correlation with SHAP values, indicating that higher spleen stiffness contributed significantly to the risk prediction for EGVs (Figure 8A). Figure 8B shows an inverse relationship between pvspeed and SHAP values, where lower speeds were associated with a higher risk score, reflecting the role of portal hemodynamics in the development of varices. Similarly, Figure 8C highlights a positive correlation between PT and SHAP values, suggesting that prolonged PT - an indicator of impaired liver function - elevated the risk prediction. Figure 8D depicts a negative correlation between albumin levels and SHAP values, with lower albumin levels, indicative of reduced liver synthetic function, contributing to higher risk scores. These plots collectively emphasize the critical role of these variables in influencing the predictions, offering a detailed understanding of their contributions to the identification of high-risk patients. Additional dependency plots for the other nine variables are shown in Supplementary Figure 2. Interaction plots for continuous variables are depicted in Supplementary Figure 3. SHAP heatmap is depicted in Supplementary Figure 4.
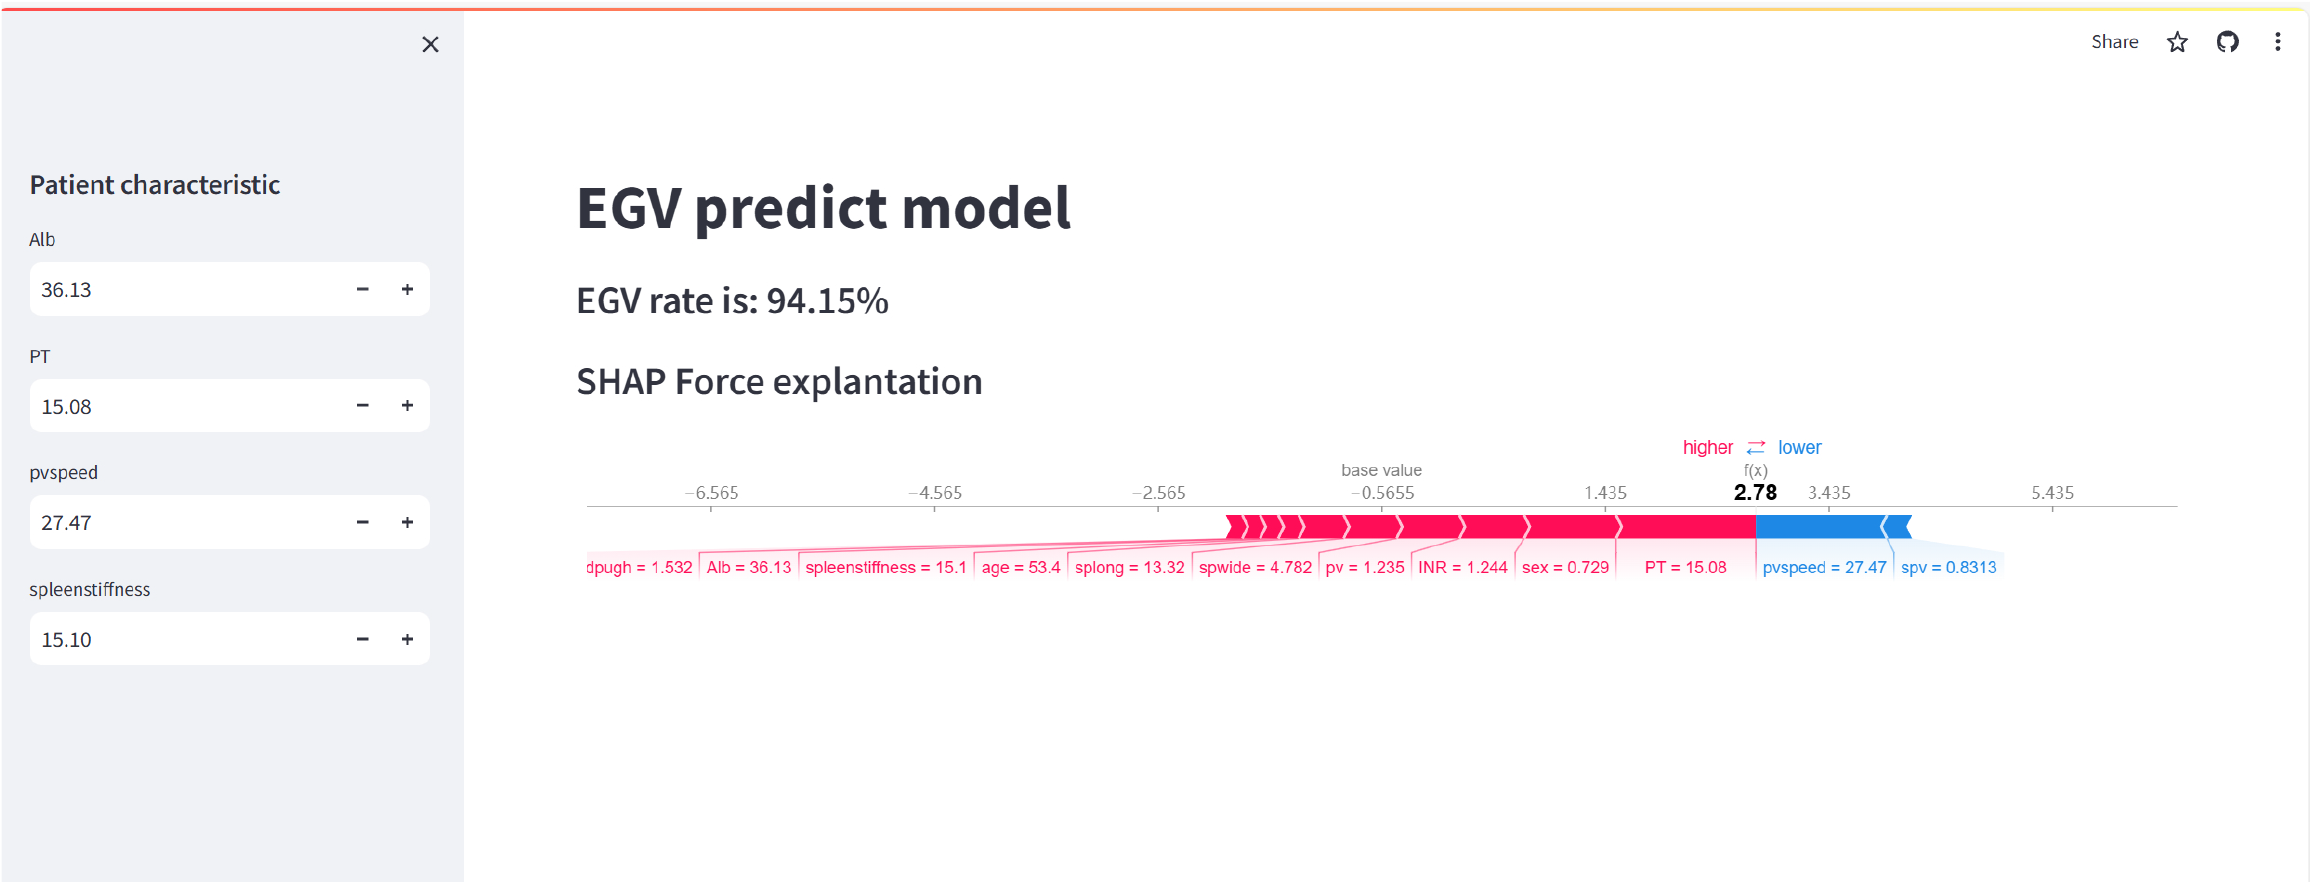
Based on the selected variables, wedeveloped a web-based calculator, accessible at https://pectgew2rqefrdqyjgqcrh.streamlit.app/. This tool allows users to input patient-specific examination results, such as albumin, PT, pvspeed and spleen stiffness, to generate individualized predictions for the likelihood of high-risk EGVs. As illustrated in Figure 9, the web-based tool provides the predicted EGV risk rate - in this case, 94.15% - and visualizes the contribution of each variable to the final prediction using a SHAP force plot. The red bars represent features that increase the risk score, such as PT and spleen stiffness, while blue bars indicate features that decrease the risk score, such as higher pvspeed. This interactive platform enables clinicians to intuitively understand the key factors driving the prediction, making it a prac
In this study, we developed and validated a noninvasive predictive model using 11 ML algorithms for EGVs in hepatitis B patients. The XGBoost model demonstrated superior performance, achieving an AUC of 0.96 in the validation dataset. The model was effectively interpreted using SHAP, identifying key predictors such as spleen stiffness, pvspeed, PT and albumin levels. These findings suggest that our model can reliably predict the risk of severe EGVs, facilitating targeted endoscopic screening and improving clinical decision-making.
Our study distinguishes itself from previous research primarily through its methodological rigor and comprehensive approach. While earlier studies typically used a single ML algorithm or a few algorithms to predict EGVs[13,14], we utilized an extensive suite of 11 different ML algorithms. This broad evaluation allowed us to meticulously compare and identify the most effective models. The XGBoost model emerged as the superior algorithm, achieving an impressive AUC of 0.96 in our validation dataset. This contrasts sharply with previous studies, which often reported lower AUC values because of their limited algorithmic scope and less rigorous validation processes[15]. Our approach ensures greater reliability and robustness in prediction but also highlights the enhanced accuracy achievable through comprehensive algorithmic evaluation.
In examining the role of albumin in predicting EGVs, our study confirms and extends the findings of previous research. Earlier studies, such as those by Li et al[16] and Majid et al[17], have documented the association between lower albumin levels and increased risk of varices. These studies typically relied on traditional statistical methods and did not fully exploit the predictive potential of albumin within a comprehensive predictive framework. Our study integrated albumin with other significant predictors to demonstrate how albumin, as a marker of liver synthetic function, signi
PT has long been recognized as a significant indicator of liver function and a predictor of varices. Previous studies, such as those by Li et al[18] have highlighted its relevance but often used conventional statistical analyses that may overlook complex interactions between PT and other predictors. PT reflects the ability of the liver to produce clotting factors, and prolonged PT indicates liver dysfunction and a higher risk of bleeding varices. Our study utilized PT as one of the critical predictors, capturing the intricate relationships between it and other variables. This comprehensive approach enhanced the accuracy of varices prediction, demonstrating the advantage of understanding and utilizing clinical predictors in a multifaceted framework.
The inclusion of pvspeed in our predictive model represents a significant advancement over previous imaging tech
Spleen stiffness has been identified as an important marker in previous studies[19,20], which noted its predictive value for portal hypertension and varices. However, these studies often did not integrate spleen stiffness into a comprehensive predictive model, limiting their predictive power. Spleen stiffness reflects the degree of portal hypertension and splenic congestion, which are directly related to the presence of varices. Our study confirmed spleen stiffness as a critical predictor and integrated it with other significant factors, improving the accuracy and reliability of the model. By focusing on spleen stiffness and utilizing advanced techniques, we were able to create a more effective and interpretable predictive model, demonstrating the enhanced capability of our comprehensive approach in accurately predicting severe EGVs. Despite the promising results, this study had some limitations. The retrospective design may have introduced selection bias, and the findings may not be generalized to other populations. Additionally, while the model performed well in our cohort, external validation in different settings is necessary to confirm its utility.
Our study demonstrates that a high-accuracy noninvasive predictive model using ML algorithms for EGVs in hepatitis B patients is feasible. This model, supported by a user-friendly web application, holds promise for improving patient care and optimizing resource allocation in clinical practice. Continued research and external validation will be crucial in realizing the full potential of this predictive tool.
We express our gratitude to the patients who participated in this research.
| 1. | Songtanin B, Chaisrimaneepan N, Mendóza R, Nugent K. Burden, Outcome, and Comorbidities of Extrahepatic Manifestations in Hepatitis B Virus Infections. Viruses. 2024;16:618. [RCA] [PubMed] [DOI] [Full Text] [Cited by in RCA: 12] [Reference Citation Analysis (0)] |
| 2. | Hsu YC, Huang DQ, Nguyen MH. Global burden of hepatitis B virus: current status, missed opportunities and a call for action. Nat Rev Gastroenterol Hepatol. 2023;20:524-537. [RCA] [PubMed] [DOI] [Full Text] [Cited by in RCA: 242] [Reference Citation Analysis (1)] |
| 3. | Qi WL, Wen J, Wen TF, Peng W, Zhang XY, Shen JY, Li X, Li C. Prognosis after splenectomy plus pericardial devascularization vs transjugular intrahepatic portosystemic shunt for esophagogastric variceal bleeding. World J Gastrointest Surg. 2023;15:1641-1651. [RCA] [PubMed] [DOI] [Full Text] [Full Text (PDF)] [Reference Citation Analysis (1)] |
| 4. | Anwer M, Asghar MS, Rahman S, Kadir S, Yasmin F, Mohsin D, Jawed R, Memon GM, Rasheed U, Hassan M. Diagnostic Accuracy of Endoscopic Ultrasonography Versus the Gold Standard Endoscopic Retrograde Cholangiopancreatography in Detecting Common Bile Duct Stones. Cureus. 2020;12:e12162. [RCA] [PubMed] [DOI] [Full Text] [Full Text (PDF)] [Cited by in Crossref: 2] [Cited by in RCA: 4] [Article Influence: 0.8] [Reference Citation Analysis (0)] |
| 5. | Waddingham W, Kamran U, Kumar B, Trudgill NJ, Tsiamoulos ZP, Banks M. Complications of diagnostic upper Gastrointestinal endoscopy: common and rare - recognition, assessment and management. BMJ Open Gastroenterol. 2022;9:e000688. [RCA] [PubMed] [DOI] [Full Text] [Full Text (PDF)] [Cited by in RCA: 19] [Reference Citation Analysis (0)] |
| 6. | Vălean D, Zaharie R, Țaulean R, Usatiuc L, Zaharie F. Recent Trends in Non-Invasive Methods of Diagnosis and Evaluation of Inflammatory Bowel Disease: A Short Review. Int J Mol Sci. 2024;25:2077. [RCA] [PubMed] [DOI] [Full Text] [Reference Citation Analysis (0)] |
| 7. | Avery JC, Deslandes A, Freger SM, Leonardi M, Lo G, Carneiro G, Condous G, Hull ML; Imagendo Study Group. Noninvasive diagnostic imaging for endometriosis part 1: a systematic review of recent developments in ultrasound, combination imaging, and artificial intelligence. Fertil Steril. 2024;121:164-188. [RCA] [PubMed] [DOI] [Full Text] [Cited by in Crossref: 20] [Cited by in RCA: 17] [Article Influence: 17.0] [Reference Citation Analysis (0)] |
| 8. | Cho YS, Lim S, Kim Y, Lee MH, Choi SY, Lee JE. Spleen stiffness-spleen size-to-platelet ratio risk score as noninvasive predictors of esophageal varices in patients with hepatitis B virus-related cirrhosis. Medicine (Baltimore). 2022;101:e29389. [RCA] [PubMed] [DOI] [Full Text] [Full Text (PDF)] [Cited by in RCA: 5] [Reference Citation Analysis (0)] |
| 9. | Cho H, She J, De Marchi D, El-Zaatari H, Barnes EL, Kahkoska AR, Kosorok MR, Virkud AV. Machine Learning and Health Science Research: Tutorial. J Med Internet Res. 2024;26:e50890. [RCA] [PubMed] [DOI] [Full Text] [Cited by in Crossref: 2] [Reference Citation Analysis (0)] |
| 10. | Tayebi Arasteh S, Han T, Lotfinia M, Kuhl C, Kather JN, Truhn D, Nebelung S. Large language models streamline automated machine learning for clinical studies. Nat Commun. 2024;15:1603. [RCA] [PubMed] [DOI] [Full Text] [Cited by in RCA: 30] [Reference Citation Analysis (0)] |
| 11. | Haug CJ, Drazen JM. Artificial Intelligence and Machine Learning in Clinical Medicine, 2023. N Engl J Med. 2023;388:1201-1208. [RCA] [PubMed] [DOI] [Full Text] [Cited by in Crossref: 685] [Cited by in RCA: 495] [Article Influence: 247.5] [Reference Citation Analysis (1)] |
| 12. | Sharma A, Lysenko A, Jia S, Boroevich KA, Tsunoda T. Advances in AI and machine learning for predictive medicine. J Hum Genet. 2024;69:487-497. [RCA] [PubMed] [DOI] [Full Text] [Cited by in Crossref: 7] [Cited by in RCA: 33] [Article Influence: 33.0] [Reference Citation Analysis (0)] |
| 13. | Murillo Pineda MI, Siu Xiao T, Sanabria Herrera EJ, Ayala Aguilar A, Arriaga Escamilla D, Aleman Reyes AM, Rojas Marron AD, Fabila Lievano RR, de Jesús Correa Gomez JJ, Martinez Ramirez M. The Prediction and Treatment of Bleeding Esophageal Varices in the Artificial Intelligence Era: A Review. Cureus. 2024;16:e55786. [RCA] [PubMed] [DOI] [Full Text] [Reference Citation Analysis (0)] |
| 14. | Peng J, Zeng X, Huang S, Zhang H, Xia H, Zou K, Zhang W, Shi X, Shi L, Zhong X, Lü M, Peng Y, Tang X. Trends of hospitalisation among new admission inpatients with oesophagogastric variceal bleeding in cirrhosis from 2014 to 2019 in the Affiliated Hospital of Southwest Medical University: a single-centre time-series analysis. BMJ Open. 2024;14:e074608. [RCA] [PubMed] [DOI] [Full Text] [Full Text (PDF)] [Cited by in Crossref: 1] [Reference Citation Analysis (0)] |
| 15. | Wang Y, Hong Y, Wang Y, Zhou X, Gao X, Yu C, Lin J, Liu L, Gao J, Yin M, Xu G, Liu X, Zhu J. Automated Multimodal Machine Learning for Esophageal Variceal Bleeding Prediction Based on Endoscopy and Structured Data. J Digit Imaging. 2023;36:326-338. [RCA] [PubMed] [DOI] [Full Text] [Cited by in Crossref: 5] [Cited by in RCA: 16] [Article Influence: 8.0] [Reference Citation Analysis (0)] |
| 16. | Li F, Wang T, Liang J, Qian B, Tang F, Gao Y, Lv J. Albuminbilirubin grade and INR for the prediction of esophagogastric variceal rebleeding after endoscopic treatment in cirrhosis. Exp Ther Med. 2023;26:501. [RCA] [PubMed] [DOI] [Full Text] [Full Text (PDF)] [Reference Citation Analysis (0)] |
| 17. | Majid Z, Khan SA, Akbar N, Khalid MA, Hanif FM, Laeeq SM, Luck NH. The Use of Albumin-to-bilirubin Score in Predicting Variceal Bleed: A Pilot Study from Pakistan. Euroasian J Hepatogastroenterol. 2022;12:77-80. [RCA] [PubMed] [DOI] [Full Text] [Cited by in Crossref: 2] [Reference Citation Analysis (0)] |
| 18. | Li J, Li J, Ji Q, Wang Z, Wang H, Zhang S, Fan S, Wang H, Kong D, Ren J, Zhou Y, Yang R, Zheng H. Nomogram based on spleen volume expansion rate predicts esophagogastric varices bleeding risk in patients with hepatitis B liver cirrhosis. Front Surg. 2022;9:1019952. [RCA] [PubMed] [DOI] [Full Text] [Full Text (PDF)] [Cited by in Crossref: 5] [Cited by in RCA: 5] [Article Influence: 1.7] [Reference Citation Analysis (0)] |
| 19. | Upadhyay P, Khanna R, Sood V, Lal BB, Patidar Y, Alam S. Splenic Stiffness Is the Best Predictor of Clinically Significant Varices in Children With Portal Hypertension. J Pediatr Gastroenterol Nutr. 2023;76:364-370. [RCA] [PubMed] [DOI] [Full Text] [Reference Citation Analysis (0)] |
| 20. | Dajti E, Ravaioli F, Zykus R, Rautou PE, Elkrief L, Grgurevic I, Stefanescu H, Hirooka M, Fraquelli M, Rosselli M, Chang PEJ, Piscaglia F, Reiberger T, Llop E, Mueller S, Marasco G, Berzigotti A, Colli A, Festi D, Colecchia A; Spleen Stiffness—IPD-MA Study Group. Accuracy of spleen stiffness measurement for the diagnosis of clinically significant portal hypertension in patients with compensated advanced chronic liver disease: a systematic review and individual patient data meta-analysis. Lancet Gastroenterol Hepatol. 2023;8:816-828. [RCA] [PubMed] [DOI] [Full Text] [Cited by in Crossref: 42] [Cited by in RCA: 38] [Article Influence: 19.0] [Reference Citation Analysis (0)] |


