


Published online Mar 7, 2024. doi: 10.3748/wjg.v30.i9.1164
Peer-review started: October 22, 2023
First decision: January 5, 2024
Revised: January 15, 2024
Accepted: February 7, 2024
Article in press: February 7, 2024
Published online: March 7, 2024
Processing time: 135 Days and 14.9 Hours
Diffusion-weighted imaging (DWI) has been developed to stage liver fibrosis. However, its diagnostic performance is inconsistent among studies. Therefore, it is worth studying the diagnostic value of various diffusion models for liver fibrosis in one cohort.
To evaluate the clinical potential of six diffusion-weighted models in liver fibrosis staging and compare their diagnostic performances.
This prospective study enrolled 59 patients suspected of liver disease and scheduled for liver biopsy and 17 healthy participants. All participants underwent multi-b value DWI. The main DWI-derived parameters included Mono-apparent diffusion coefficient (ADC) from mono-exponential DWI, intravoxel incoherent motion model-derived true diffusion coefficient (IVIM-D), diffusion kurtosis imaging-derived apparent diffusivity (DKI-MD), stretched exponential model-derived distributed diffusion coefficient (SEM-DDC), fractional order calculus (FROC) model-derived diffusion coefficient (FROC-D) and FROC model-derived microstructural quantity (FROC-μ), and continuous-time random-walk (CTRW) model-derived anomalous diffusion coefficient (CTRW-D) and CTRW model-derived temporal diffusion heterogeneity index (CTRW-α). The correlations between DWI-derived parameters and fibrosis stages and the parameters’ diagnostic efficacy in detecting significant fibrosis (SF) were assessed and compared.
CTRW-D (r = -0.356), CTRW-α (r = -0.297), DKI-MD (r = -0.297), FROC-D (r = -0.350), FROC-μ (r = -0.321), IVIM-D
The DWI models were similarly valuable in distinguishing SF in patients with liver disease. The combined index of CTRW parameters had the highest AUC.
Core Tip: Six diffusion-weighted models generate quantitative information that can be used in liver fibrosis staging. The assessed diffusion-weighted models were all suitable for liver fibrosis staging, showing similar diagnostic performance in distinguishing significant fibrosis. The combined index of continuous-time random-walk model parameters, which was a novel diffusion-weighted imaging model, had the highest areas under the ROC curve in detecting significant fibrosis.
- Citation: Jiang YL, Li J, Zhang PF, Fan FX, Zou J, Yang P, Wang PF, Wang SY, Zhang J. Staging liver fibrosis with various diffusion-weighted magnetic resonance imaging models. World J Gastroenterol 2024; 30(9): 1164-1176
- URL: https://www.wjgnet.com/1007-9327/full/v30/i9/1164.htm
- DOI: https://dx.doi.org/10.3748/wjg.v30.i9.1164
Liver fibrosis is defined as an excess deposition of extracellular matrix components, such as collagens, glycoproteins, and proteoglycans, in the liver. Liver fibrosis, a public health problem, is closely associated with various prevalent causes of chronic liver damage. This response to liver damage is a dynamic process and potentially reversible[1]. If untreated promptly, liver fibrosis is likely to progress into cirrhosis, which could lead to liver failure and hepatocellular carcinoma[2]. Therefore, early diagnosis and accurate staging of liver fibrosis are very important in clinical practice[3,4]. Liver biopsy is the gold standard for liver fibrosis assessment in clinical practice. However, this is an invasive method, with potential sampling errors, risk of complications, and low patient compliance, all limiting its clinical application[5,6]. Therefore, non-invasive methods have been evaluated for diagnosing and staging liver fibrosis and have become the focus of clinical research.
Diffusion-weighted imaging (DWI) represents the most widely used functional magnetic resonance imaging (MRI) sequence. DWI has been applied to liver fibrosis detection and can provide quantitative information in fibrosis staging[7]. Several encouraging studies showed that DWI was a promising sequence for liver fibrosis staging[8-11]. However, conventional DWI evaluates the diffusion characteristics assuming a Gaussian diffusion distribution through a mono-exponential model that shows limitations in liver tissue assessment. Therefore, advanced DWI models were proposed to provide more accurate information about the tissue in vivo.
Intravoxel incoherent motion is a bi-exponential DWI model that can provide diffusion and perfusion information. It has been used in liver fibrosis staging and was shown to accurately reflect changes in the tissue microstructure[9,10]. Diffusion kurtosis imaging (DKI) and stretched exponential model (SEM) are based on a non-Gaussian diffusion distribution. They can provide additional information and represent a valuable tool for liver fibrosis characterization[12,13]. The fractional order calculus (FROC) is a novel non-Gaussian model, showing potential in liver fibrosis staging[14]. The continuous-time random-walk (CTRW) model is an extension of the FROC model based on the CTRW theory. To date, no studies have used CTRW for liver fibrosis staging. Several studies reported on a comparative evaluation of multiple diffusion models for liver fibrosis assessment, but these compared 2-3 models at most. To our knowledge, no study compared all DWI models in the same group of participants.
This study aimed to investigate the value of the newest diffusion models in staging liver fibrosis and compare their performances in distinguishing significant fibrosis (SF).
The ethics committee of Lanzhou University Second Hospital approved this prospective study (2021A-423), and all participants provided written informed consent.
This study enrolled patients with chronic liver diseases and healthy adult volunteers without serious health problems from July 2021 to June 2022. The inclusion criterion for the patients was adults with a chronic liver disease scheduled to undergo a liver biopsy. The inclusion criterion for the healthy volunteers was adults without serious hepatic problems. The exclusion criteria included contraindications to MRI (claustrophobia, metal implants, or pacemakers), incomplete all MRI sequences, or incomplete liver biopsy. Figure 1 summarizes the participant recruitment process. The liver biopsy and MRI examination were performed within a one-week interval.

MRI examination was performed on a 1.5T MR scanner (MAGNETOM Aera, Siemens Healthineers) using a combination of 18-channel body and 32-channel spine matrix coil elements. Multi-b value DWI was performed based on a breath-free single-shot spin-echo echo planar imaging sequence with the following parameters: Repetition time, 6800 ms; time to echo, 58 ms; field of view, 300 mm × 380 mm; matrix, 108 × 134; section thickness, 6 mm; b values; 0, 50, 100, 150, 200, 400, 600, 800, 1000, 1200, 1500, and 2000 s/mm2; total scan time, 16 min and 48 s.
The parametric results of the various DWI models were calculated using an in-house software prototype developed by MR Station (Chengdu Zhongying Medical Technology Co., Ltd.) as follows:
Mono-exponential DWI: The parametric map was calculated using the following fitting formula: Sb = S0 × exp [-b × apparent diffusion coefficient (ADC)].
Where S0 and Sb are the signal intensity when b values of 0 s/mm2 and others are applied, respectively. In this study, we indicated mono-exponential DWI related parameters as: Indicated as Mono-ADC.
Intravoxel Incoherent motion (IVIM): The parametric map was calculated using the following fitting formula: Sb = S0 [(1-f) × exp (-b × D) + f × exp (-b × D*)].
Where S0 and Sb have the same meanings as above, f is the perfusion fraction, D* is the pseudo-diffusion coefficient, and D is the true diffusion coefficient. In this study, we indicated IVIM related parameters as: IVIM model-derived perfusion fraction, IVIM model-derived pseudo-diffusion coefficient (IVIM-D*), IVIM model-derived true diffusion coefficient (IVIM-D).
DKI: The parametric map was calculated using the following fitting formula: Sb = S0 × exp (-b × D + b2 × D2 × K/6).
Where S0 and Sb have the same meanings as above, D is the apparent diffusivity, and K is the excess kurtosis. In this study, we indicated DKI related parameters as: DKI-derived apparent diffusivity, DKI-derived excess kurtosis.
SEM: The parametric map was calculated using the following fitting formula: Sb = S0 × exp [-b × distributed diffusion coefficient (DDC)]α.
Where S0 and Sb have the same meanings as above, DDC is the distributed diffusion coefficient, and α is the intravoxel heterogeneity index. In this study, we indicated SEM related parameters as: SEM-derived DDC (SEM-DDC), SEM-derived intravoxel heterogeneity index (SEM-α).
FROC: The parametric map was calculated using the following fitting formula:
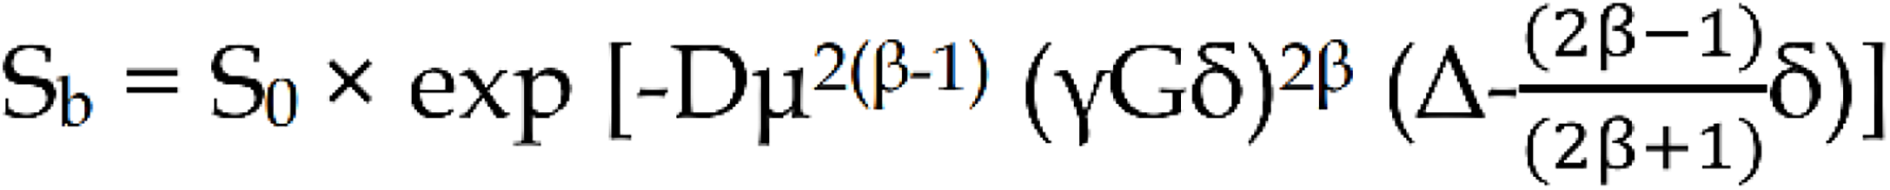 .
.
Where S0 and Sb have the same meanings as above, G is the diffusion gradient amplitude, δ is the diffusion gradient pulse width, D is the diffusion coefficient, β is the fractional order parameter, μ is the microstructural quantity, and Δ is the gradient lobe separation. In this study, we indicated FROC related parameters as: FROC model-derived diffusion coefficient (FROC-D), FROC-derived fractional order parameter, FROC model-derived microstructural quantity (FROC-μ).
CTRW: The parametric map was calculated using the following fitting formula: Sb = S0 Eα [-(bDm)β].
Where S0 and Sb have the same meanings as above, Eα yields a characteristic decay process that is represented by a Mittag-Leffler function, Dm is the anomalous diffusion coefficient, α is the temporal diffusion heterogeneity index, and β is the spatial diffusion heterogeneity index. In this study, we indicated CTRW related parameters as: CTRW model-derived anomalous diffusion coefficient, CTRW model-derived temporal diffusion heterogeneity index (CTRW-α), CTRW model-derived spatial diffusion heterogeneity index (CTRW-β).
Figure 2 shows 14 maps derived from the six DWI models in one patient. All images were analyzed independently by the same abdominal radiologist with ten years of experience in abdominal imaging, who was blinded to the pathology results. The ragion of intreast (ROIs) were delineated in IT-SNAP (Version 3.8.0, http://www.itksnap.org/) software at the central section of the right liver lobe, avoiding large vessels, bile ducts, lesions, and artifacts (Figure 2P). The ROIs were selected on the DWI scans and propagated to the corresponding parameter maps.

One clinical medicine expert reviewed the patients’ medical records. Blood serum parameters were recorded within one week of the MRI examination. The Fibrosis-4 index was calculated based on clinical and routine laboratory variables using previously-defined algorithms[15]. Histopathologic assessments were performed by an experienced pathologist, who graded liver fibrosis (F0-F4) based on the Scheuer semiquantitative scoring system[16]. The Scheuer scoring system is one of the mostused scoring systems and is recommended by the Chinese consensus on the diagnosis and therapy of liver fibrosis for the pathological diagnosis of liver inflammation and fibrosis[3]. A fibrosis stage ≥ F2 was defined as SF, singling out a target population for pharmacotherapy[3,17].
One-way ANOVA or Kruskal-Wallis tests evaluate whether the DWI-derived parameters differed significantly among fibrosis stages. We used the LSD post-hoc test for multiple comparisons. Spearman correlation coefficient analyses assessed the correlations between the DWI-derived parameters and the fibrosis stage. The ability of the various DWI-derived parameters and their combinations in model units to identify patients with SF was assessed by the areas under the ROC curves (AUCs) and their 95%CIs. AUCs of the various DWI models were statistically compared by the DeLong method.
Statistical analysis was performed using IBM SPSS Statistics for Windows, Version 26.0 (IBM Corp.), OriginPro, Version 2022b (OriginLab Northampton, MA, United States), and Medcalc, Version 19.0.4 (MedCalc Software bvba, Ostend, Belgium).
A total of 59 patients and 17 healthy controls were finally enrolled. The participants’ demographic and clinical characteristics are presented in Table 1. The underlying causes of chronic liver disease among the patients were hepatitis B virus (n = 39), nonalcoholic steatohepatitis (n = 8), chronic liver disease without hepatitis virus infection (n = 8), drug toxicities (n = 3), and autoimmune disease (n = 1).
| Parameter | Patients | Healthy control |
| No. of participants | 59 | 17 |
| Sex (male: female) | 27:32 | 9:8 |
| Mean age (yr) | 41 ± 12 | 36 ± 11 |
| AST level (U/L) | 46.46 ± 68.71 | - |
| ALT level (U/L) | 49.86 ± 70.84 | - |
| Serum albumin (g/L) | 41.58 ± 5.17 | - |
| TBIL (μmol/L) | 22.13 ± 20.10 | - |
| Platelet (× 109/L) | 190.20 ± 72.88 | - |
Histopathology indicated that 14 patients had stage F1, 28 had stage F2, seven had stage F3, and ten had stage F4. The 17 healthy controls were staged as F0. Differences in the DWI-derived parameters among the liver fibrosis stages are shown in Table 2. Liver fibrosis stages differed significantly in Mono-ADC, IVIM-D, FROC-D, and CTRW model-derived anomalous diffusion coefficient (CTRW-D). Detailed comparisons are presented in Figure 3.

| Stage | n | Mono-ADC (× 10-3 mm2/s) | IVIM-D (× 10-3 mm2/s) | IVIM-D* (× 10-3 mm2/s) | IVIM-f (%) | DKI-MD (× 10-3 mm2/s) | DKI-MK | SEM-DDC (× 10-3 mm2/s) | SEM-α | FROC-D (× 10-3 mm2/s) | FROC-β | FROC-μ (μm) | CTRW-D (× 10-3 mm2/s) | CTRW-α | CTRW-β |
| 0 | 17 | 1.099 ± 0.074 | 0.893 ± 0.088 | 1.168 ± 0.200 | 0.248 ± 0.071 | 1.616 ± 0.191 | 0.855 ± 0.110 | 1.580 ± 0.286 | 0.586 ± 0.081 | 0.902 ± 0.065 | 0.609 ± 0.085 | 4.103 ± 0.218 | 1.209 ± 0.085 | 0.980 (0.973-0.994) | 0.551 ± 0.092 |
| 1 | 14 | 1.134 ± 0.081 | 0.980 ± 0.076 | 1.135 ± 0.299 | 0.196 ± 0.063 | 1.554 ± 0.200 | 0.745 ± 0.117 | 1.540 ± 0.270 | 0.629 ± 0.078 | 0.946 ± 0.061 | 0.659 ± 0.084 | 4.011 ± 0.368 | 1.214 ± 0.091 | 0.987 (0.979-0.993) | 0.596 ± 0.095 |
| 2 | 28 | 1.062 ± 0.095 | 0.880 ± 0.095 | 1.122 ± 0.287 | 0.225 ± 0.062 | 1.513 ± 0.183 | 0.838 ± 0.114 | 1.451 ± 0.229 | 0.607 ± 0.081 | 0.879 ± 0.078 | 0.636 ± 0.083 | 3.988 ± 0.324 | 1.158 ± 0.107 | 0.982 (0.954-0.993) | 0.580 ± 0.094 |
| 3 | 7 | 1.015 ± 0.119 | 0.845 ± 0.145 | 1.067 ± 0.115 | 0.216 ± 0.068 | 1.465 ± 0.187 | 0.868 ± 0.141 | 1.414 ± 0.263 | 0.611 ± 0.095 | 0.831 ± 0.113 | 0.642 ± 0.085 | 3.866 ± 0.250 | 1.116 ± 0.114 | 0.956 (0.946-0.989) | 0.595 ± 0.087 |
| 4 | 10 | 1.018 ± 0.091 | 0.860 ± 0.072 | 1.057 ± 0.161 | 0.201 ± 0.042 | 1.427 ± 0.191 | 0.825 ± 0.066 | 1.341 ± 0.220 | 0.633 ± 0.040 | 0.836 ± 0.085 | 0.663 ± 0.042 | 3.809 ± 0.269 | 1.110 ± 0.119 | 0.955 (0.942-0.989) | 0.615 ± 0.048 |
| F/H1 | 3.704 | 3.980 | 0.418 | 1.624 | 1.929 | 2.458 | 1.830 | 0.830 | 4.300 | 1.044 | 1.820 | 2.764 | 8.342 | 1.003 | |
| P value | 0.009 | 0.006 | 0.795 | 0.178 | 0.115 | 0.053 | 0.133 | 0.511 | 0.004 | 0.391 | 0.134 | 0.034 | 0.080 | 0.412 |
The fibrosis stages showed significant inverse correlations with Mono-ADC, IVIM-D, DKI-derived apparent diffusivity, SEM-DDC, FROC-D, FROC-μ, CTRW-D, and CTRW-α (Table 3).
The ability of the DWI-derived parameters and their combinations (DWI models) to detect SF is shown in Figure 4. The combined CTRW-derived parameters resulted in the highest AUC (0.747). The DWI models’ diagnostic performance was superior to that of the DWI-derived parameters, with no differences among the DWI models (0.253 ≤ P ≤ 0.949).

Early detection and precise staging of liver fibrosis are very important for early diagnosis and prompt initiation of appropriate therapeutic regimens[4]. Reliable noninvasive staging methods for liver fibrosis are urgently needed. DWI is available on most MRI scanners and requires no additional hardware. It is also a simple and relatively fast scanning method[18]. This study compared six diffusion models that contain 14 quantitative parameters for liver fibrosis staging. Our study found that D values derived from various DWI models, FROC-μ, and CTRW-α were significantly correlated with the fibrosis stages, demonstrating their potential as noninvasive assessment tools for liver fibrosis. Furthermore, the combined CTRW-derived parameters resulted in a better diagnostic performance than all other DWI models. Our findings suggested that: (1) All assessed DWI models were suitable for staging liver fibrosis; (2) the novel non-Gaussian CTRW model was more valuable than other models for fibrosis staging; and (3) similar diagnostic performance for distinguishing SF was noted in all DWI models.
The D values are a core parameter in all the assessed DWI models. These might have different names in the various DWI models, but they all probe the tissue molecular diffusion properties under Gaussian or non-Gaussian diffusion behavior. They all showed a significant negative correlation with the fibrosis stage, as previously reported[6,8,13,19,20]. This is possibly because the diffusion of water molecules is restricted due to the increased deposition of the extracellular matrix and the aggravation of liver fibrosis. All these D values contributed to the diagnostic performance of the models in distinguishing SF.
As a novel DWI model, the CTRW model recognizes time and space intravoxel diffusion heterogeneity. These diffusion heterogeneities can directly reflect intravoxel structural heterogeneity, which is related to tissue complexity and microenvironment heterogeneity[21]. As liver fibrosis develops, depositions in the extracellular matrix and changes in blood supply lead to increased microstructural complexity[22]. These changes provide a basis for liver fibrosis staging. To our knowledge, few studies used the CTRW model to stage the liver fibrosis. However, several studies showed the usefulness of the CTRW model in distinguishing low- from high-grade brain tumors[21,23]. In our study, the CTRW-D and CTRW-α parameters derived from the CTRW model showed significant negative correlations with the fibrosis stage. The CTRW-α value is a specific parameter of the CTRW model. It represents the temporal heterogeneity arising from the underlying tissue structural heterogeneity. Another CTRW-specific parameter is CTRW-β, but its correlation with the fibrosis stages was insignificant. The lack of significance could be due to: (1) A sample size too small to detect an association; and (2) uneven distribution of the patients among the fibrosis stages. A more precise relationship awaits our future analysis.
Although the AUC of the combined CTRW models was the largest among the six DWI models, the models showed similar diagnostic performances in distinguishing SF when assessed by the DeLong test. This finding differed from some previous studies. Xie et al[24] compared the DKI and conventional Mono-DWI models in staging liver fibrosis, suggesting that DKI performed better than the conventional Mono-DWI model. Ren et al[25] evaluated the clinical value of multi-model DWI for liver fibrosis assessment. They concluded that the IVIM-D* value obtained from the bi-exponential model and SEM-DDC obtained from the SEM model performed better than other parameters in evaluating the degree of liver fibrosis. Park et al[26] compared the SEM model to other DWI models and found that SEM-DDC from the SEM model was the most accurate DWI parameter for liver fibrosis staging. Nevertheless, some studies reported results consistent with ours. Yang et al[22] assessed the DKI and conventional DWI models in staging liver fibrosis. They found that although the DKI model was feasible for predicting liver fibrosis, the DKI-derived parameters offered similar diagnostic performance to the Mono-ADC values. Sheng et al[14] found no differences between the FROC-derived parameters and Mono-ADC in staging liver fibrosis. The different results could be due to differences in the choice of the b-value distributions, scanners, field intensities, diffusion gradients, and more[27-31]. These aspects can impact the certainty and reproducibility of the outcomes. Clear specifications for standardizing any of the DWI models are still lacking. Their absence is the biggest obstacle to the DWI models’ clinical application.
Some researchers proposed using normalized ADC (nADC) to improve the reproducibility and performance of DWI in liver fibrosis staging. For instance, Zhu et al[32] reported that nADC provided better reproducibility and improved diagnostic accuracy for liver fibrosis detection than ADC. There were also some studies suggested that combining DWI-derived indices with other non-invasive tests could improve liver fibrosis diagnostic accuracy. For instance, Besheer et al[33] reported that the improved diagnostic efficacy when combining the ADC value with miRs for diagnosing and staging liver fibrosis in patients with chronic hepatitis D. This conclusion wasconfirmed in an earlier study by our group[34]. These findings point to a possible direction for future research.
Our research had several limitations. First, our sample was relatively small, and the patient distribution among the fibrosis stages was uneven. Second, we focused in this study on detecting SF, while other fibrosis stages were not evaluated. Further comparative evaluations should be made in a subsequent study. Third, we did not divide the patients based on the disease etiology. Fourth, liver fibrosis is a complex pathological process accompanied by steatosis, inflammation, and other changes. This study did not evaluate the effect of these factors.
Future work will need to assess a larger number of patients in each etiology. We should consider the impact of other factors for a better comparison between the DWI-derived parameters and the fibrosis stage. Standardization of data acquisition and postprocessing is imperative as it can help acquire more reliable diffusion MRI biomarkers. Broad clinical application of the DWI models in staging liver fibrosis is still premature, but the approach is worthy of further study.
Our study demonstrated the clinical potential of using the CTRW-DWI model in liver fibrosis staging. The combined diffusion parameters based on the various models were superior to each individual parameter in distinguishing SF, while the various combined DWI models showed similar diagnostic performance.
Liver fibrosis is a public health problem and closely associated with various prevalent causes of chronic liver damage. Early diagnosis and accurate staging of liver fibrosis are important in clinical practice. Non-invasive methods have been evaluated for diagnosing and staging liver fibrosis and have become the focus of clinical research. Diffusion-weighted imaging (DWI) represents the most widely used functional magnetic resonance imaging (MRI) sequence. Several DWI models are used in clinical practice. The quantitative information gathered from some of these models was used to detect and stage liver fibrosis.
Early liver fibrosis detection and staging are based on conventional DWI or early non-Gaussian diffusion models. The liver fibrosis staging performance and the ability to distinguish significant fibrosis (SF) of some novel DWI models were not fully clear.
In this prospective study, we investigated the value of the newest diffusion models in staging liver fibrosis and compare their performances in distinguishing SF.
This study enrolled 59 patients suspected of liver disease and scheduled for liver biopsy and 17 healthy participants without serious health problems from July 2021 to June 2022. All participants underwent multi-b value DWI and then calculated to various DWI models using an in-house software prototype developed by MR Station. The main DWI-derived parameters included Mono-apparent diffusion coefficient (ADC) from mono-exponential DWI, intravoxel incoherent motion model-derived true diffusion coefficient (IVIM-D), diffusion kurtosis imaging-derived apparent diffusivity, stretched exponential model-derived distributed diffusion coefficient (SEM-DDC), fractional order calculus (FROC) model-derived diffusion coefficient (FROC-D) and FROC model-derived microstructural quantity (FROC-μ), continuous-time random-walk (CTRW) model-derived anomalous diffusion coefficient (CTRW-D) and CTRW model-derived temporal diffusion heterogeneity index (CTRW-α). The correlations between DWI-derived parameters and fibrosis stages and the parameters’ diagnostic efficacy in detecting SF were assessed and compared.
In the current study, it was found that liver fibrosis stages differed significantly in Mono-ADC, IVIM-D, FROC-D, and CTRW-D. The fibrosis stages showed significant inverse correlations with Mono-ADC, IVIM-D, DKI-derived apparent diffusivity, SEM-DDC, FROC-D, FROC-μ, CTRW-D, and CTRW-α. The combined CTRW-derived parameters resulted in the highest areas under the ROC curve (0.747).
The CTRW-DWI model demonstrated the clinical potential in liver fibrosis staging. The combined diffusion parameters based on the various models were superior to each individual parameter in distinguishing SF.
As advanced DWI models, FROC and CTRW demonstrated their clinical potential in early detection of liver fibrosis. More patients and stratification of causes will help to generate more accurate results. Also, normalization of the DWI parameters will improve the effectiveness and power in future research.
The authors acknowledge the support of Siemens Healthineers, which provides research support to the Lanzhou University Second Hospital.
Provenance and peer review: Unsolicited article; Externally peer reviewed.
Peer-review model: Single blind
Corresponding Author's Membership in Professional Societies: Chinese Society of Radiology-Youth group.
Specialty type: Gastroenterology and hepatology
Country/Territory of origin: China
Peer-review report’s scientific quality classification
Grade A (Excellent): 0
Grade B (Very good): B
Grade C (Good): 0
Grade D (Fair): 0
Grade E (Poor): 0
P-Reviewer: El-Bendary M, Egypt S-Editor: Lin C L-Editor: A P-Editor: Yuan YY
| 1. | Marcellin P, Gane E, Buti M, Afdhal N, Sievert W, Jacobson IM, Washington MK, Germanidis G, Flaherty JF, Aguilar Schall R, Bornstein JD, Kitrinos KM, Subramanian GM, McHutchison JG, Heathcote EJ. Regression of cirrhosis during treatment with tenofovir disoproxil fumarate for chronic hepatitis B: a 5-year open-label follow-up study. Lancet. 2013;381:468-475. [RCA] [PubMed] [DOI] [Full Text] [Cited by in Crossref: 1228] [Cited by in RCA: 1368] [Article Influence: 114.0] [Reference Citation Analysis (0)] |
| 2. | Parola M, Pinzani M. Liver fibrosis: Pathophysiology, pathogenetic targets and clinical issues. Mol Aspects Med. 2019;65:37-55. [RCA] [PubMed] [DOI] [Full Text] [Cited by in Crossref: 286] [Cited by in RCA: 781] [Article Influence: 111.6] [Reference Citation Analysis (0)] |
| 3. | Chinese Society of Hepatology Chinese Medical Association; Chinese Society of Gastroenterology Chinese Medical Association; Chinese Society of Infectious Diseases, Chinese Medical Association. Consensus on the diagnosis and therapy of hepatic fibrosis in 2019. Zhonghua Ganzangbing Zazhi. 2019;27:657-667. [RCA] [DOI] [Full Text] [Cited by in Crossref: 7] [Cited by in RCA: 22] [Article Influence: 4.4] [Reference Citation Analysis (0)] |
| 4. | Li C, Li R, Zhang W. Progress in non-invasive detection of liver fibrosis. Cancer Biol Med. 2018;15:124-136. [RCA] [PubMed] [DOI] [Full Text] [Full Text (PDF)] [Cited by in Crossref: 44] [Cited by in RCA: 73] [Article Influence: 10.4] [Reference Citation Analysis (0)] |
| 5. | Bravo AA, Sheth SG, Chopra S. Liver biopsy. N Engl J Med. 2001;344:495-500. [RCA] [PubMed] [DOI] [Full Text] [Cited by in Crossref: 1843] [Cited by in RCA: 1736] [Article Influence: 72.3] [Reference Citation Analysis (0)] |
| 6. | Yoon JH, Lee JM, Baek JH, Shin CI, Kiefer B, Han JK, Choi BI. Evaluation of hepatic fibrosis using intravoxel incoherent motion in diffusion-weighted liver MRI. J Comput Assist Tomogr. 2014;38:110-116. [RCA] [PubMed] [DOI] [Full Text] [Cited by in Crossref: 70] [Cited by in RCA: 77] [Article Influence: 7.0] [Reference Citation Analysis (0)] |
| 7. | Taouli B, Tolia AJ, Losada M, Babb JS, Chan ES, Bannan MA, Tobias H. Diffusion-weighted MRI for quantification of liver fibrosis: preliminary experience. AJR Am J Roentgenol. 2007;189:799-806. [RCA] [PubMed] [DOI] [Full Text] [Cited by in Crossref: 275] [Cited by in RCA: 279] [Article Influence: 15.5] [Reference Citation Analysis (1)] |
| 8. | Taouli B, Chouli M, Martin AJ, Qayyum A, Coakley FV, Vilgrain V. Chronic hepatitis: role of diffusion-weighted imaging and diffusion tensor imaging for the diagnosis of liver fibrosis and inflammation. J Magn Reson Imaging. 2008;28:89-95. [RCA] [PubMed] [DOI] [Full Text] [Cited by in Crossref: 158] [Cited by in RCA: 171] [Article Influence: 10.1] [Reference Citation Analysis (0)] |
| 9. | Li T, Che-Nordin N, Wáng YXJ, Rong PF, Qiu SW, Zhang SW, Zhang P, Jiang YF, Chevallier O, Zhao F, Xiao XY, Wang W. Intravoxel incoherent motion derived liver perfusion/diffusion readouts can be reliable biomarker for the detection of viral hepatitis B induced liver fibrosis. Quant Imaging Med Surg. 2019;9:371-385. [RCA] [PubMed] [DOI] [Full Text] [Cited by in Crossref: 12] [Cited by in RCA: 25] [Article Influence: 4.2] [Reference Citation Analysis (0)] |
| 10. | Huang H, Che-Nordin N, Wang LF, Xiao BH, Chevallier O, Yun YX, Guo SW, Wáng YXJ. High performance of intravoxel incoherent motion diffusion MRI in detecting viral hepatitis-b induced liver fibrosis. Ann Transl Med. 2019;7:39. [RCA] [PubMed] [DOI] [Full Text] [Cited by in Crossref: 13] [Cited by in RCA: 25] [Article Influence: 4.2] [Reference Citation Analysis (0)] |
| 11. | Razek AAKA, Khashaba M, Abdalla A, Bayomy M, Barakat T. Apparent diffusion coefficient value of hepatic fibrosis and inflammation in children with chronic hepatitis. Radiol Med. 2014;119:903-909. [RCA] [PubMed] [DOI] [Full Text] [Cited by in Crossref: 43] [Cited by in RCA: 42] [Article Influence: 3.8] [Reference Citation Analysis (0)] |
| 12. | Yoshimaru D, Miyati T, Suzuki Y, Hamada Y, Mogi N, Funaki A, Tabata A, Masunaga A, Shimada M, Tobari M, Nishino T. Diffusion kurtosis imaging with the breath-hold technique for staging hepatic fibrosis: A preliminary study. Magn Reson Imaging. 2018;47:33-38. [RCA] [PubMed] [DOI] [Full Text] [Cited by in Crossref: 13] [Cited by in RCA: 20] [Article Influence: 2.5] [Reference Citation Analysis (0)] |
| 13. | Anderson SW, Barry B, Soto J, Ozonoff A, O'Brien M, Jara H. Characterizing non-gaussian, high b-value diffusion in liver fibrosis: Stretched exponential and diffusional kurtosis modeling. J Magn Reson Imaging. 2014;39:827-834. [RCA] [PubMed] [DOI] [Full Text] [Cited by in Crossref: 54] [Cited by in RCA: 55] [Article Influence: 4.6] [Reference Citation Analysis (0)] |
| 14. | Sheng R, Zhang Y, Sun W, Ji Y, Zeng M, Yao X, Dai Y. Staging Chronic Hepatitis B Related Liver Fibrosis with a Fractional Order Calculus Diffusion Model. Acad Radiol. 2022;29:951-963. [RCA] [PubMed] [DOI] [Full Text] [Cited by in Crossref: 2] [Cited by in RCA: 8] [Article Influence: 2.7] [Reference Citation Analysis (0)] |
| 15. | Sterling RK, Lissen E, Clumeck N, Sola R, Correa MC, Montaner J, S Sulkowski M, Torriani FJ, Dieterich DT, Thomas DL, Messinger D, Nelson M; APRICOT Clinical Investigators. Development of a simple noninvasive index to predict significant fibrosis in patients with HIV/HCV coinfection. Hepatology. 2006;43:1317-1325. [RCA] [PubMed] [DOI] [Full Text] [Cited by in Crossref: 2633] [Cited by in RCA: 3561] [Article Influence: 187.4] [Reference Citation Analysis (0)] |
| 16. | Desmet VJ, Gerber M, Hoofnagle JH, Manns M, Scheuer PJ. Classification of chronic hepatitis: diagnosis, grading and staging. Hepatology. 1994;19:1513-1520. [PubMed] |
| 17. | Kim HP, Idowu MO, Mospan AR, Allmon AG, Roden M, Newsome P, Lok AS, Thuluvath PJ, Taunk J, Fried MW, Sanyal AJ, Barritt AS 4th; TARGET-NASH Investigators. Liver biopsy in the real world-reporting, expert concordance and correlation with a pragmatic clinical diagnosis. Aliment Pharmacol Ther. 2021;54:1472-1480. [RCA] [PubMed] [DOI] [Full Text] [Cited by in Crossref: 17] [Cited by in RCA: 16] [Article Influence: 4.0] [Reference Citation Analysis (0)] |
| 18. | Petitclerc L, Gilbert G, Nguyen BN, Tang A. Liver Fibrosis Quantification by Magnetic Resonance Imaging. Top Magn Reson Imaging. 2017;26:229-241. [RCA] [PubMed] [DOI] [Full Text] [Full Text (PDF)] [Cited by in Crossref: 24] [Cited by in RCA: 41] [Article Influence: 5.9] [Reference Citation Analysis (0)] |
| 19. | Dyvorne HA, Jajamovich GH, Bane O, Fiel MI, Chou H, Schiano TD, Dieterich D, Babb JS, Friedman SL, Taouli B. Prospective comparison of magnetic resonance imaging to transient elastography and serum markers for liver fibrosis detection. Liver Int. 2016;36:659-666. [RCA] [PubMed] [DOI] [Full Text] [Cited by in Crossref: 46] [Cited by in RCA: 52] [Article Influence: 5.8] [Reference Citation Analysis (0)] |
| 20. | Fu F, Li X, Liu Q, Chen C, Bai Y, Shi D, Sang J, Wang K, Wang M. Noninvasive DW-MRI metrics for staging hepatic fibrosis and grading inflammatory activity in patients with chronic hepatitis B. Abdom Radiol (NY). 2021;46:1864-1875. [RCA] [PubMed] [DOI] [Full Text] [Cited by in Crossref: 4] [Cited by in RCA: 4] [Article Influence: 1.0] [Reference Citation Analysis (0)] |
| 21. | Karaman MM, Sui Y, Wang H, Magin RL, Li Y, Zhou XJ. Differentiating low- and high-grade pediatric brain tumors using a continuous-time random-walk diffusion model at high b-values. Magn Reson Med. 2016;76:1149-1157. [RCA] [PubMed] [DOI] [Full Text] [Cited by in Crossref: 33] [Cited by in RCA: 59] [Article Influence: 5.9] [Reference Citation Analysis (0)] |
| 22. | Yang L, Rao S, Wang W, Chen C, Ding Y, Yang C, Grimm R, Yan X, Fu C, Zeng M. Staging liver fibrosis with DWI: is there an added value for diffusion kurtosis imaging? Eur Radiol. 2018;28:3041-3049. [RCA] [PubMed] [DOI] [Full Text] [Cited by in Crossref: 32] [Cited by in RCA: 41] [Article Influence: 5.9] [Reference Citation Analysis (0)] |
| 23. | Karaman MM, Zhang J, Xie KL, Zhu W, Zhou XJ. Quartile histogram assessment of glioma malignancy using high b-value diffusion MRI with a continuous-time random-walk model. NMR Biomed. 2021;34:e4485. [RCA] [PubMed] [DOI] [Full Text] [Cited by in Crossref: 6] [Cited by in RCA: 3] [Article Influence: 0.8] [Reference Citation Analysis (0)] |
| 24. | Xie S, Li Q, Cheng Y, Zhou L, Xia S, Li J, Shen W. Differentiating mild and substantial hepatic fibrosis from healthy controls: a comparison of diffusion kurtosis imaging and conventional diffusion-weighted imaging. Acta Radiol. 2020;61:1012-1020. [RCA] [PubMed] [DOI] [Full Text] [Cited by in Crossref: 2] [Cited by in RCA: 5] [Article Influence: 1.0] [Reference Citation Analysis (0)] |
| 25. | Ren H, Liu Y, Lu J, An W, Wang W, Yan T, Li Y, Dong J, Cai J. Evaluating the clinical value of MRI multi-model diffusion-weighted imaging on liver fibrosis in chronic hepatitis B patients. Abdom Radiol (NY). 2021;46:1552-1561. [RCA] [PubMed] [DOI] [Full Text] [Cited by in Crossref: 3] [Cited by in RCA: 3] [Article Influence: 0.8] [Reference Citation Analysis (0)] |
| 26. | Park JH, Seo N, Chung YE, Kim SU, Park YN, Choi JY, Park MS, Kim MJ. Noninvasive evaluation of liver fibrosis: comparison of the stretched exponential diffusion-weighted model to other diffusion-weighted MRI models and transient elastography. Eur Radiol. 2021;31:4813-4823. [RCA] [PubMed] [DOI] [Full Text] [Cited by in Crossref: 10] [Cited by in RCA: 7] [Article Influence: 1.8] [Reference Citation Analysis (0)] |
| 27. | Rosenkrantz AB, Oei M, Babb JS, Niver BE, Taouli B. Diffusion-weighted imaging of the abdomen at 3.0 Tesla: image quality and apparent diffusion coefficient reproducibility compared with 1.5 Tesla. J Magn Reson Imaging. 2011;33:128-135. [RCA] [PubMed] [DOI] [Full Text] [Cited by in Crossref: 162] [Cited by in RCA: 185] [Article Influence: 13.2] [Reference Citation Analysis (0)] |
| 28. | Donati OF, Chong D, Nanz D, Boss A, Froehlich JM, Andres E, Seifert B, Thoeny HC. Diffusion-weighted MR imaging of upper abdominal organs: field strength and intervendor variability of apparent diffusion coefficients. Radiology. 2014;270:454-463. [RCA] [PubMed] [DOI] [Full Text] [Cited by in Crossref: 105] [Cited by in RCA: 122] [Article Influence: 10.2] [Reference Citation Analysis (0)] |
| 29. | Dyvorne HA, Galea N, Nevers T, Fiel MI, Carpenter D, Wong E, Orton M, de Oliveira A, Feiweier T, Vachon ML, Babb JS, Taouli B. Diffusion-weighted imaging of the liver with multiple b values: effect of diffusion gradient polarity and breathing acquisition on image quality and intravoxel incoherent motion parameters--a pilot study. Radiology. 2013;266:920-929. [RCA] [PubMed] [DOI] [Full Text] [Cited by in Crossref: 144] [Cited by in RCA: 157] [Article Influence: 12.1] [Reference Citation Analysis (0)] |
| 30. | Dyvorne H, Jajamovich G, Kakite S, Kuehn B, Taouli B. Intravoxel incoherent motion diffusion imaging of the liver: optimal b-value subsampling and impact on parameter precision and reproducibility. Eur J Radiol. 2014;83:2109-2113. [RCA] [PubMed] [DOI] [Full Text] [Cited by in Crossref: 58] [Cited by in RCA: 67] [Article Influence: 6.1] [Reference Citation Analysis (0)] |
| 31. | Wang YXJ, Huang H, Zheng CJ, Xiao BH, Chevallier O, Wang W. Diffusion-weighted MRI of the liver: challenges and some solutions for the quantification of apparent diffusion coefficient and intravoxel incoherent motion. Am J Nucl Med Mol Imaging. 2021;11:107-142. [PubMed] |
| 32. | Zhu J, Zhang J, Gao JY, Li JN, Yang DW, Chen M, Zhou C, Yang ZH. Apparent diffusion coefficient normalization of normal liver: Will it improve the reproducibility of diffusion-weighted imaging at different MR scanners as a new biomarker? Medicine (Baltimore). 2017;96:e5910. [RCA] [PubMed] [DOI] [Full Text] [Full Text (PDF)] [Cited by in Crossref: 12] [Cited by in RCA: 21] [Article Influence: 2.6] [Reference Citation Analysis (0)] |
| 33. | Besheer T, Elalfy H, Abd El-Maksoud M, Abd El-Razek A, Taman S, Zalata K, Elkashef W, Zaghloul H, Elshahawy H, Raafat D, Elemshaty W, Elsayed E, El-Gilany AH, El-Bendary M. Diffusion-weighted magnetic resonance imaging and micro-RNA in the diagnosis of hepatic fibrosis in chronic hepatitis C virus. World J Gastroenterol. 2019;25:1366-1377. [RCA] [PubMed] [DOI] [Full Text] [Full Text (PDF)] [Cited by in CrossRef: 29] [Cited by in RCA: 26] [Article Influence: 4.3] [Reference Citation Analysis (0)] |
| 34. | Jiang Y, Fan F, Zhang P, Wang J, Huang W, Zheng Y, Guo R, Wang S, Zhang J. Staging liver fibrosis by a continuous-time random-walk diffusion model. Magn Reson Imaging. 2024;105:100-107. [RCA] [PubMed] [DOI] [Full Text] [Reference Citation Analysis (0)] |