Copyright
©The Author(s) 2022.
World J Gastroenterol. Dec 14, 2022; 28(46): 6512-6521
Published online Dec 14, 2022. doi: 10.3748/wjg.v28.i46.6512
Published online Dec 14, 2022. doi: 10.3748/wjg.v28.i46.6512
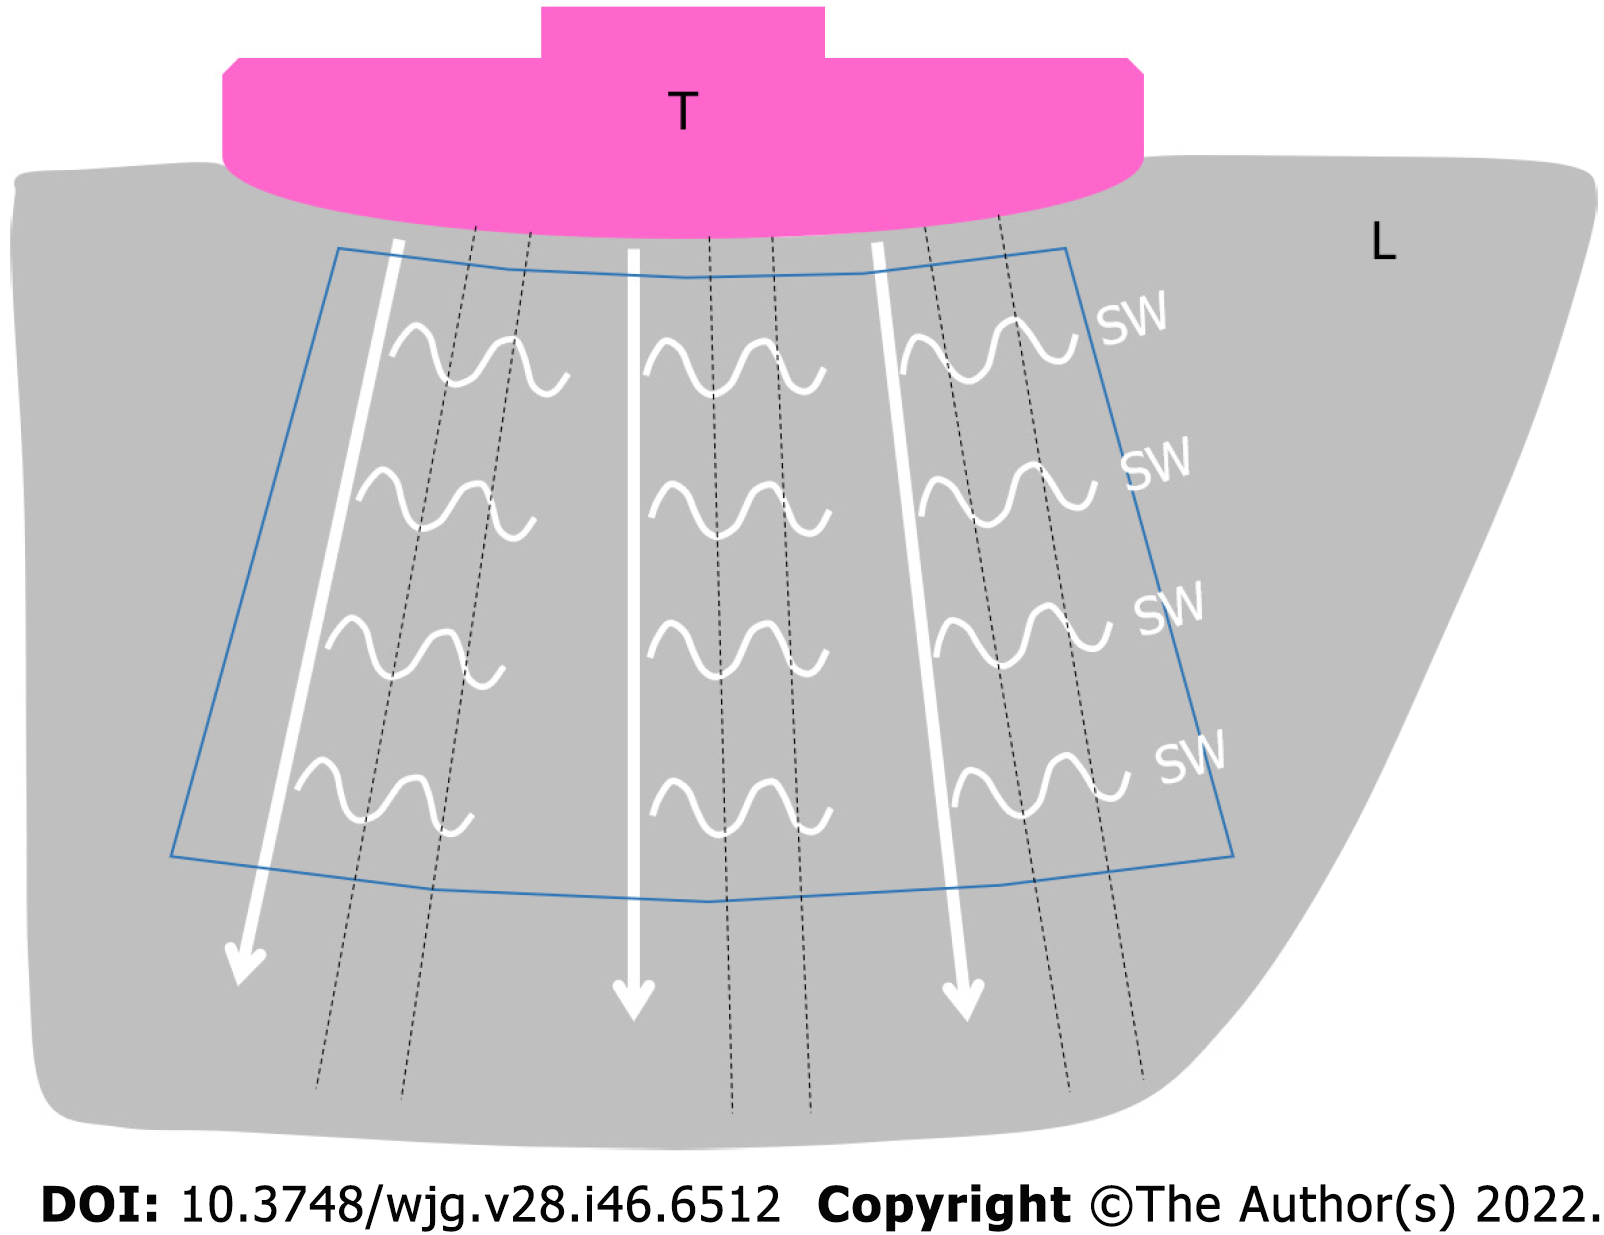
Figure 1 Schematic illustration of two-dimensional shear wave elastography (commonly referred to as two-dimensional shear wave elastography) in a healthy subject.
Multiple push-pulses (white arrow lines) radiate from the transducer to create shear waves (small wavy lines). The shear wave movements are tracked by the regular interval tracking conventional ultrasound pulses (black dotted lines). T: Transducer; L: Liver; SW: Shear wave. White arrow line: Push-pulse; Black dotted line: Tracking pulse; Blue line enclosure: Region of interest.
- Citation: Naganuma H, Ishida H. Factors other than fibrosis that increase measured shear wave velocity. World J Gastroenterol 2022; 28(46): 6512-6521
- URL: https://www.wjgnet.com/1007-9327/full/v28/i46/6512.htm
- DOI: https://dx.doi.org/10.3748/wjg.v28.i46.6512


