Published online Dec 14, 2022. doi: 10.3748/wjg.v28.i46.6551
Peer-review started: June 30, 2022
First decision: July 13, 2022
Revised: July 27, 2022
Accepted: November 21, 2022
Article in press: November 21, 2022
Published online: December 14, 2022
Processing time: 161 Days and 2.4 Hours
Liver disease indicates any pathology that can harm or destroy the liver or prevent it from normal functioning. The global community has recently witnessed an increase in the mortality rate due to liver disease. This could be attributed to many factors, among which are human habits, awareness issues, poor healthcare, and late detection. To curb the growing threats from liver disease, early detection is critical to help reduce the risks and improve treatment outcome. Emerging technologies such as machine learning, as shown in this study, could be deployed to assist in enhancing its prediction and treatment.
To present a more efficient system for timely prediction of liver disease using a hybrid eXtreme Gradient Boosting model with hyperparameter tuning with a view to assist in early detection, diagnosis, and reduction of risks and mortality associated with the disease.
The dataset used in this study consisted of 416 people with liver problems and 167 with no such history. The data were collected from the state of Andhra Pradesh, India, through https://www.kaggle.com/datasets/uciml/indian-liver-patient-records. The population was divided into two sets depending on the disease state of the patient. This binary information was recorded in the attribute "is_patient".
The results indicated that the chi-square automated interaction detection and classification and regression trees models achieved an accuracy level of 71.36% and 73.24%, respectively, which was much better than the conventional method. The proposed solution would assist patients and physicians in tackling the problem of liver disease and ensuring that cases are detected early to prevent it from developing into cirrhosis (scarring) and to enhance the survival of patients. The study showed the potential of machine learning in health care, especially as it concerns disease prediction and monitoring.
This study contributed to the knowledge of machine learning application to health and to the efforts toward combating the problem of liver disease. However, relevant authorities have to invest more into machine learning research and other health technologies to maximize their potential.
Core Tip: This article proposed the hybrid eXtreme Gradient Boosting model for prediction of liver disease. This model was designed by optimizing the hyperparameter tuning with the help of Bayesian optimization. The classification and regression trees and chi-square automated interaction detection models on their own are not accurate in predicting liver disease among Indian patients. The proposed model utilized different physical health status, i.e. level of bilirubin, direct bilirubin, alkaline phosphatase, alanine aminotransferase, aspartate aminotransferase, total proteins, albumin, and globulin in prediction of the liver disease. This work was aimed at designing a more accurate machine learning model in liver disease prediction.
- Citation: Dalal S, Onyema EM, Malik A. Hybrid XGBoost model with hyperparameter tuning for prediction of liver disease with better accuracy. World J Gastroenterol 2022; 28(46): 6551-6563
- URL: https://www.wjgnet.com/1007-9327/full/v28/i46/6551.htm
- DOI: https://dx.doi.org/10.3748/wjg.v28.i46.6551
The liver processes blood from the digestive tract. It is located on the right side of the abdomen, directly below the rib cage. The liver plays a critical role in the digestion of food and the elimination of toxins from the body. It is possible that liver illness is passed down via families (genetic). Viruses, alcohol, and obesity are all known to harm the liver, which can result in liver disease. Conditions that affect the liver can lead to scarring (cirrhosis), which can eventually lead to liver failure, a life-threatening condition[1]. The liver may be able to recover if therapy is started early enough.
One or more tests are recommended to correctly identify and determine the cause of liver illness. These may include: (1) Blood tests. Human blood is tested for the presence of liver enzymes. In addition, a blood-clotting test known as the international normalized ratio is used to measure liver function. Problems with liver function may be the cause of elevated levels[2]; (2) Imaging tests. Ultrasound, magnetic resonance imaging, and computed tomography scans can be used to examine a patient’s liver for damage, scarring, or malignancies. FibroScan ultrasound can be used to measure scarring and fat accumulation in the liver, among other things; and (3) Liver biopsy. Small amounts of tissue are removed from the liver with the use of an ultrathin needle during the biopsy procedure. The tissue is examined for any indications of liver illness. The heart, lungs, stomach, skin, brain, cognitive function, and other elements of the nervous system can all be affected by liver disease. For a physical examination, the complete body may be examined. Blood tests can be used to determine the extent of liver inflammation and how well the organ is functioning[3].
There are several causes of liver disease. Cirrhosis can be caused by alcohol misuse. Nonalcoholic fatty liver disease and chronic hepatitis B and C are other possible causes. Having too much fat in the liver is known as nonalcoholic fatty liver disease. The liver may become inflamed as a result of the excess fat. Nonalcoholic steatohepatitis is a kind of nonalcoholic fatty liver disease that affects the liver. The liver is inflamed and damaged as well as full of fat. Other issues may be drug overdoses. Acetaminophen and other drugs might damage the liver if the patient uses them in large doses. Acetaminophen may appear in several medications the patient takes. Therefore, attention to the dosage directions on the label should be given. There is a risk of cirrhosis and liver scarring as a result of this medication[4].
Dire complications of liver disease include acute liver failure when the patient does not have a long-term liver illness, but the liver shuts down in a matter of days or weeks. Acetaminophen overdosage, infection, or prescription medicine usage can be the cause for this. Another type is hepatic cirrhosis, which is the accumulation of scar tissue[5]. The more healthy liver tissue that is lost to scarring, the more difficult it is for the liver to function. It may not function as well as it should in the long run.
The so-called liver blood tests are generally a good indicator of liver damage as they show anomalies (e.g., alanine aminotransferase, aspartate aminotransferase, and alkaline phosphatase)[6]. It is common to refer to the liver blood tests as "liver function tests". This does not mean that liver dysfunction is the cause of all abnormalities in the blood tests, such as high bilirubin, lower-than-normal levels of albumin, and a prolonged prothrombin time. In addition, abnormalities in other liver blood tests may be indicative of liver damage. Hepatitis viruses, for example, may boost the levels of the alanine aminotransferase and aspartate aminotransferase enzymes in the blood, causing them to leak into the circulation[7].
This article aimed to fulfil various objectives. The first objective of this article was to identify the symptoms of liver disease and its impact on the patient’s body. Then, it presented various machine learning approaches for predicting liver disease and evaluated the performance of decision-tree algorithms in the prediction of liver disease. Next, the article proposed a modified XGBoost model with a hyperparameter tuning mechanism. Finally, it validated the performance of the proposed model by comparing it with more traditional decision tree–based models.
There is a constant increase in the population encountering liver-related diseases due to an unhealthy breathing environment, excessive alcohol intake, contaminated elements in the diet, improper use of over the counter drugs, etc[8] (Table 1).
| No. | Attribute | Information | Type |
| 1 | Age | How old is the patient? | Integer |
| 2 | Sex | Patient’s sex | String (male/female) |
| 3 | Tot_bilirbn | Level of bilirubin compound | Floating |
| 4 | Direct_bilirbn | Level of direct bilirubin compound | Floating |
| 5 | Alk_phos | Level of alkaline phosphatase compound | Floating |
| 6 | Al_amntrfrs | Level of alanine aminotransferase compound | Floating |
| 7 | As_amntrfrs | Level of aspartate aminotransferase compound | Floating |
| 8 | Total_prot | Level of total protein in the sample | Floating |
| 9 | Albmn | Level of albumin in the sample | Floating |
| 10 | Ag_ratio | Ratio of compound albumin to globulin | Floating |
| 11 | Is_patient | Categorizes the dataset into parts | Categorical |
Table 1 depicts the description of the dataset used for the experimental purpose. The dataset used in this study constituted 416 people with liver problems and 167 with no such history, which was collected from the state of Andhra Pradesh, India[9]. The dataset population was divided into two sets depending on the disease status of the patient. This binary information was recorded in the attribute "is_patient". The aim was to correctly predict the value of this field so that the task can be automated and simplified for medical personnel. The dataset contained records for both male and female patients[10].
Data preparation is the most critical step before running various machine learning models. Machine learning does not perform as expected when datasets are not handled properly[11]. It is possible that the performance of a machine learning model during training and testing will diverge. Data errors, noise, and omissions can all contribute to this[12]. Prior to comparing data, preprocessing removes any duplicates, anomalies, and other inconsistencies. This ensures that the findings are more accurate[13].
Mean/median or mode are used to fill in the blanks in the dataset, depending on the type of data that are missing[14]: (1) Numerical data. Whenever a number is omitted, a mean or median value should be used instead. The outliers and skewness contained in the data pull the mean and median values in their respective directions, hence it is preferable to impute using the median value[15]; and (2) Categorical data. When categorical data are lacking, use the value that occurs the most frequently, i.e. by mode to fill in the blanks[16]. To manage the missing data, research can utilize three methods: (1) Delete rows with missing values[17]; (2) Impute missing values[18]; and (3) Predict the missing values[19]. In this work, the missing values were imputed for better performance of the machine learning models.
BoxPlot was used to identify outliers in a dataset. The outliers may be dealt with by limiting or transforming the data[20]. This can be done in two ways: (1) Capping the data. There are three ways to set data cap limitations[21]; and (2) Z-score approach. Outliers are any values that go outside of the normal range by a factor of 3 or more[22].
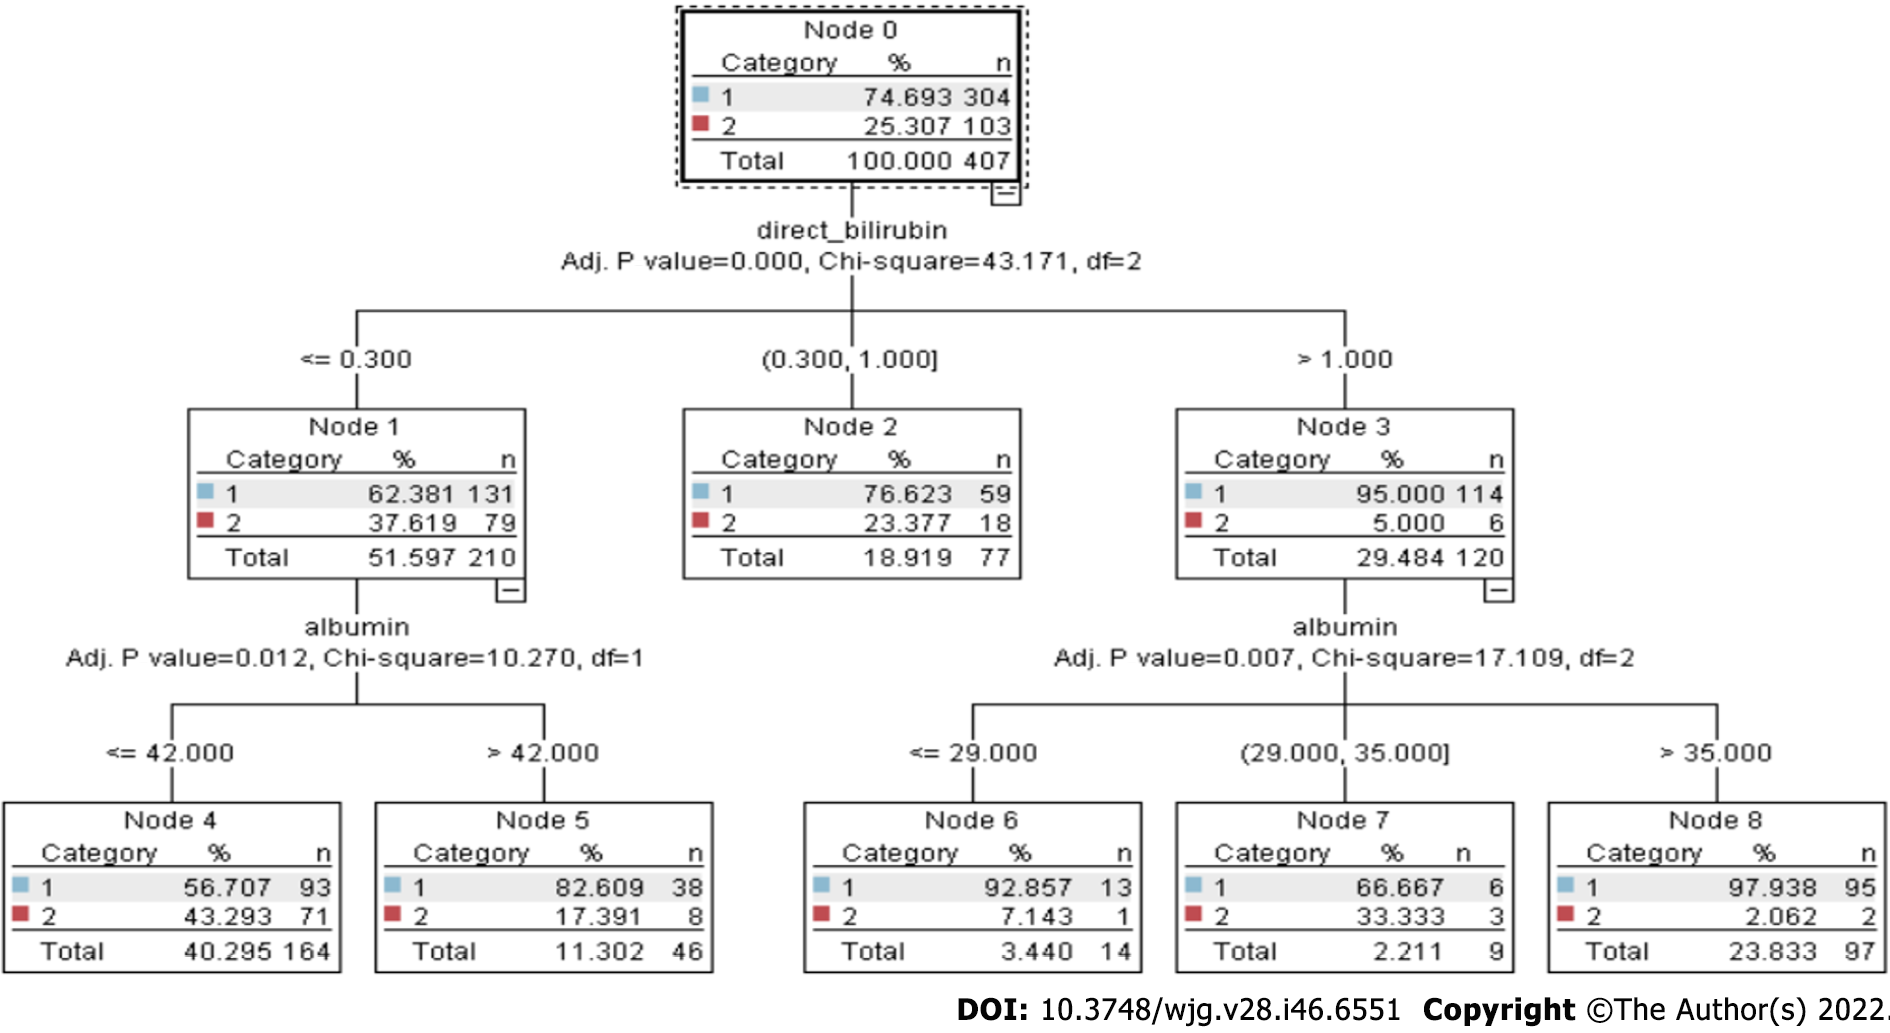
Decision trees have existed for a long time, and chi-square automated interaction detection (CHAID) is the oldest one. The χ2test is used to determine the relevance of a feature[23]. The greater the statistical significance, the greater the value. CHAID uses decision trees to solve categorization issues. This implies that a category target variable is expected in the datasets[24]. Although ID3, C4.5, and classification and regression trees (CART) all employ information gain, CHAID uses χ2 testing to determine which characteristic is the most prominent. Karl Pearson introduced χ2 testing because of its high accuracy, stability, and simplicity of interpretation. Tree-based learning algorithms are among the finest and most extensively used supervised learning methods[25]. The χ2 statistic is used in the CHAID decision tree technique to determine the independent variable with the biggest χ2 value for the dependent variable[26]. The manifestations of the dependent variable that has the most impact on the dependent variable become the new dependent variable[27]. The individual node in Figure 1 consists of category (0 or 1), % (accuracy level), and n (number of patients)[28].
Figure 1 demonstrates that the CHAID tree consists of multiple decision nodes (node 0 to node 8). The branch of the decision tree is leveled by three parameters (adjusted P value, χ2, and df). These parameters play a very important role in decision making.
In the study presented here, the compound ‘direct bilirubin’ was adjudged as the most significant factor by the CHAID test, as shown in Figure 1, splitting the tree into three subtrees depending on the quantity of bilirubin found. It also showed the adjusted P values and χ2 value calculated at each level marking the significant difference between the corresponding subcategories. Further, on the next level, the tree splits on the basis of next important factor, ‘alkaline phosphate,’ for the category represented by node 1, i.e. people with value ≤ 0.9 for compound direct bilirubin, and ‘age’ for node 2, which represents the direct bilirubin range of 0.9 to 4.1. The maximum height of the tree allowed is up to level 5 as the further splits do not significantly affect the result of the model. The significance value kept for splitting the records is 0.05, using Pearson’s likelihood ratio for χ2 and Bonferroni method for autoadjusting the significance value and actual P values. The threshold value for stopping the growth of tree is a minimum 2% records in the parent branch and 1% record in the child branch[29].
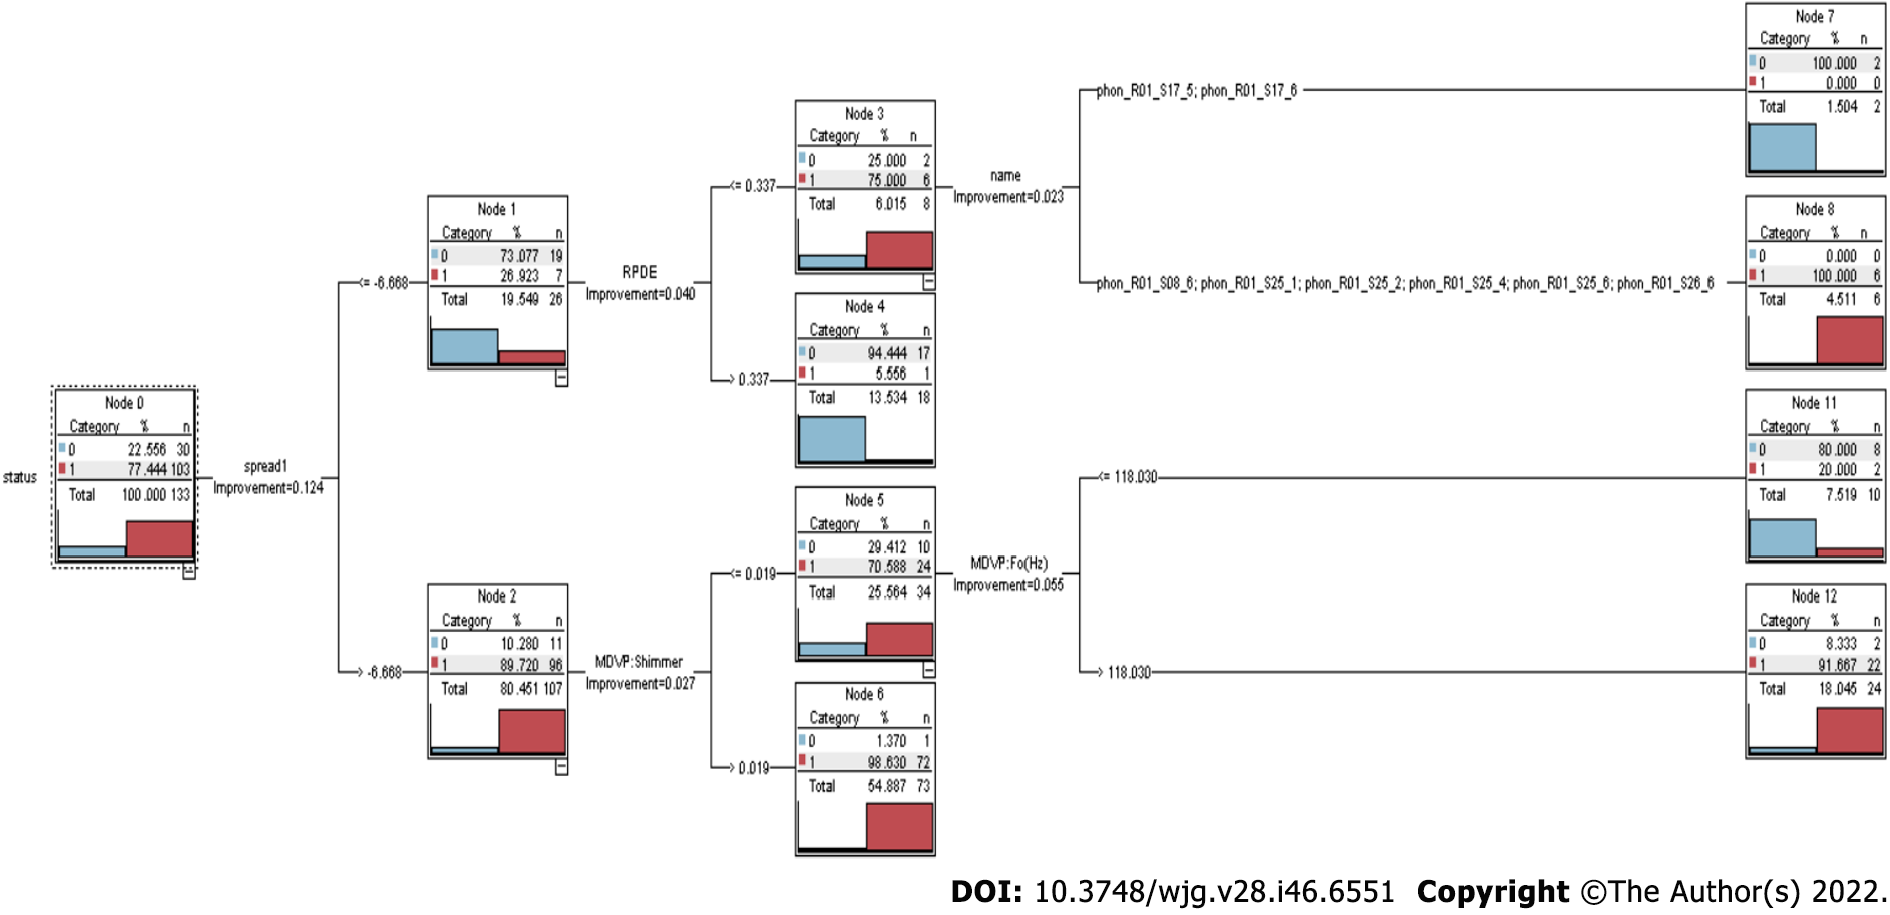
The CART algorithm uses several different ways to divide or segment data into smaller subsets depending on the different values and combinations of predictors that are available. Splits are selected, and the procedure is repeated until the finest possible collection is discovered[30]. Binary splits lead to terminal nodes that may be characterized by a collection of rules, resulting in a decision tree. To benefit from the tree’s visual appeal and an easy-to-understand layout, one does not have to be an expert data scientist[31] (Figure 2).
Figure 2 demonstrates that the CART algorithm consists of multiple decision nodes (node 0 to node 12). The CART approach can quickly uncover crucial associations that might otherwise go unnoticed when utilizing other analytical methods.
In this study, CART produced the binary tree classification for continuous variables and exhibited different sequences by adjudging compound total bilirubin as the least impure predictor[32]. The split-up value for total bilirubin was calculated to be 1.650 by the CART model at the first level, using the Gini impurity index method, with a gain of 0.047. Subsequently, the other important predictors were ‘aspartate aminotransferase,’ ‘direct bilirubin,’ and ‘age’ of the subjects, according to this model. The compound ‘total bilirubin’ was used at multiple levels for the split, which means that this compound produced maximum gain in the Gini index at multiple levels. The minimum value for recording change in impurity and making a split was set to ‘0.0001’ after a series of run to maximize the efficiency of the model[33]. The maximum number of levels allowed here was ‘5’ in the CART tree with the same criteria for stopping the growth, as used in the CHAID model[34].
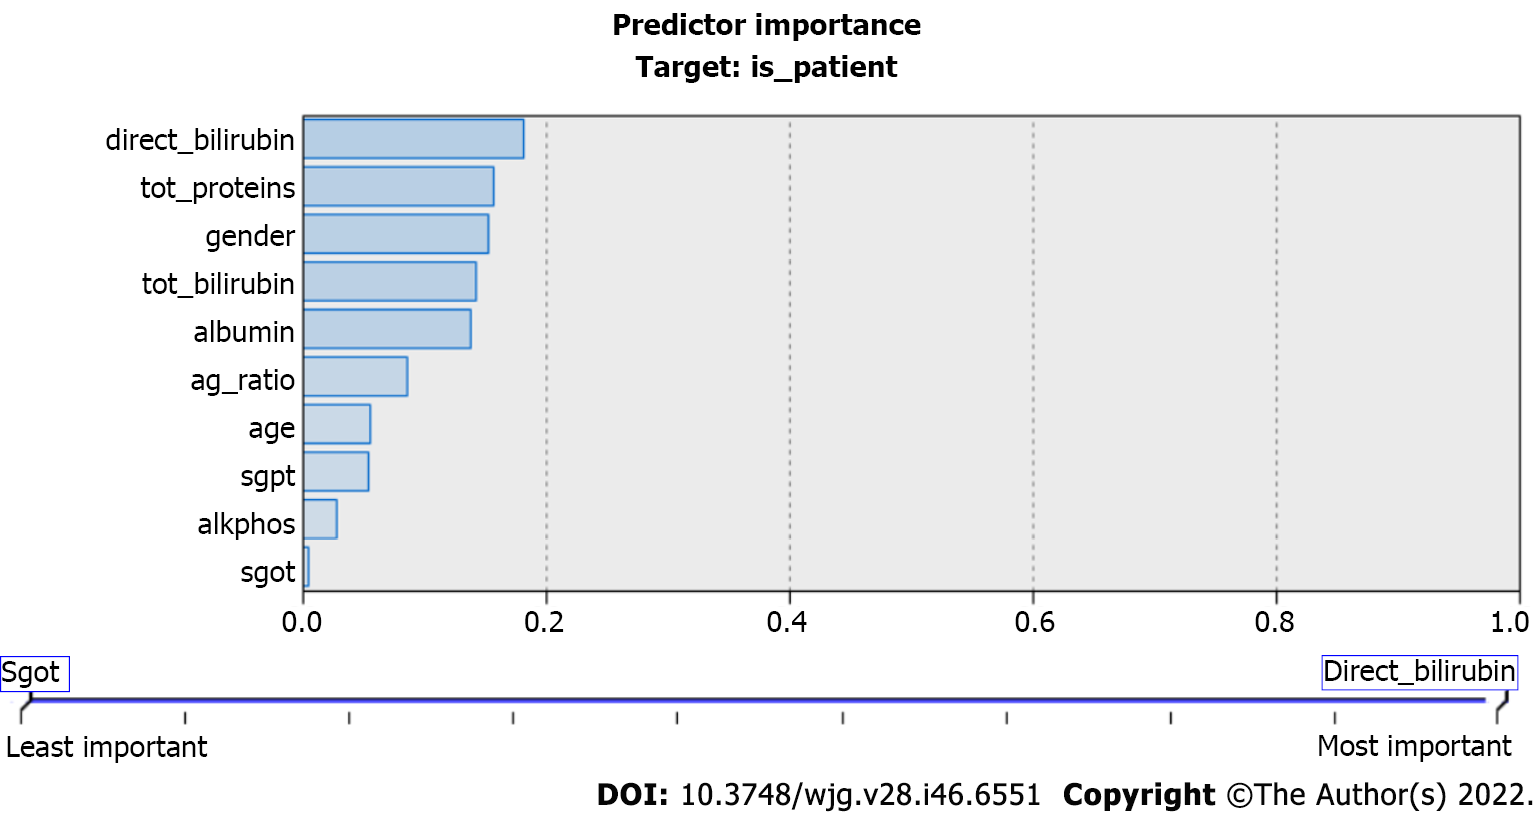
Figure 3 highlights the importance of predicators used in the CART model. They play important roles in liver disease prediction. CART is an innovative but highly desirable technique that incorporates automation, ease of use, performance, and accuracy, which sets it apart in the predictive analytics sector[35].
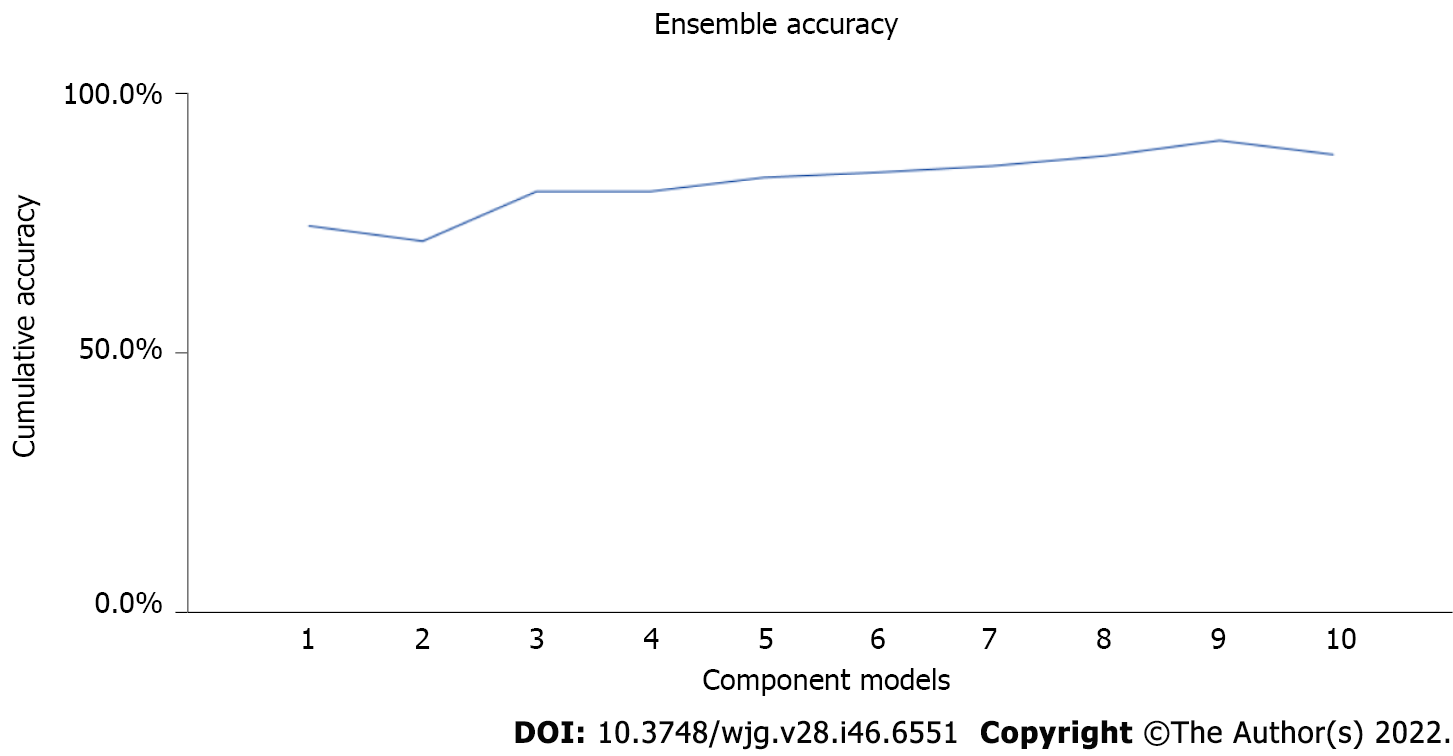
The ensemble learning is used in techniques, such as boosting, for repeatedly training the model on different random samples of the dataset. Ensemble methods used in various advanced learning techniques, such as CART and XGBoost decision tees, also uses this approach to minimize the error and improve the accuracy[36]. The accuracy level of the decision tree may be enhanced by using the ensemble approach (Figure 4).
Figure 4 visually depicts ensemble accuracy that is improved gradually with each iteration. The ensemble approach increases the accuracy level of the decision tree models. If there is patient data, then a tree-like graph to model the choices can be used, and they can be continuous or categorical. As the patient answers each question, they will get a forecast of the data[37].
XGBoost is a collection of open-source functions and steps that uses supervised machine learning to estimate or predict a result. The result may be predicted using several decision trees in the XGBoost library. Batch learning is used to train the machine learning system, and then a model-based technique is used to generalize the results. Models for the link between predictor and outcome variables are constructed using all available data. These models are then generalized to the test data. In the context of computing, the term “extreme” implies its desire to push the boundaries of processing power. The concept of "gradient boosting", used to improve the performance of weak prediction models, is used in machine learning applications such as regression and classification[38].
Because it can only predict the outcome variable slightly better than chance, a single decision tree is regarded as a weak or basic learner. Strong learners, on the other hand, are any algorithms that can be fine-tuned to attain maximum performance in supervised learning. To build a powerful learner, XGBoost uses decision trees as its foundation learners. If you use many models (trees), the final prediction is called an ensemble learning approach as it incorporates the results of multiple models (trees)[39].
When a group of weak learners is combined to make a strong learner, it is called "boosting". Each weak prediction is weighted according to how well the weak learner performed, and XGBoost will repeatedly create a collection of poor models on subsets of the data. The weighted total of all base learners is used to make a prediction[40].
Although all the other features are used as predictors of the target variable yi in the training data, the target variable is provided. Decision trees are used to predict the values of yi based on xi using a set of trees. It would be difficult to predict the result variable with just one decision tree. Analysts may be able to generate more accurate predictions of yi if the decision trees are used collectively[41].
The learning process of an algorithm is governed by hyperparameters, which are specific values or weights. XGBoost, as previously mentioned, offers a wide range of hyperparameters. They may be fine-tuned to reach the highest level of accuracy possible. Auto-tuning of numerous learnable parameters allows for the XGBoost to recognize patterns and regularities in the datasets it analyzes. The learnable parameters in tree-based models like XGBoost are the decision variables at each node. A sophisticated algorithm like XGBoost has a lot of design choices and hence a lot of hyperparameters[42].
The main challenge faced in this stage is the optimized selection of parameters among multiple hyperparameters. It may be managed by efficient hyperparameter tuning. In this article, the Bayesian optimization was applied in the following four steps: (1) Initialize domain space for a range of values. Initially, the domain space is finalized considering the input values over what it is being searched. The input variables are max_depth, gamma, reg_alpha, reg_lambda, colsample_bytree, min_child_weight, and n_estimators; (2) Define objective function. In this step, the objective function is defined, which can be any function that returns a real number that must decrease in order to achieve the desired goal. The validation error of XGBoost with respect to hyperparameters should be minimized in this situation. To optimize accuracy, the other key value must be considered. It should return a value that is the opposite of the metric value; (3) Apply optimization algorithm. It is the method used to construct the surrogate objective function and choose the next values to evaluate. In this stage, the concept of Bayesian optimization in the tuning phase is used. The Bayesian optimization method is based on the Bayes theorem and provides an efficient and effective method for solving a global optimization issue. The real objective function is then used to evaluate the candidate samples; and (4) Obtain results. Results are scored by value pairs that the algorithm uses to build the XGBoost model.
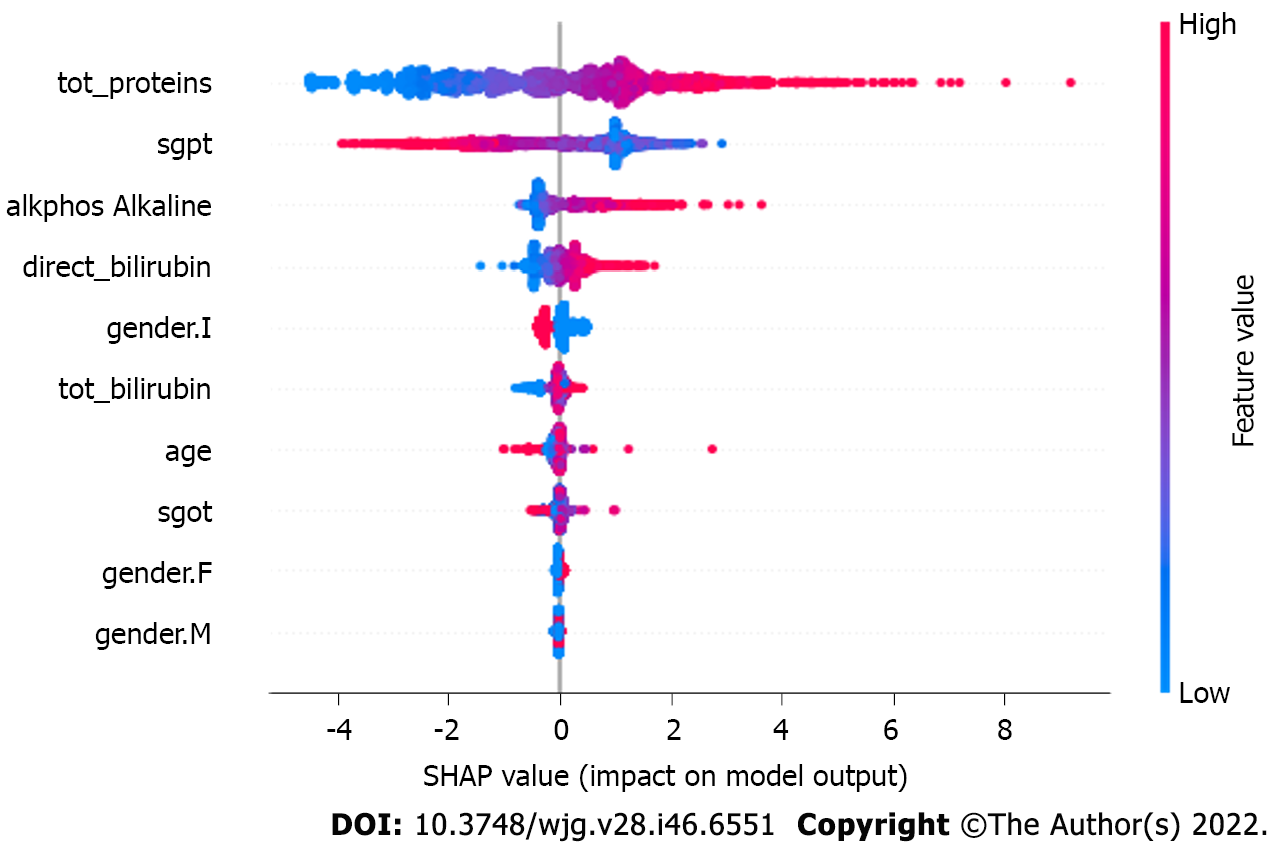
For the XGBoost model, the objective function optimization is performed using the logistic model, as the target is a categorical variable. The tree building model used is ‘auto’ with 10 iterations for boosting at each level. The tree depth, with which maximum efficiency is obtained, is up to level 6, wherein minimum child weight is set as default ‘1,’ and maximum delta step is set to no constraint with value ‘0’ (Figure 5).
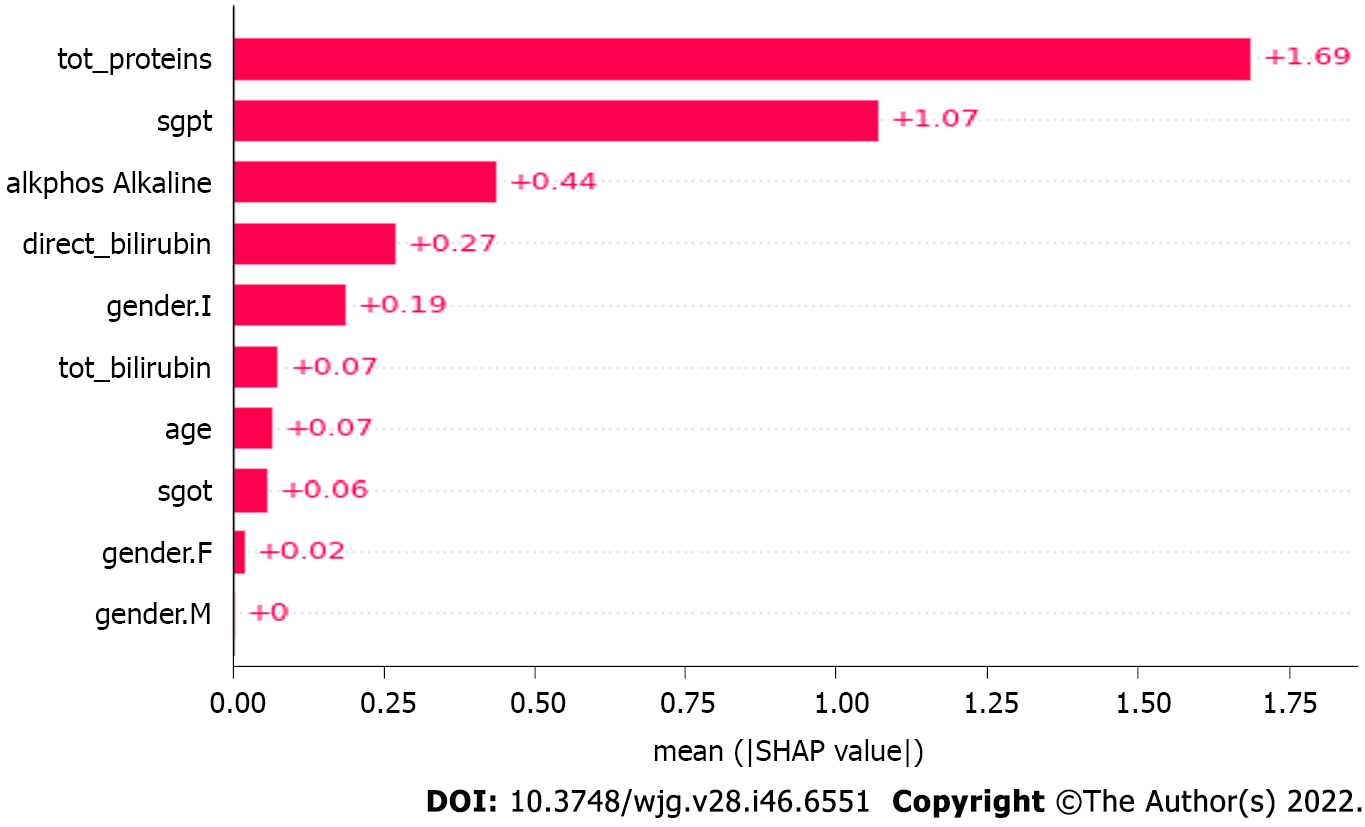
Figure 5 depicts the impact of the SHapley Additive exPlanations (SHAP) value on the XGBoost model. As the number of observations available is limited, the subsample space was set to ‘1’ to consider all the datapoints during each iteration. Similarly, the parameter for column and level sampling are also set to value ‘1’ (Figure 6).
Figure 6 depicts the mean SHAP values in the XGBoost model. The ‘eta’ parameter value is set to default ‘0.3’ to keep the weights stable after each iteration, whereas the gamma value to specify the loss reduction required for the split up is ‘0.’
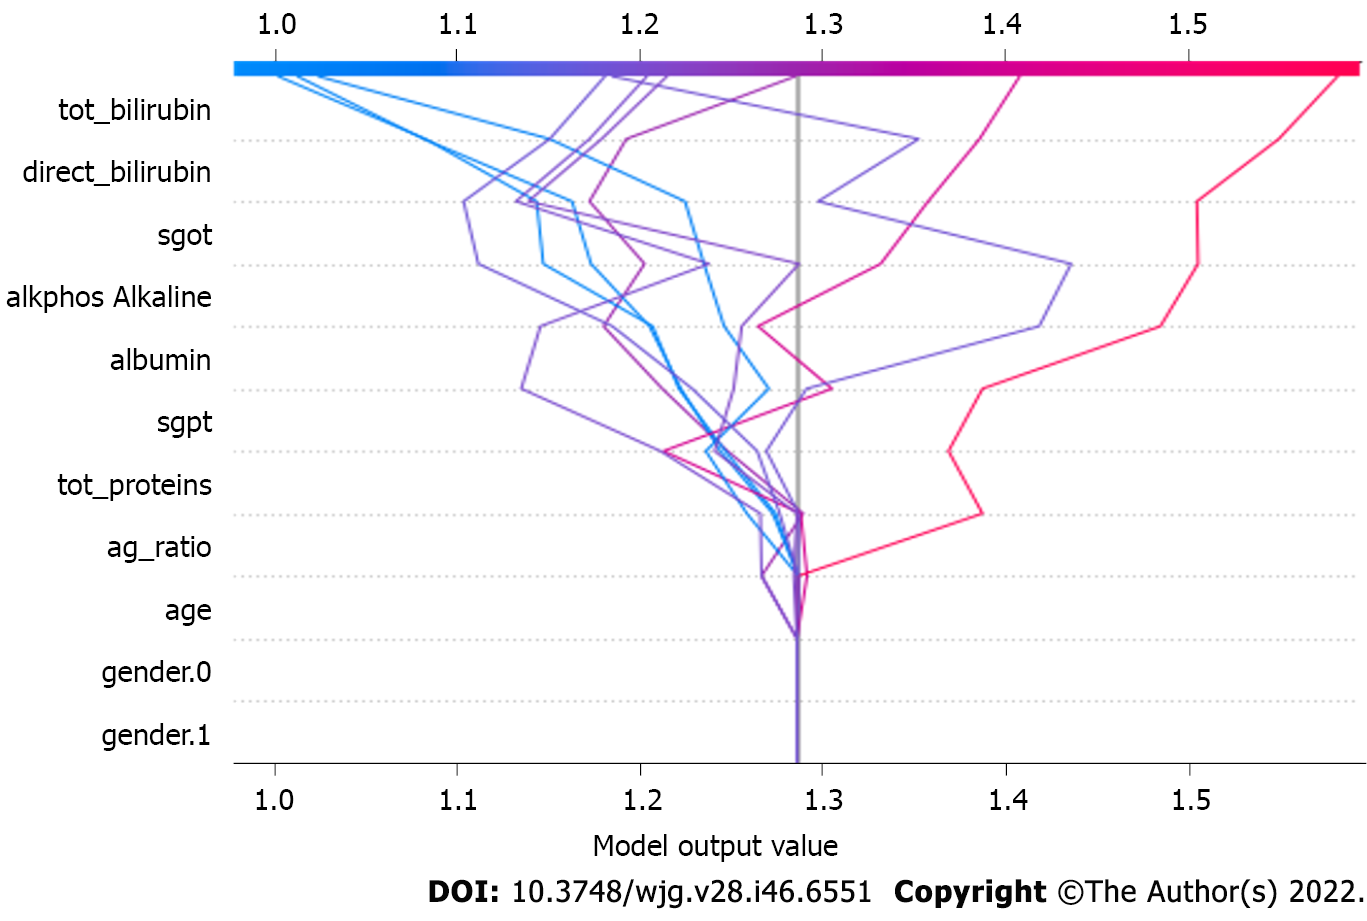
The value for the least square error and least absolute deviation, represented by parameter lambda and alpha, respectively, is set to value ‘1’ and ‘0’ and is used for regularizing the weights, making the model more stable, and controlling the overfitting[36] (Figure 7). The model is also executed with a hyperparameter tuning setup using the Bayesian optimization model and shows even better performance than the non-hyperparameter tuning setup.
Figure 7 depicts the model output value in the XGBoost model. These parameters make a direct impact on the output generated by the XGBoost model. The model is also executed with the hyper
The output of the different prediction models presented in this work was shown in this section in the categorized tabular format. The Gini coefficient is a machine learning metric used to assess the efficiency of binary classifier models. In the range of 0 to 1, the Gini coefficient can be used. The higher the Gini coefficient, the better the model. There are two ways to measure precision: The number of properly categorized positive samples (true positives) and the overall number of positively classified samples (either correctly or incorrectly). Using precision, we can see how reliable the machine learning model is when it comes to determining whether or not the model is positive.
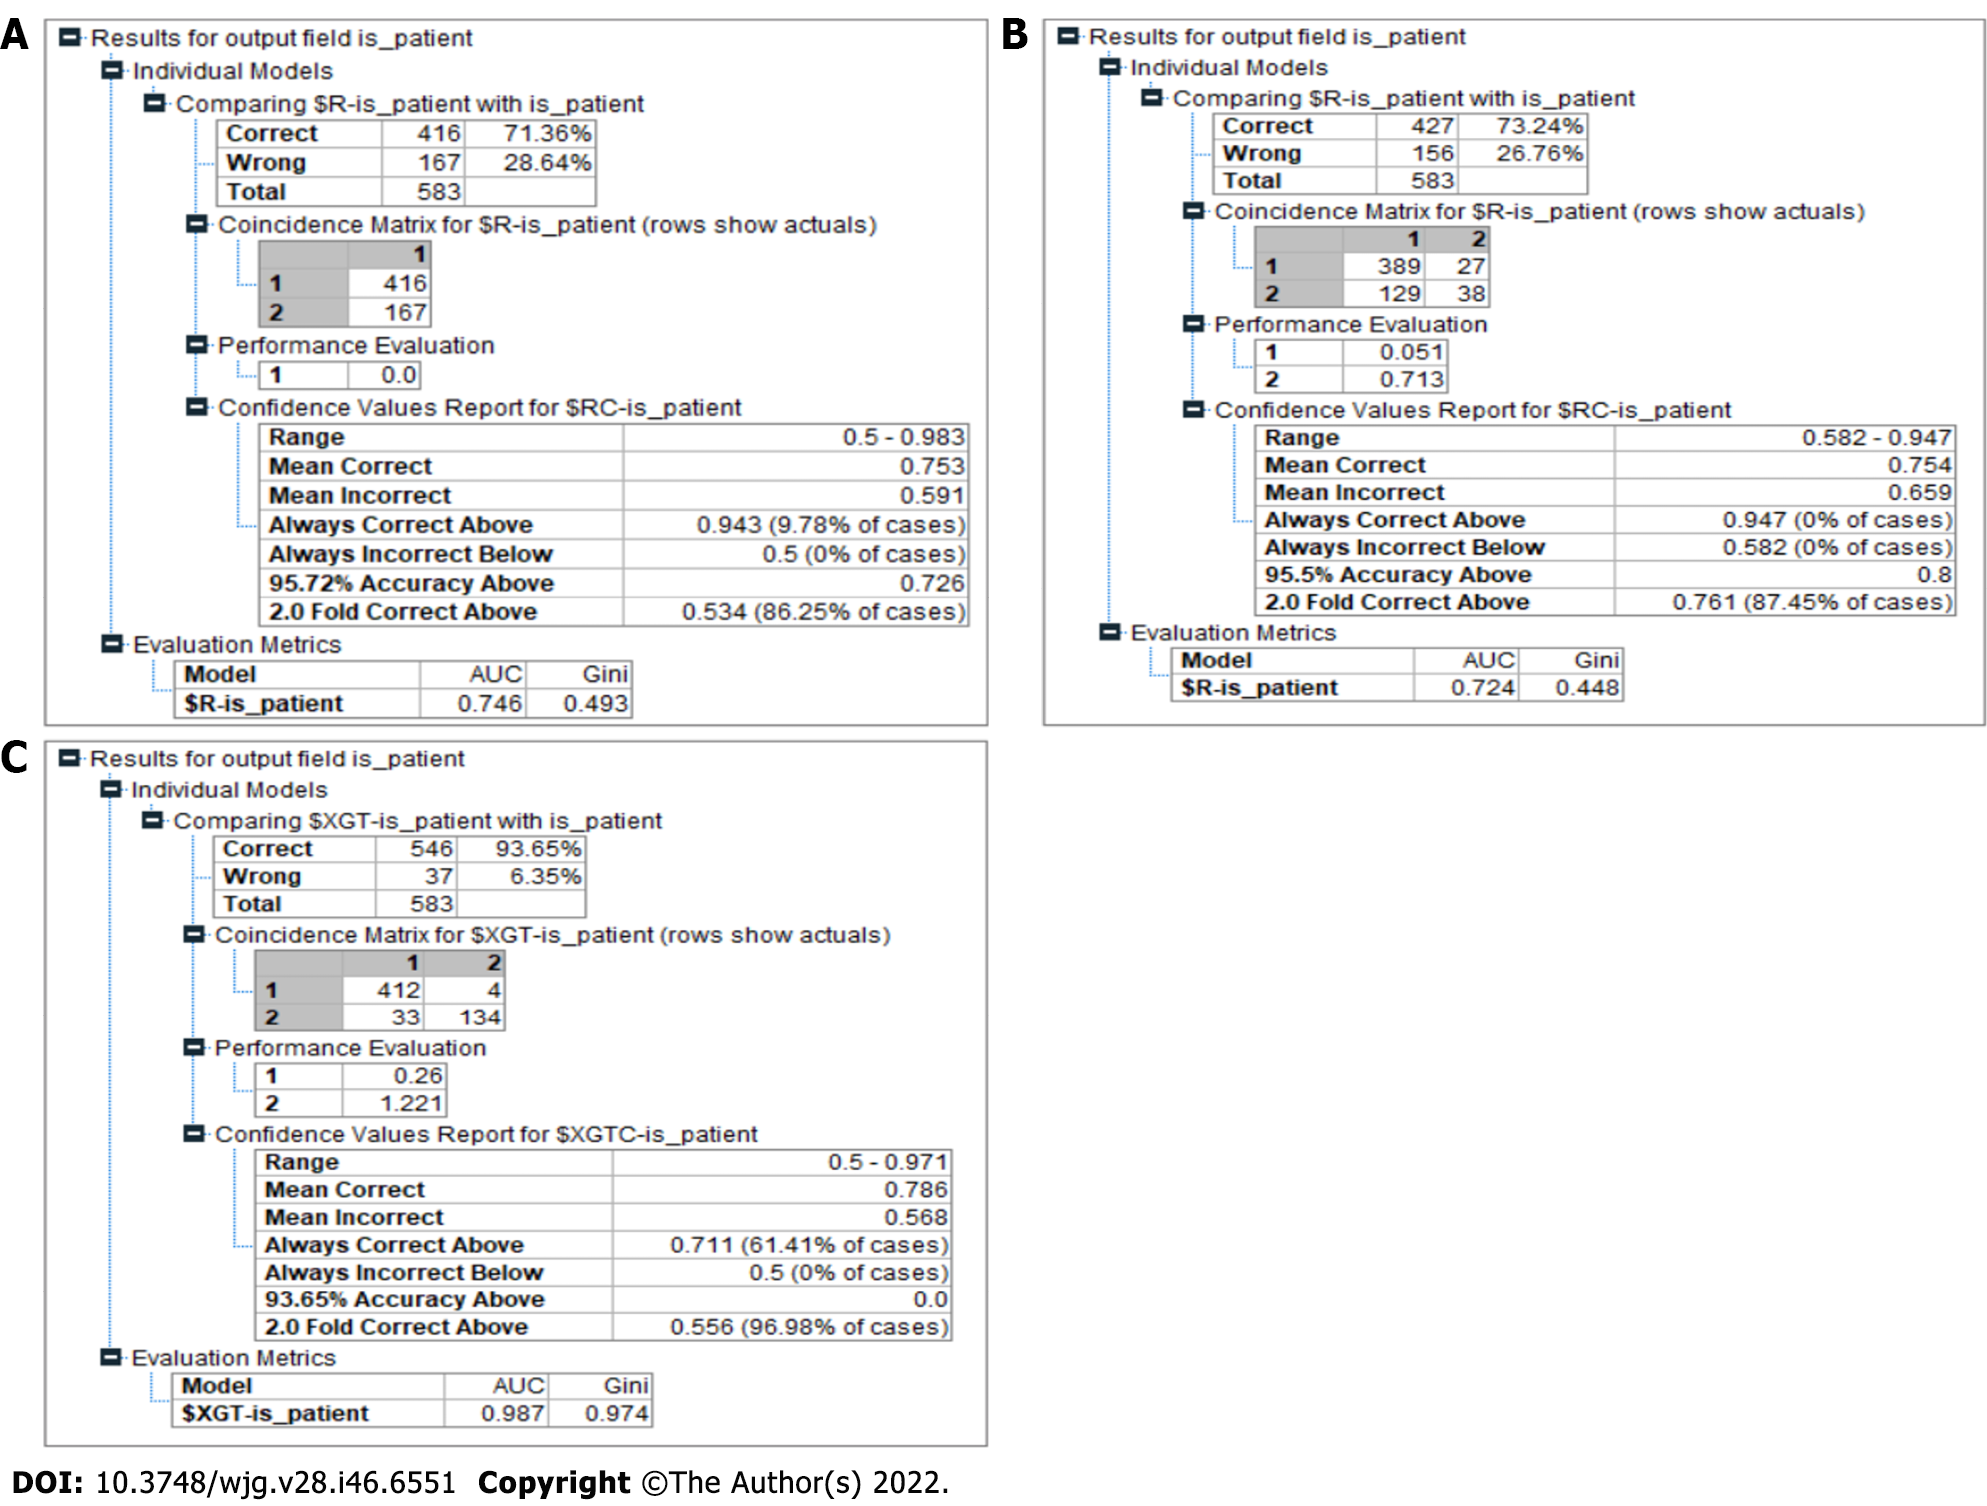
The recall was computed by dividing the total number of positive samples by the number of positive samples that were correctly categorized as positive. The recall assesses the capability of the model to identify positive samples in a dataset. The more positive samples that are found, the higher the recall will be. Figure 8 depicts the accuracy of an individual decision tree and tabulates the values of various performance matrices.
There were 583 patients in the Indian Liver Patient Dataset. A total of 500 patient records were used in the training process, and the remaining 83 records were used in the testing process. The CHAID model had 71.36% accuracy in predicting liver disease. The area under the curve and Gini value of this model were 0.746 and 0.493, respectively (Figure 8A). The model exhibited good discriminatory behavior according to the Gini coefficient value.
Of the 583 observations, 389 predictions were categorized as true positives, 38 as true negatives, and 156 as false in this model. The result for the CART model had a better accuracy, 73.24%, at predicting liver disease compared to the CHAID model. The area under the curve and Gini values of this model were 0.724 and 0.445, respectively (Figure 8B). The Gini coefficient showed that the ability of the model to categorize was not good.
Our model had an accuracy of 93.65% in predicting liver disease, outperforming the other models significantly (Figure 8C). It also showed a Gini index of 0.97, categorizing it as a highly efficient model in making the distinction between a patient who has liver disease and a patient who is healthy in the given context (Table 2).
| No. | Algorithm | Accuracy | AUC | Gini |
| 1 | CHAID model | 71.36 | 0.746 | 0.493 |
| 2 | CART model | 73.24 | 0.724 | 0.448 |
| 3 | Proposed model | 93.55 | 0.987 | 0.974 |
Artificial intelligence plays a very important role in predicting liver disease. It consists of different machine learning algorithms that may be applied in liver disease prediction. In this study, multiple machine learning algorithms were implemented on the abovementioned dataset of Indian liver patients. This work used the CART and CHAID algorithms to predict liver disease. If bilirubin, total protein, alkaline phosphatase, and albumin were present and tests such as serum glutamic-oxaloacetic transaminase (SGOT) and serum glutamic pyruvic transaminase (SGPT) indicated that a person needs to be diagnosed, the results were stated through the various machine learning algorithms. The proposed algorithm was efficient in handling the missing values and overfitting problem. It was capable of handling high variance problems normally faced in execution of the machine learning algorithms.
The decision tree algorithms, i.e. CART and CHAID, were not extremely accurate for the prediction of liver disease in our Indian patient cohort. The proposed machine learning model (hybrid XGBoost model) designed in this study showed an accuracy level of 93.65%. The proposed model faced the overfitting issue during its execution phase. In future studies, the image dataset of liver disease should be added to the algorithm to avoid other tests such as SGOT and SGPT. Such approaches are very useful for minimizing the workload of clinicians.
Liver disease is a leading cause of mortality in the United States and is regarded as a life-threatening condition across the world. It is possible for people to develop liver disease at a young age.
Predicting liver disease with precision, accuracy, and reliability can be accomplished through the use of a modified eXtreme Gradient Boosting model with hyperparameter tuning in comparison to the chi-square automated interaction detection (CHAID) and classification and regression tree models.
This study was conducted with the aim of fulfilling various objectives. The first objective was identifying the symptoms of liver disease and their impact on the patient. The authors studied various machine learning approaches for predicting liver disease and evaluated the performance of decision tree algorithms in prediction of liver disease. The next objective was to propose a modified eXtreme Gradient Boosting model with a hyperparameter tuning mechanism. Finally, the performance of the proposed model was validated with the existing models.
Hybrid eXtreme Gradient Boosting model with hyperparameter tuning was designed using data from patients who had liver disease and patients who were healthy.
The experimental results demonstrated that the accuracy level in the CHAID and classification and regression tree models were 71.36% and 73.24%, respectively. The proposed model was designed with the aim of gaining a sufficient level of accuracy. Hence, 93.65% accuracy was achieved in our proposed model.
The existing machine learning models, i.e. the CHAID model and the classification and regression tree model, do not achieve a high enough accuracy level. The proposed model predicted liver disease with 93.65% accuracy. This model has real-time adaptability and cost-effectiveness in liver disease prediction.
The proposed model can better predict liver-related disease by identifying the disease causes and suggesting better treatment options.
Provenance and peer review: Invited article; Externally peer reviewed.
Peer-review model: Single blind
Specialty type: Gastroenterology and hepatology
Country/Territory of origin: Nigeria
Peer-review report’s scientific quality classification
Grade A (Excellent): 0
Grade B (Very good): B
Grade C (Good): 0
Grade D (Fair): D, D
Grade E (Poor): 0
P-Reviewer: Lee KS, South Korea; Özlem Ş, Turkey S-Editor: Fan JR L-Editor: Filipodia P-Editor: Fan JR
| 1. | Liu Y, Méric G, Havulinna AS, Teo SM, Åberg F, Ruuskanen M, Sanders J, Zhu Q, Tripathi A, Verspoor K, Cheng S, Jain M, Jousilahti P, Vázquez-Baeza Y, Loomba R, Lahti L, Niiranen T, Salomaa V, Knight R, Inouye M. Early prediction of incident liver disease using conventional risk factors and gut-microbiome-augmented gradient boosting. Cell Metab. 2022;34:719-730.e4. [RCA] [PubMed] [DOI] [Full Text] [Full Text (PDF)] [Cited by in Crossref: 35] [Cited by in RCA: 43] [Article Influence: 14.3] [Reference Citation Analysis (0)] |
| 2. | Kang S, Kim E, Cho H, Kim DJ, Kim HC, Jung SJ. Associations between non-alcoholic fatty liver disease and cognitive impairment and the effect modification of inflammation. Sci Rep. 2022;12:12614. [RCA] [PubMed] [DOI] [Full Text] [Full Text (PDF)] [Cited by in RCA: 9] [Reference Citation Analysis (0)] |
| 3. | Survarachakan S, Prasad PJR, Naseem R, Pérez de Frutos J, Kumar RP, Langø T, Alaya Cheikh F, Elle OJ, Lindseth F. Deep learning for image-based liver analysis – A comprehensive review focusing on malignant lesions. Artif Intell Med. 2022;130:102331. [RCA] [PubMed] [DOI] [Full Text] [Reference Citation Analysis (0)] |
| 4. | Lysdahlgaard S. Comparing Radiomics features of tumour and healthy liver tissue in a limited CT dataset: A machine learning study. Radiography (Lond). 2022;28:718-724. [RCA] [PubMed] [DOI] [Full Text] [Reference Citation Analysis (0)] |
| 5. | Liu J, Tan L, Liu Z, Shi R. The association between non-alcoholic fatty liver disease (NAFLD) and advanced fibrosis with blood selenium level based on the NHANES 2017-2018. Ann Med. 2022;54:2259-2268. [RCA] [PubMed] [DOI] [Full Text] [Full Text (PDF)] [Cited by in Crossref: 2] [Cited by in RCA: 21] [Article Influence: 7.0] [Reference Citation Analysis (0)] |
| 6. | Yang H, Li X, Cao H, Cui Y, Luo Y, Liu J, Zhang Y. Using machine learning methods to predict hepatic encephalopathy in cirrhotic patients with unbalanced data. Comput Methods Programs Biomed. 2021;211:106420. [RCA] [PubMed] [DOI] [Full Text] [Cited by in Crossref: 12] [Cited by in RCA: 16] [Article Influence: 4.0] [Reference Citation Analysis (0)] |
| 7. | Haas ME, Pirruccello JP, Friedman SN, Wang M, Emdin CA, Ajmera VH, Simon TG, Homburger JR, Guo X, Budoff M, Corey KE, Zhou AY, Philippakis A, Ellinor PT, Loomba R, Batra P, Khera AV. Machine learning enables new insights into genetic contributions to liver fat accumulation. Cell Genom. 2021;1. [RCA] [PubMed] [DOI] [Full Text] [Full Text (PDF)] [Cited by in Crossref: 38] [Cited by in RCA: 46] [Article Influence: 11.5] [Reference Citation Analysis (0)] |
| 8. | Gómez-gavara C, Piella G, Vázquez J, Martín R, Parés B, Salcedo M, Pando E, Molino J, Charco R, Bilbao I. LIVERCOLOR: An Algorithm Quantification of Liver Graft Steatosis Using Machine Learning and Color Image Processing. HPB (Oxford). 2021;23:S691-2. [DOI] [Full Text] |
| 9. | Shen ZX, Wu DD, Xia J, Wang XB, Zheng X, Huang Y, Li BL, Meng ZJ, Gao YH, Qian ZP, Liu F, Lu XB, Shang J, Yan HD, Zheng YB, Gu WY, Zhang Y, Wei JY, Tan WT, Hou YX, Zhang Q, Xiong Y, Zou CC, Chen J, Huang ZB, Jiang XH, Luo S, Chen YY, Gao N, Liu CY, Yuan W, Mei X, Li J, Li T, Zhou XY, Deng GH, Chen JJ, Ma X, Li H. Prevalence and clinical characteristics of autoimmune liver disease in hospitalized patients with cirrhosis and acute decompensation in China. World J Gastroenterol. 2022;28:4417-4430. [RCA] [PubMed] [DOI] [Full Text] [Full Text (PDF)] [Cited by in CrossRef: 3] [Cited by in RCA: 2] [Article Influence: 0.7] [Reference Citation Analysis (0)] |
| 10. | Man S, Lv J, Yu C, Deng Y, Yin J, Wang B, Li L, Liu H. Association between metabolically healthy obesity and non-alcoholic fatty liver disease. Hepatol Int. 2022;. [RCA] [PubMed] [DOI] [Full Text] [Cited by in Crossref: 3] [Cited by in RCA: 17] [Article Influence: 5.7] [Reference Citation Analysis (0)] |
| 11. | Talari HR, Molaqanbari MR, Mokfi M, Taghizadeh M, Bahmani F, Tabatabaei SMH, Sharifi N. The effects of vitamin B12 supplementation on metabolic profile of patients with non-alcoholic fatty liver disease: a randomized controlled trial. Sci Rep. 2022;12:14047. [RCA] [PubMed] [DOI] [Full Text] [Full Text (PDF)] [Cited by in Crossref: 15] [Cited by in RCA: 18] [Article Influence: 6.0] [Reference Citation Analysis (0)] |
| 12. | Forlano R, Mullish BH, Giannakeas N, Maurice JB, Angkathunyakul N, Lloyd J, Tzallas AT, Tsipouras M, Yee M, Thursz MR, Goldin RD, Manousou P. High-Throughput, Machine Learning-Based Quantification of Steatosis, Inflammation, Ballooning, and Fibrosis in Biopsies From Patients With Nonalcoholic Fatty Liver Disease. Clin Gastroenterol Hepatol. 2020;18:2081-2090.e9. [RCA] [PubMed] [DOI] [Full Text] [Cited by in Crossref: 54] [Cited by in RCA: 94] [Article Influence: 18.8] [Reference Citation Analysis (0)] |
| 13. | Li D, Zhang M, Wu S, Tan H, Li N. Risk factors and prediction model for nonalcoholic fatty liver disease in northwest China. Sci Rep. 2022;12:13877. [RCA] [PubMed] [DOI] [Full Text] [Full Text (PDF)] [Cited by in RCA: 20] [Reference Citation Analysis (0)] |
| 14. | Li Q, Zhang X, Zhang C, Li Y, Zhang S. Risk Factors and Prediction Models for Nonalcoholic Fatty Liver Disease Based on Random Forest. Comput Math Methods Med. 2022;2022:8793659. [RCA] [PubMed] [DOI] [Full Text] [Full Text (PDF)] [Reference Citation Analysis (0)] |
| 15. | Byrne CD, Targher G. Time to consider a holistic approach to the treatment of non-alcoholic fatty liver disease in obese young people? Gut. 2022;. [RCA] [PubMed] [DOI] [Full Text] [Cited by in Crossref: 1] [Cited by in RCA: 1] [Article Influence: 0.3] [Reference Citation Analysis (0)] |
| 16. | Nitski O, Azhie A, Qazi-Arisar FA, Wang X, Ma S, Lilly L, Watt KD, Levitsky J, Asrani SK, Lee DS, Rubin BB, Bhat M, Wang B. Long-term mortality risk stratification of liver transplant recipients: real-time application of deep learning algorithms on longitudinal data. Lancet Digit Health. 2021;3:e295-e305. [RCA] [PubMed] [DOI] [Full Text] [Cited by in Crossref: 12] [Cited by in RCA: 54] [Article Influence: 13.5] [Reference Citation Analysis (0)] |
| 17. | Xiao Y, Liu Y, Zhao L, Zhou Y. Effect of 5:2 Fasting Diet on Liver Fat Content in Patients with Type 2 Diabetic with Nonalcoholic Fatty Liver Disease. Metab Syndr Relat Disord. 2022;. [RCA] [PubMed] [DOI] [Full Text] [Cited by in RCA: 15] [Reference Citation Analysis (0)] |
| 18. | Yang X, Xia M, Chang X, Zhu X, Sun X, Yang Y, Wang L, Liu Q, Zhang Y, Xu Y, Lin H, Liu L, Yao X, Hu X, Gao J, Yan H, Gao X, Bian H. A novel model for detecting advanced fibrosis in patients with nonalcoholic fatty liver disease. Diabetes Metab Res Rev. 2022;e3570. [RCA] [PubMed] [DOI] [Full Text] [Full Text (PDF)] [Cited by in Crossref: 2] [Cited by in RCA: 6] [Article Influence: 2.0] [Reference Citation Analysis (0)] |
| 19. | Ke J, Chen Y, Wang X, Wu Z, Zhang Q, Lian Y, Chen F. Machine learning-based in-hospital mortality prediction models for patients with acute coronary syndrome. Am J Emerg Med. 2022;53:127-134. [RCA] [PubMed] [DOI] [Full Text] [Cited by in Crossref: 1] [Cited by in RCA: 19] [Article Influence: 6.3] [Reference Citation Analysis (0)] |
| 20. | Thalor A, Kumar Joon H, Singh G, Roy S, Gupta D. Machine learning assisted analysis of breast cancer gene expression profiles reveals novel potential prognostic biomarkers for triple-negative breast cancer. Comput Struct Biotechnol J. 2022;20:1618-1631. [RCA] [PubMed] [DOI] [Full Text] [Full Text (PDF)] [Cited by in Crossref: 2] [Cited by in RCA: 31] [Article Influence: 10.3] [Reference Citation Analysis (0)] |
| 21. | Zeng S, Wang Z, Zhang P, Yin Z, Huang X, Tang X, Shi L, Guo K, Liu T, Wang M, Qiu H. Machine learning approach identifies meconium metabolites as potential biomarkers of neonatal hyperbilirubinemia. Comput Struct Biotechnol J. 2022;20:1778-1784. [RCA] [PubMed] [DOI] [Full Text] [Full Text (PDF)] [Cited by in Crossref: 5] [Cited by in RCA: 2] [Article Influence: 0.7] [Reference Citation Analysis (0)] |
| 22. | Shahid O, Nasajpour M, Pouriyeh S, Parizi RM, Han M, Valero M, Li F, Aledhari M, Sheng QZ. Machine learning research towards combating COVID-19: Virus detection, spread prevention, and medical assistance. J Biomed Inform. 2021;117:103751. [RCA] [PubMed] [DOI] [Full Text] [Full Text (PDF)] [Cited by in Crossref: 51] [Cited by in RCA: 24] [Article Influence: 6.0] [Reference Citation Analysis (0)] |
| 23. | Dalai C, Azizian J, Trieu H, Rajan A, Chen F, Dong T, Beaven S, Tabibian JH. Machine learning models compared to existing criteria for noninvasive prediction of endoscopic retrograde cholangiopancreatography-confirmed choledocholithiasis. Liver Res. 2021;5:224-231. [RCA] [PubMed] [DOI] [Full Text] [Full Text (PDF)] [Cited by in Crossref: 15] [Cited by in RCA: 11] [Article Influence: 2.8] [Reference Citation Analysis (0)] |
| 24. | Xing G, Huang Y, Liu X. Association between Dietary Pattern, Nutritional Status, Metabolic Factors, and Nonalcoholic Fatty Liver Disease. Contrast Media Mol Imaging. 2022;2022:4157403. [RCA] [PubMed] [DOI] [Full Text] [Full Text (PDF)] [Reference Citation Analysis (0)] |
| 25. | Lam C, Siefkas A, Zelin NS, Barnes G, Dellinger RP, Vincent JL, Braden G, Burdick H, Hoffman J, Calvert J, Mao Q, Das R. Machine Learning as a Precision-Medicine Approach to Prescribing COVID-19 Pharmacotherapy with Remdesivir or Corticosteroids. Clin Ther. 2021;43:871-885. [RCA] [PubMed] [DOI] [Full Text] [Full Text (PDF)] [Cited by in Crossref: 13] [Cited by in RCA: 11] [Article Influence: 2.8] [Reference Citation Analysis (0)] |
| 26. | Zhang P, Wang Z, Qiu H, Zhou W, Wang M, Cheng G. Machine learning applied to serum and cerebrospinal fluid metabolomes revealed altered arginine metabolism in neonatal sepsis with meningoencephalitis. Comput Struct Biotechnol J. 2021;19:3284-3292. [RCA] [PubMed] [DOI] [Full Text] [Full Text (PDF)] [Cited by in Crossref: 2] [Cited by in RCA: 13] [Article Influence: 3.3] [Reference Citation Analysis (0)] |
| 27. | Verma A, Chitalia VC, Waikar SS, Kolachalama VB. Machine Learning Applications in Nephrology: A Bibliometric Analysis Comparing Kidney Studies to Other Medicine Subspecialities. Kidney Med. 2021;3:762-767. [RCA] [PubMed] [DOI] [Full Text] [Full Text (PDF)] [Cited by in Crossref: 14] [Cited by in RCA: 13] [Article Influence: 3.3] [Reference Citation Analysis (0)] |
| 28. | Reker D, Shi Y, Kirtane AR, Hess K, Zhong GJ, Crane E, Lin CH, Langer R, Traverso G. Machine Learning Uncovers Food- and Excipient-Drug Interactions. Cell Rep. 2020;30:3710-3716.e4. [RCA] [PubMed] [DOI] [Full Text] [Full Text (PDF)] [Cited by in Crossref: 26] [Cited by in RCA: 32] [Article Influence: 8.0] [Reference Citation Analysis (0)] |
| 29. | Hu L, Li L, Ji J. Machine learning to identify and understand key factors for provider-patient discussions about smoking. Prev Med Rep. 2020;20:101238. [RCA] [PubMed] [DOI] [Full Text] [Full Text (PDF)] [Cited by in Crossref: 9] [Cited by in RCA: 10] [Article Influence: 2.0] [Reference Citation Analysis (0)] |
| 30. | Ietswaart R, Arat S, Chen AX, Farahmand S, Kim B, DuMouchel W, Armstrong D, Fekete A, Sutherland JJ, Urban L. Machine learning guided association of adverse drug reactions with in vitro target-based pharmacology. EbioMedicine. 2020;57:102837. [RCA] [PubMed] [DOI] [Full Text] [Full Text (PDF)] [Cited by in Crossref: 44] [Cited by in RCA: 43] [Article Influence: 8.6] [Reference Citation Analysis (0)] |
| 31. | Tao K, Bian Z, Zhang Q, Guo X, Yin C, Wang Y, Zhou K, Wan S, Shi M, Bao D, Yang C, Xing J. Machine learning-based genome-wide interrogation of somatic copy number aberrations in circulating tumor DNA for early detection of hepatocellular carcinoma. EbioMedicine. 2020;56:102811. [RCA] [PubMed] [DOI] [Full Text] [Full Text (PDF)] [Cited by in Crossref: 21] [Cited by in RCA: 48] [Article Influence: 9.6] [Reference Citation Analysis (0)] |
| 32. | Nemati M, Ansary J, Nemati N. Machine-Learning Approaches in COVID-19 Survival Analysis and Discharge-Time Likelihood Prediction Using Clinical Data. Patterns (N Y). 2020;1:100074. [RCA] [PubMed] [DOI] [Full Text] [Full Text (PDF)] [Cited by in Crossref: 53] [Cited by in RCA: 53] [Article Influence: 10.6] [Reference Citation Analysis (0)] |
| 33. | Ji GW, Zhu FP, Xu Q, Wang K, Wu MY, Tang WW, Li XC, Wang XH. Machine-learning analysis of contrast-enhanced CT radiomics predicts recurrence of hepatocellular carcinoma after resection: A multi-institutional study. EbioMedicine. 2019;50:156-165. [RCA] [PubMed] [DOI] [Full Text] [Full Text (PDF)] [Cited by in Crossref: 154] [Cited by in RCA: 138] [Article Influence: 23.0] [Reference Citation Analysis (0)] |
| 34. | Dalal S, Onyema EM, Kumar P, Maryann DC, Roselyn AO, Obichili MI. A hybrid machine learning model for timely prediction of breast cancer. Int J Model Simul Sci Comput. 2022;. [RCA] [DOI] [Full Text] [Cited by in Crossref: 18] [Cited by in RCA: 6] [Article Influence: 3.0] [Reference Citation Analysis (0)] |
| 35. | Edeh MO, Dalal S, Dhaou IB, Agubosim CC, Umoke CC, Richard-Nnabu NE, Dahiya N. Artificial Intelligence-Based Ensemble Learning Model for Prediction of Hepatitis C Disease. Front Public Health. 2022;10:892371. [RCA] [PubMed] [DOI] [Full Text] [Full Text (PDF)] [Cited by in Crossref: 2] [Cited by in RCA: 21] [Article Influence: 7.0] [Reference Citation Analysis (0)] |
| 36. | Onyema EM, Shukla PK, Dalal S, Mathur MN, Zakariah M, Tiwari B. Enhancement of Patient Facial Recognition through Deep Learning Algorithm: ConvNet. J Healthc Eng. 2021;2021:5196000. [RCA] [PubMed] [DOI] [Full Text] [Full Text (PDF)] [Cited by in Crossref: 18] [Cited by in RCA: 23] [Article Influence: 5.8] [Reference Citation Analysis (0)] |
| 37. | Chen J, Zou Q, Li J. DeepM6Aseq-EL: prediction of human N6-methyladenosine (m6A) sites with LSTM and ensemble learning. FRONT COMPUT SCI-CHI. 2022;16. [DOI] [Full Text] |
| 38. | Hou Q, Huang J, Xiong X, Guo Y, Zhang B. Role of Nutrient-sensing Receptor GPRC6A in Regulating Colonic Group 3 Innate Lymphoid Cells and Inflamed Mucosal Healing. J Crohns Colitis. 2022;16:1293-1305. [RCA] [PubMed] [DOI] [Full Text] [Cited by in Crossref: 16] [Cited by in RCA: 27] [Article Influence: 9.0] [Reference Citation Analysis (0)] |
| 39. | Xue X, Liu H, Wang S, Hu Y, Huang B, Li M, Gao J, Wang X, Su J. Neutrophil-erythrocyte hybrid membrane-coated hollow copper sulfide nanoparticles for targeted and photothermal/ anti-inflammatory therapy of osteoarthritis. COMPOS PART B-ENG. 2022;237:109855. [DOI] [Full Text] |
| 40. | Cao Z, Wang Y, Zheng W, Yin L, Tang Y, Miao W, Liu S, Yang B. The algorithm of stereo vision and shape from shading based on endoscope imaging. Biomed Sign Pro Cont. 2022;76:103658. [RCA] [DOI] [Full Text] [Cited by in Crossref: 17] [Cited by in RCA: 38] [Article Influence: 12.7] [Reference Citation Analysis (0)] |
| 41. | Liu Y, Tian J, Hu R, Yang B, Liu S, Yin L, Zheng W. Improved Feature Point Pair Purification Algorithm Based on SIFT During Endoscope Image Stitching. Front Neurorobot. 2022;16:840594. [RCA] [PubMed] [DOI] [Full Text] [Full Text (PDF)] [Cited by in Crossref: 13] [Cited by in RCA: 47] [Article Influence: 15.7] [Reference Citation Analysis (0)] |
| 42. | Liu S, Yang B, Wang Y, Tian J, Yin L, Zheng W. 2D/3D Multimode Medical Image Registration Based on Normalized Cross-Correlation. Appl Sci (Basel). 2022;12:2828. [RCA] [DOI] [Full Text] [Cited by in Crossref: 23] [Cited by in RCA: 51] [Article Influence: 17.0] [Reference Citation Analysis (0)] |


