Published online Oct 21, 2022. doi: 10.3748/wjg.v28.i39.5764
Peer-review started: June 28, 2022
First decision: August 19, 2022
Revised: September 7, 2022
Accepted: September 23, 2022
Article in press: September 23, 2022
Published online: October 21, 2022
Processing time: 112 Days and 2.7 Hours
Primary biliary cholangitis (PBC) and autoimmune hepatitis (AIH) are two un
To determine non-invasive, reliable, and sensitive biochemical markers for the differential diagnosis of PBC and AIH.
Serum samples from 54 patients with PBC, 26 patients with AIH and 30 healthy controls were analyzed by Ultra-high performance liquid chromatography-tandem mass spectrometry serum metabolomics. The metabolites and metabolic pathways were identified, and the metabolic changes, metabolic pathways and inter-group differences between PBC and AIH were analyzed. Fifteen kinds of target metabolites of bile acids (BAs) were quantitatively analyzed by SRM, and the differential metabolites related to the diagnosis of PBC were screened by receiver operating characteristic curve analysis.
We found the changes in the levels of amino acids, BAs, organic acids, phospholipids, choline, sugar, and sugar alcohols in patients with PBC and AIH. Furthermore, the SRM assay of BAs revealed the increased levels of chenodeoxycholic acid, lithocholic acid (LCA), taurolithocholic acid (TLCA), and LCA + TLCA in the PBC group compared with those in the AIH group. The levels of BAs may be used as biomarkers to differentiate PBC from AIH diseases. The levels of glycochenodeoxycholic acid, glycochenodeoxycholic sulfate, and taurodeoxycholic acid were gradually elevated with the increase of Child-Pugh class, which was correlated with the severity of disease.
The results demonstrated that the levels of BAs could serve as potential biomarkers for the early diagnosis and assessment of the severity of PBC and AIH.
Core Tip: Using full-contour metabolomics and SRM, to determine non-invasive, reliable, and sensitive biochemical markers for the differential diagnosis of primary biliary cholangitis (PBC) and autoimmune hepatitis (AIH). We revealed the increased levels of chenodeoxycholic acid, lithocholic acid (LCA), taurolithocholic acid (TLCA), and LCA + TLCA in the PBC group compared with those in the AIH group. The levels of glycochenodeoxycholic acid, glycochenodeoxycholic sulfate, and taurodeoxycholic acid were gradually elevated with the increase of Child-Pugh class, which was correlated with the severity of disease. The levels of BAs could serve as potential biomarkers for the early diagnosis and assessment of the severity of PBC and AIH.
- Citation: Ma ZH, Wang XM, Wu RH, Hao DL, Sun LC, Li P, Niu JQ. Serum metabolic profiling of targeted bile acids reveals potentially novel biomarkers for primary biliary cholangitis and autoimmune hepatitis. World J Gastroenterol 2022; 28(39): 5764-5783
- URL: https://www.wjgnet.com/1007-9327/full/v28/i39/5764.htm
- DOI: https://dx.doi.org/10.3748/wjg.v28.i39.5764
Primary biliary cholangitis (PBC) and autoimmune hepatitis (AIH) are two unexplained immune diseases[1]. Although advanced methods have been presented for diagnosing PBC and AIH, 5%-10% of PBC patients have anti-mitochondrial antibody-negative, and missed diagnosis or misdiagnosis mainly occurs in clinical practice[2]. For some patients with anti-mitochondrial antibody-positive, rather than significant changes in hepatic histology and function, long-term follow-up revealed that these patients eventually developed to PBC. Thus, early diagnosis of these patients is a clinical challenge. Clinical manifestations of AIH may have similarities to other autoimmune liver diseases, such as drug-induced hepatitis, alcoholic liver disease, inherited metabolic disorders, and hepatitis C virus infection, such as regardless of the cause of liver disease, patients may present with fatigue, abdominal distention, skin and sclera yellow staining, laboratory test show liver dysfunction. Because of the complexity and difficulty of diagnosing, leading to the delayed diagnosis of several AIH patients. Liver biopsy remains the golden standard for the diagnosis of autoimmune liver diseases, while it is an invasive, painful, and costly method that is associated with the possibility of sampling error and variability in interpretation. Therefore, identification of novel and accurate noninvasive biomarkers for the diagnosis and assessment of severity is of great importance.
As one of the emerging ‘omics’ platforms, metabolomics enables the qualitative and quantitative analyses of metabolites in complex biological samples[3]. As products of cellular adjustment processes, metabolites are regarded as the ultimate readouts that reflect genetic or environmental changes in biological systems[4,5] High-throughput metabolic profiling has been successfully used for the identification of novel diagnostic molecules and disease-related pathways, as well as development of new therapeutic targets for some diseases (e.g., cancer, non-alcoholic fatty liver disease, non-alcoholic steatohepatitis, and PBC)[6-10]. Thus, it is essential to identify specific metabolomic markers, and to establish a diagnostic model for AIH or PBC.
In the present study, we aimed to identify serum biomarkers for the differential diagnosis of PBC and AIH using ultra-performance liquid chromatography-quadrupole time-of-flight mass spectrometry (UPLC-QTOF-MS). UPLC-QTOF-MS is a newly developed technique that provides rapid and efficient access to detailed information pertaining to the nature of specific components within complex multicomponent mixtures. Compared with traditional high-performance liquid chromatography (HPLC), UPLC possesses the advantages of ultra-high resolution, high-speed scanning, and high sensitivity. Furthermore, bile acids (BAs) are crucial for the diagnosis, follow-up, and prognosis of liver and intestinal disorders, as well as diseases affecting BA metabolism. We applied a targeted metabolomic approach to quantify and compare 15 BA metabolites in PBC/AIH patients with those in healthy controls (HCs). The findings of the present study may reveal potentially novel biomarkers for the diagnosis of PBC and AIH. This study also aimed to compare metabolic profiles between PBC/AIH patients and HCs.
A total of 54 PBC and 26 AIH patients who were admitted to the First Hospital of Jilin University (Changchun, China) between May 2009 and November 2013 were respectively recruited in the present study. The study protocol was carefully reviewed and approved by the Institutional Review Board of The First Hospital of Jilin University. All the eligible patients and HCs signed the written informed consent form prior to enrollment. Patients with AIH were diagnosed according to the revised criteria presented by the International Autoimmune Hepatitis Group in 1999[11]. Patients with PBC were diagnosed according to the criteria released by the American Association for the Study of Liver Diseases[12]. Patients taking medication or supplements, or those with gallstones or other factors that might cause cholestatic liver diseases were excluded. In both groups, patients with primary sclerosing cholangitis (PSC), overlap syndromes (e.g., PBC and AIH or AIH and PSC), hepatitis virus infection, human immunodeficiency virus co-infection, hepatocellular carcinoma, or diabetes were excluded. In total, 30 HCs who were admitted to our hospital for physical check-ups were enrolled. These HCs exhibited normal liver functions and had no evidence of disease. No statistically significant differences were found in age and gender among the PBC, AIH, and control groups (Table 1, P > 0.05).
| Clinical parameters | PBC (n = 54) | AIH (n = 26) | Control (n = 30) | P value (PBC vs control) | P value (AIH vs control) | P value (PBC vs AIH) |
| Age (mean, range) (yr), n | 56 (38-73) | 54.6 (17-75) | 54.9(34-70) | 0.922 | 0.805 | 0.890 |
| Sex (Male/Female), n | 7/47 | 3/23 | 4/26 | - | - | - |
| AST (U/L) median, range | 113.3 (14-1300) | 168.8 (23-961) | 23.3 (7-38) | < 0.001 | < 0.001 | 0.423 |
| ALT (U/L) median, range | 95.9 (12-734) | 153.3 (10-780) | 19.0 (7-39) | < 0.001 | < 0.001 | 0.125 |
| ALP (U/L) median, range | 292.4 (55-953) | 240.1 (46-795) | 73.6 (32-116) | < 0.001 | < 0.001 | 0.123 |
| γ-GT (U/L) median, range | 299.4 (32-1631) | 245.2 (26-957) | 21.1 (9-77) | < 0.001 | < 0.001 | 0.377 |
| TBA (μmol/L) median, range | 60.0 (2.7-295.7) | 126.0 (1.1-1335) | - | - | - | 0.696 |
| TBiL (μmol/L) median, range | 65.5 (5.6-825.8) | 89.1 (6.5-543.9) | 10.9 (6.3-19.5) | < 0.001 | < 0.001 | 0.481 |
| DBIL (μmol/L) median range | 35.9 (2.4-407.4) | 52.9 (2.1-300.8) | 3.3 (0.4-6) | < 0.001 | < 0.001 | 0.648 |
| Liver cirrhosis (%) | 65 (35/54) | 62 (16/26) | - | - | - | - |
| Liver biopsy (%) | 18 (10/54) | 53 (14/26) | - | - | - | - |
| Positive of AMA (%) | 81 (44/54) | 0 (0/26) | - | - | - | - |
| Positive of ANA (%) | 61 (33/54) | 100 (26/26) | - | - | - | - |
Blood samples at the fasting state were collected from the eligible PBC patients, AIH patients, and HCs, in which 1 mL of serum was collected and stored at -80 °C for subsequent metabolic profiling. Participants’ baseline characteristics are summarized in Table 1.
HPLC-grade acetonitrile was purchase from Merck Inc. (Kenilworth, NJ, United States). HPLC-grade formic acid was obtained from Sigma-Aldrich (St. Louis, MO, United States). These two reagents were used for the preparation of mobile phases in HPLC. Milli-Q water was used, and obtained by filtering distilled water through a Milli-Q system (Millipore, Bedford, MA, United States). The chemical standards for the validation of molecular structure were obtained from Sigma-Aldrich.
In the present study, 100 μL of each serum sample was mixed with 400 μL of cold acetonitrile for protein precipitation, followed by centrifugation at 14000 g for 10 min at 4 °C. Then, 400 μL of the supernatant was subsequently collected and lyophilized, and the residue was resolved in 100 μL of 20% acetonitrile. Equal aliquot of each serum sample was pooled together and mixed thoroughly by vortex for 1 min, which was used as the quality control (QC) sample. A QC sample was prepared after preparation of 10 real samples, and QC samples served to assess the repeatability of sample pretreatment and to monitor the stability of the UPLC-QTOF-MS system at the sequence analysis.
The UPLC-QTOF-MS approach was employed to perform serum metabolic profiling of samples obtained from PBC patients, AIH patients, and HCs, as previously described[13]. In brief, 5 μL of the reconstituted solution was carefully injected into the ACQUITY-UPLC system (Waters Corp., Milford, MA, United States) for separation using chromatography. Then, MS signals were acquired via the QTOF-MS system (Micromass, Manchester, United Kingdom), which was equipped with an elec
All samples prepared with GCA-d5 as the internal standard and blood samples were resolved in 100 μL of 25% ACN aqueous solution. The LC-MS parameters were as follows: 20 μL of the reconstituted solution was carefully injected into an ACQUITY UPLC C8 column with a particle size of 1.7 μm (Waters Corp.), and the SRM signals were obtained using an Agilent 6460 Triple Quadruple MS system (Agilent Technologies, Inc., Chicago, IL, United States), which was equipped with an electrospray source operating in the negative ion mode. The column was eluted with 10 mmol/L NH4HCO3 (solution A) and acetonitrile (solution B) in a linear gradient, in which the initial gradient was set to 75% solution A. Subsequently, after 9.0 min of elution, the strength was linearly elevated to 90% solution B, which lasted for 4 min. Then, this was returned to the initial gradient after 13.5 min of elution. Along with an equilibration of 1.5 min, the total running time was approximately 15 min. The following MS parameters were set in this study: Gas flow rate, 8 L/min; gas temperature, 350 °C; sheath gas temperature, 400 °C; nebulizer gas pressure, 40 psi; capillary voltage, 3500 V; sheath gas flow rate, 8 L/min; nozzle voltage, 400 V. The precursor and product ion pairs were acquired as follows: Cholic acid (CA) (407.5→407.5), glycocholic acid (GCA) (464.2→74.1), taurocholic acid (TCA) (514.2→80.1), ursodeoxycholic acid (UDCA) (391.4→391.4), glycoursodeoxycholic acid (GUDCA) (448.3→74.1), tauroursodeoxycholic acid (TUDCA) (498.3→80.1), chenodeoxycholic acid (CDCA) (391.4→391.4), glycochenodeoxycholic acid (GCDCA) (448.3→74.1), tauroursodeoxycholic acid (TCDCA) (498.2→80.1), glycochenodeoxycholic sulfate (GCDCS) (528.3→448.3), deoxycholic acid (DCA) (391.2→391.2), glycodeoxycholic acid (GDCA) (448.2→74.1), taurodeoxycholic acid (TDCA) (498.3→80.2), lithocholic acid (LCA) (375.3→375.3), taurolithocholic acid (TLCA) (482.1→80.1), and GCA-d5 (469.2→74.1).
The raw data were imported into Databridge (MassHunter Quantitative Analysis software; Agilent Technologies, Inc.), followed by the peak extraction and alignment on the obtained NetCDF files using XCMS 18.0 software. The alignment parameters were set as follows: The retention time window was 7, the full width at half maximum was 14, and the remaining parameters were set as default. Sub
In the univariate analysis, data were statistically analyzed by SPSS 18.0 software (IBM, Armonk, NY, United States). The biochemical data and the concentrations of BAs were log-transformed to approximately normalize their distributions. P < 0.05 was considered statistically significant. Nonparametric statistical analysis was conducted using GraphPad Prism 5.0 software (GraphPad Software Inc., San Diego, CA, United States) for making comparison between two groups.
Patients’ baseline clinical characteristics are summarized in Table 1. Previous epidemiological studies have demonstrated that women were more frequently affected by PBC and AIH than men. Consistently, the incidence rates of PBC and AIH were higher in women than in men in our study. Furthermore, to avoid the influences of drugs on the metabolomics analysis, no patient had received any treatment, including traditional Chinese medicine. The mean age of patients with PBC and AIH, and HCs was 56 (range, 38-73), 54.6 (range, 17-75), and 54.9 (range, 30-76) years old, respectively. There were no significant differences in age, parity, and gender among patients with PBC and AIH, and HCs (P > 0.05). Besides, 10 cases from the PBC group and 14 cases from the AIH group were newly diagnosed by biopsy. Other cases from the PBC group were diagnosed by M2-positive, and other cases from the AIH group were diagnosed by pathological scores (> 12).
There were 26 cases of Child-Pugh class A, 19 cases of Child-Pugh class B, and 9 cases of Child-Pugh class C in PBC patients. There were 17 Child-Pugh grade A and 9 Child-Pugh grade B patients with AIH. The levels of globulin, transaminases, and specific autoantibodies in the sera are presented in Table 2.
| Clinical parameters | PBC-A (n = 26) | PBC-B (n = 19) | PBC-C (n = 9) | AIH-A (n = 17) | AIH-B (n = 9) |
| Age (mean, range) (yr), n | 54 (38, 68) | 57.11 (40, 73) | 59.33 (51, 67) | 52.35 (17, 75) | 59.11 (36, 73) |
| Sex (Male/Female), n | 6/20 | 3/16 | 0/9 | 2/15 | 1/8 |
| AST (U/L) median, range | 62.77 (20, 210) | 182.62 (14, 1300) | 113.27 (35, 235) | 122.28 (23, 961) | 256.78 (64, 472) |
| ALT (U/L) median, range | 74.18 (15, 293) | 130.32 (12, 734) | 84.51 (17, 236) | 100.54 (10, 780) | 253.11 (103, 598) |
| ALP (U/L) median, range | 276.41 (75, 53) | 352.73 (79, 913) | 211.43 (55, 483) | 230.33 (57, 795) | 258.78 (46, 738) |
| γ-GT (U/L) median, range | 380.18 (40, 631) | 281.77 (40, 744) | 103.49 (32, 235) | 166.46 (26, 654) | 393.89 (73, 957) |
| TBA (μmol/L) median, range | 31.04 (2.9, 09.3) | 75.16 (2.7, 295.7) | 127.37 (23.4, 267.5) | 116.46 (1, 1335) | 144.29 (15, 379) |
| TBiL (μmol/L) median, range | 19.7 (5.6, 48.8) | 81.0 (11.3, 306.5) | 181.62 (17.7, 825.8) | 48.33 (6.5, 229.5) | 166.23 (50.0, 543.9) |
| DBIL (μmol/L) median, range | 9.18 (2.4, 32.0) | 48.3 (4.1, 207.9) | 99.71 (6.6, 407.4) | 27.40 (2.1, 139.3) | 101.24 (30.6, 300.8) |
| Liver cirrhosis (%) | 0.38 (10/26) | 0.84 (16/19) | 1 (9/9) | 0.47 (8/17) | 0.33 (3/9) |
| Liver biopsy (%) | 0.35 (9/26) | 0.05 (1/19) | 0 (0/9) | 0.64 (11/17) | 0.33 (3/9) |
| Positive of AMA (%) | 80 (21/26) | 80 (15/19) | 89 (8/9) | 0 (0/17) | 0 (0/9) |
| Positive of ANA (%) | 73 (19/26) | 52 (10/19) | 44 (4/9) | 100 (17/17) | 100 (9/9) |
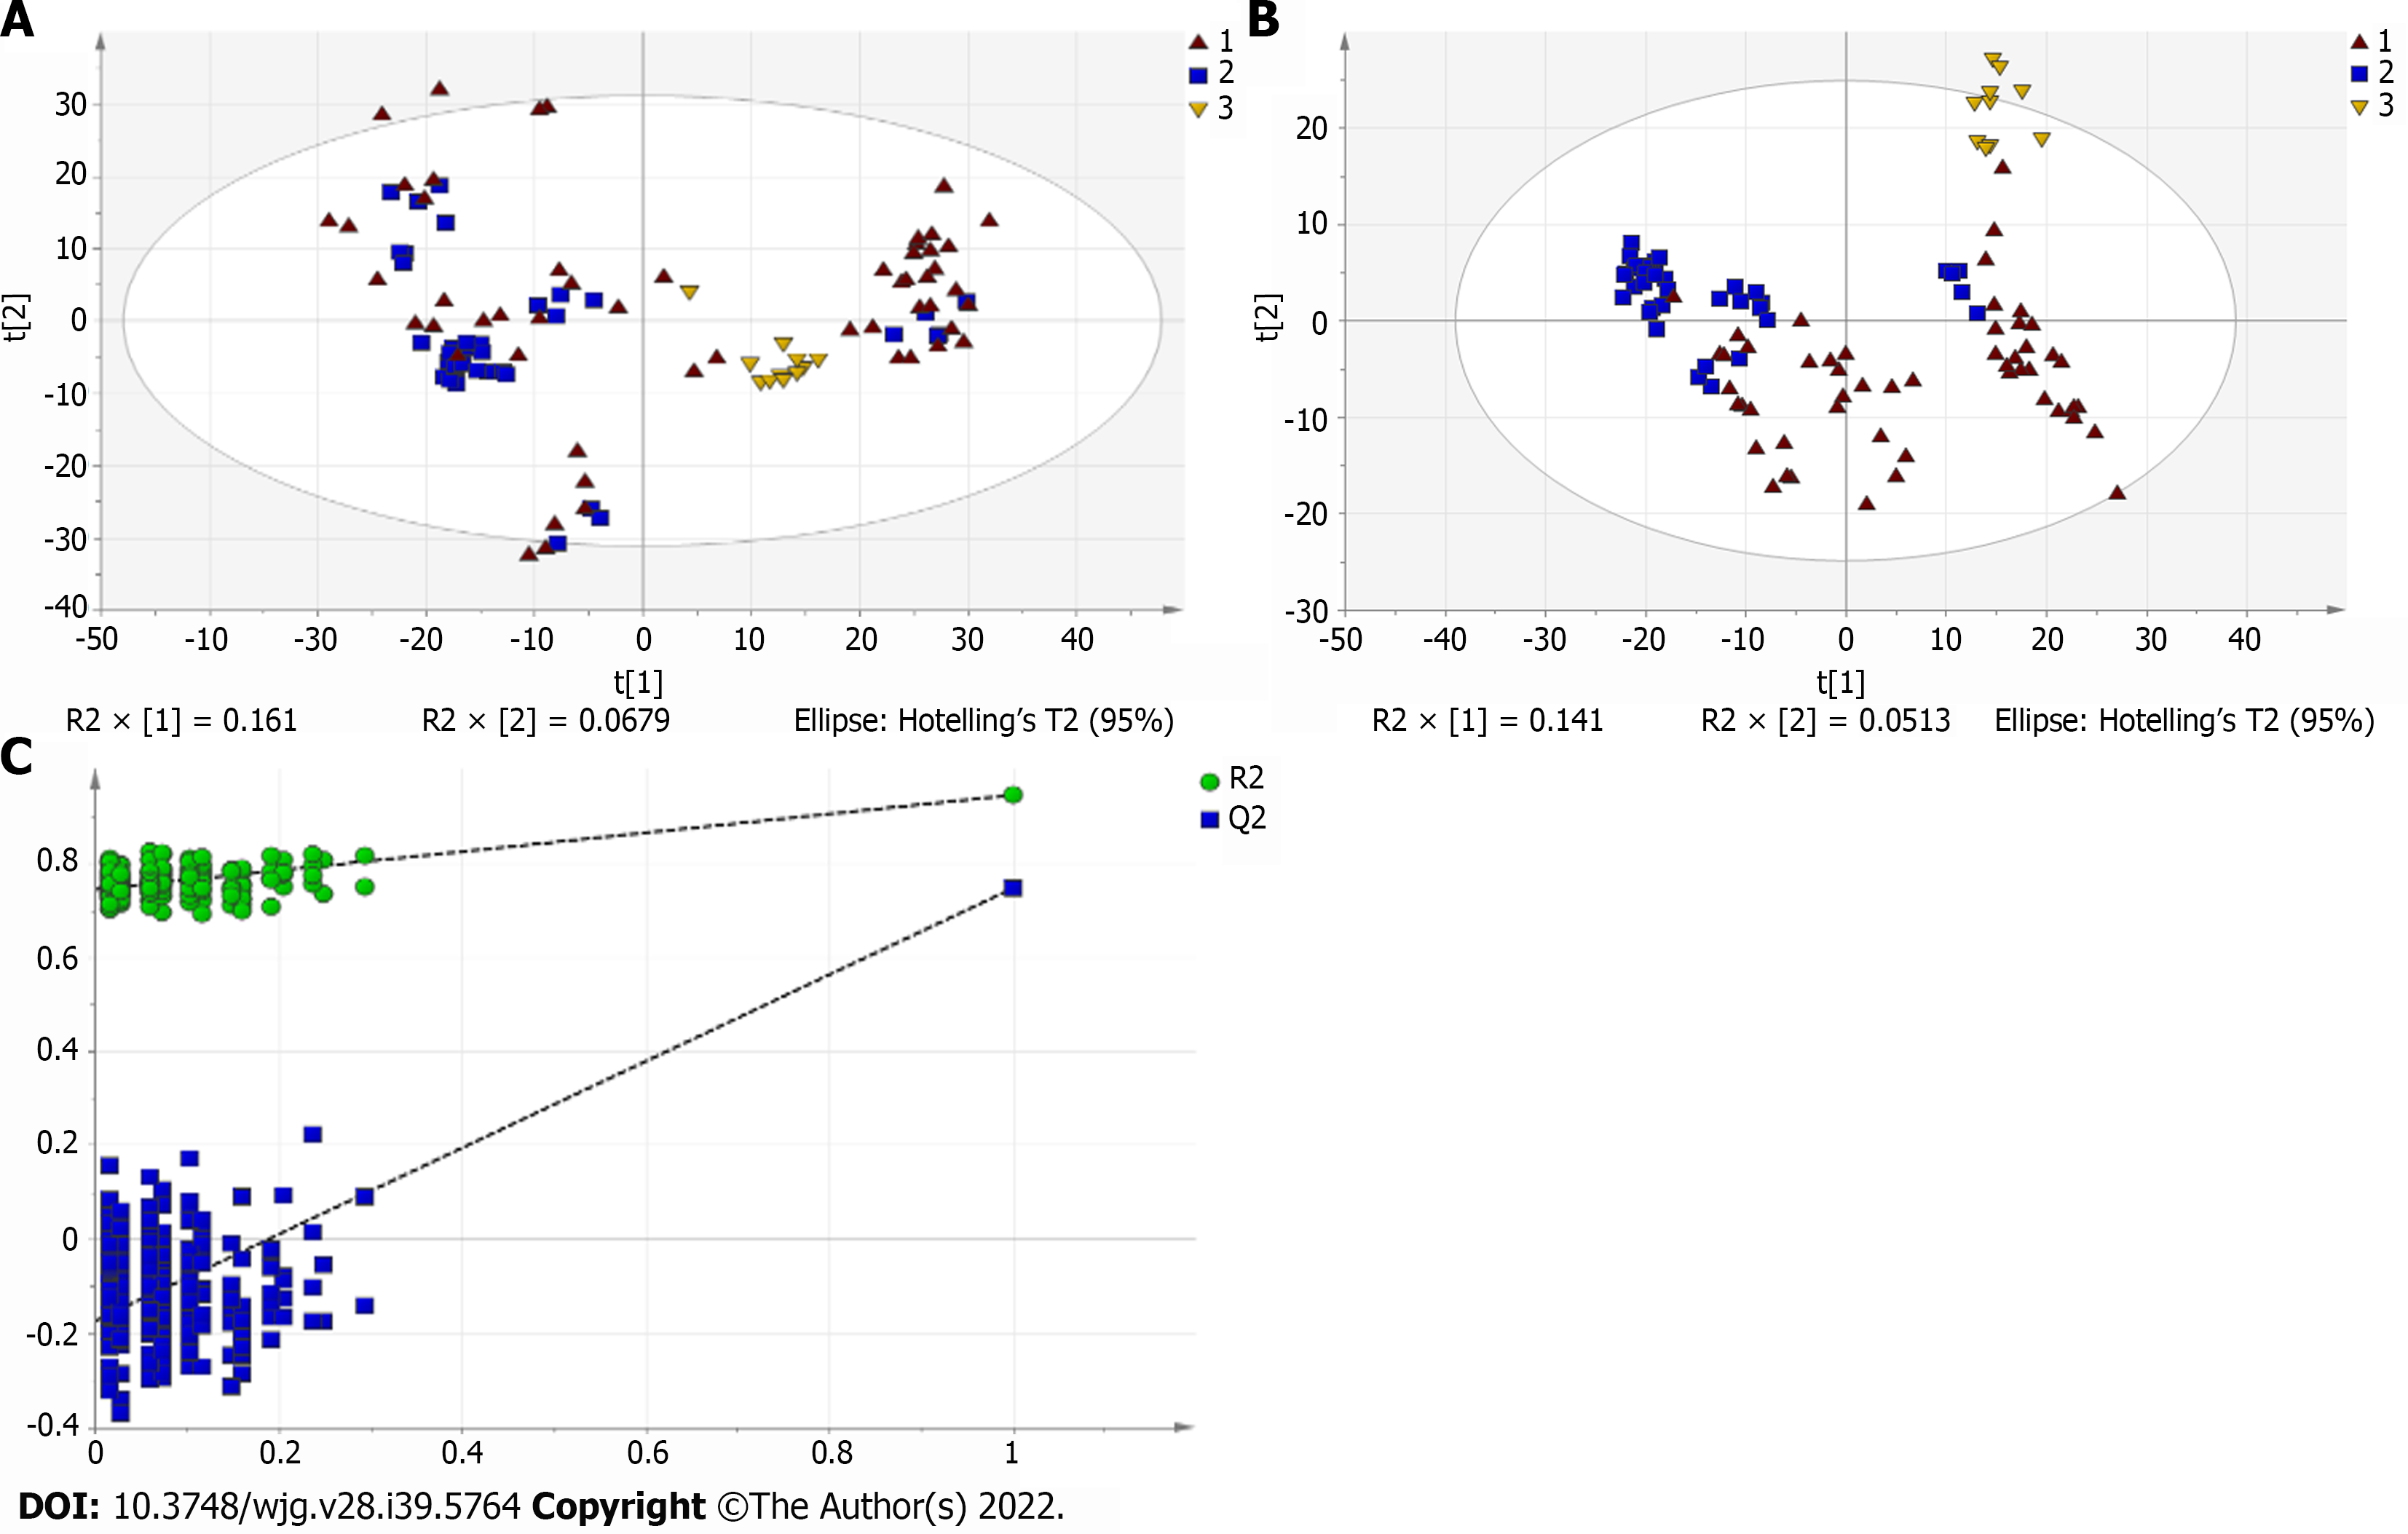
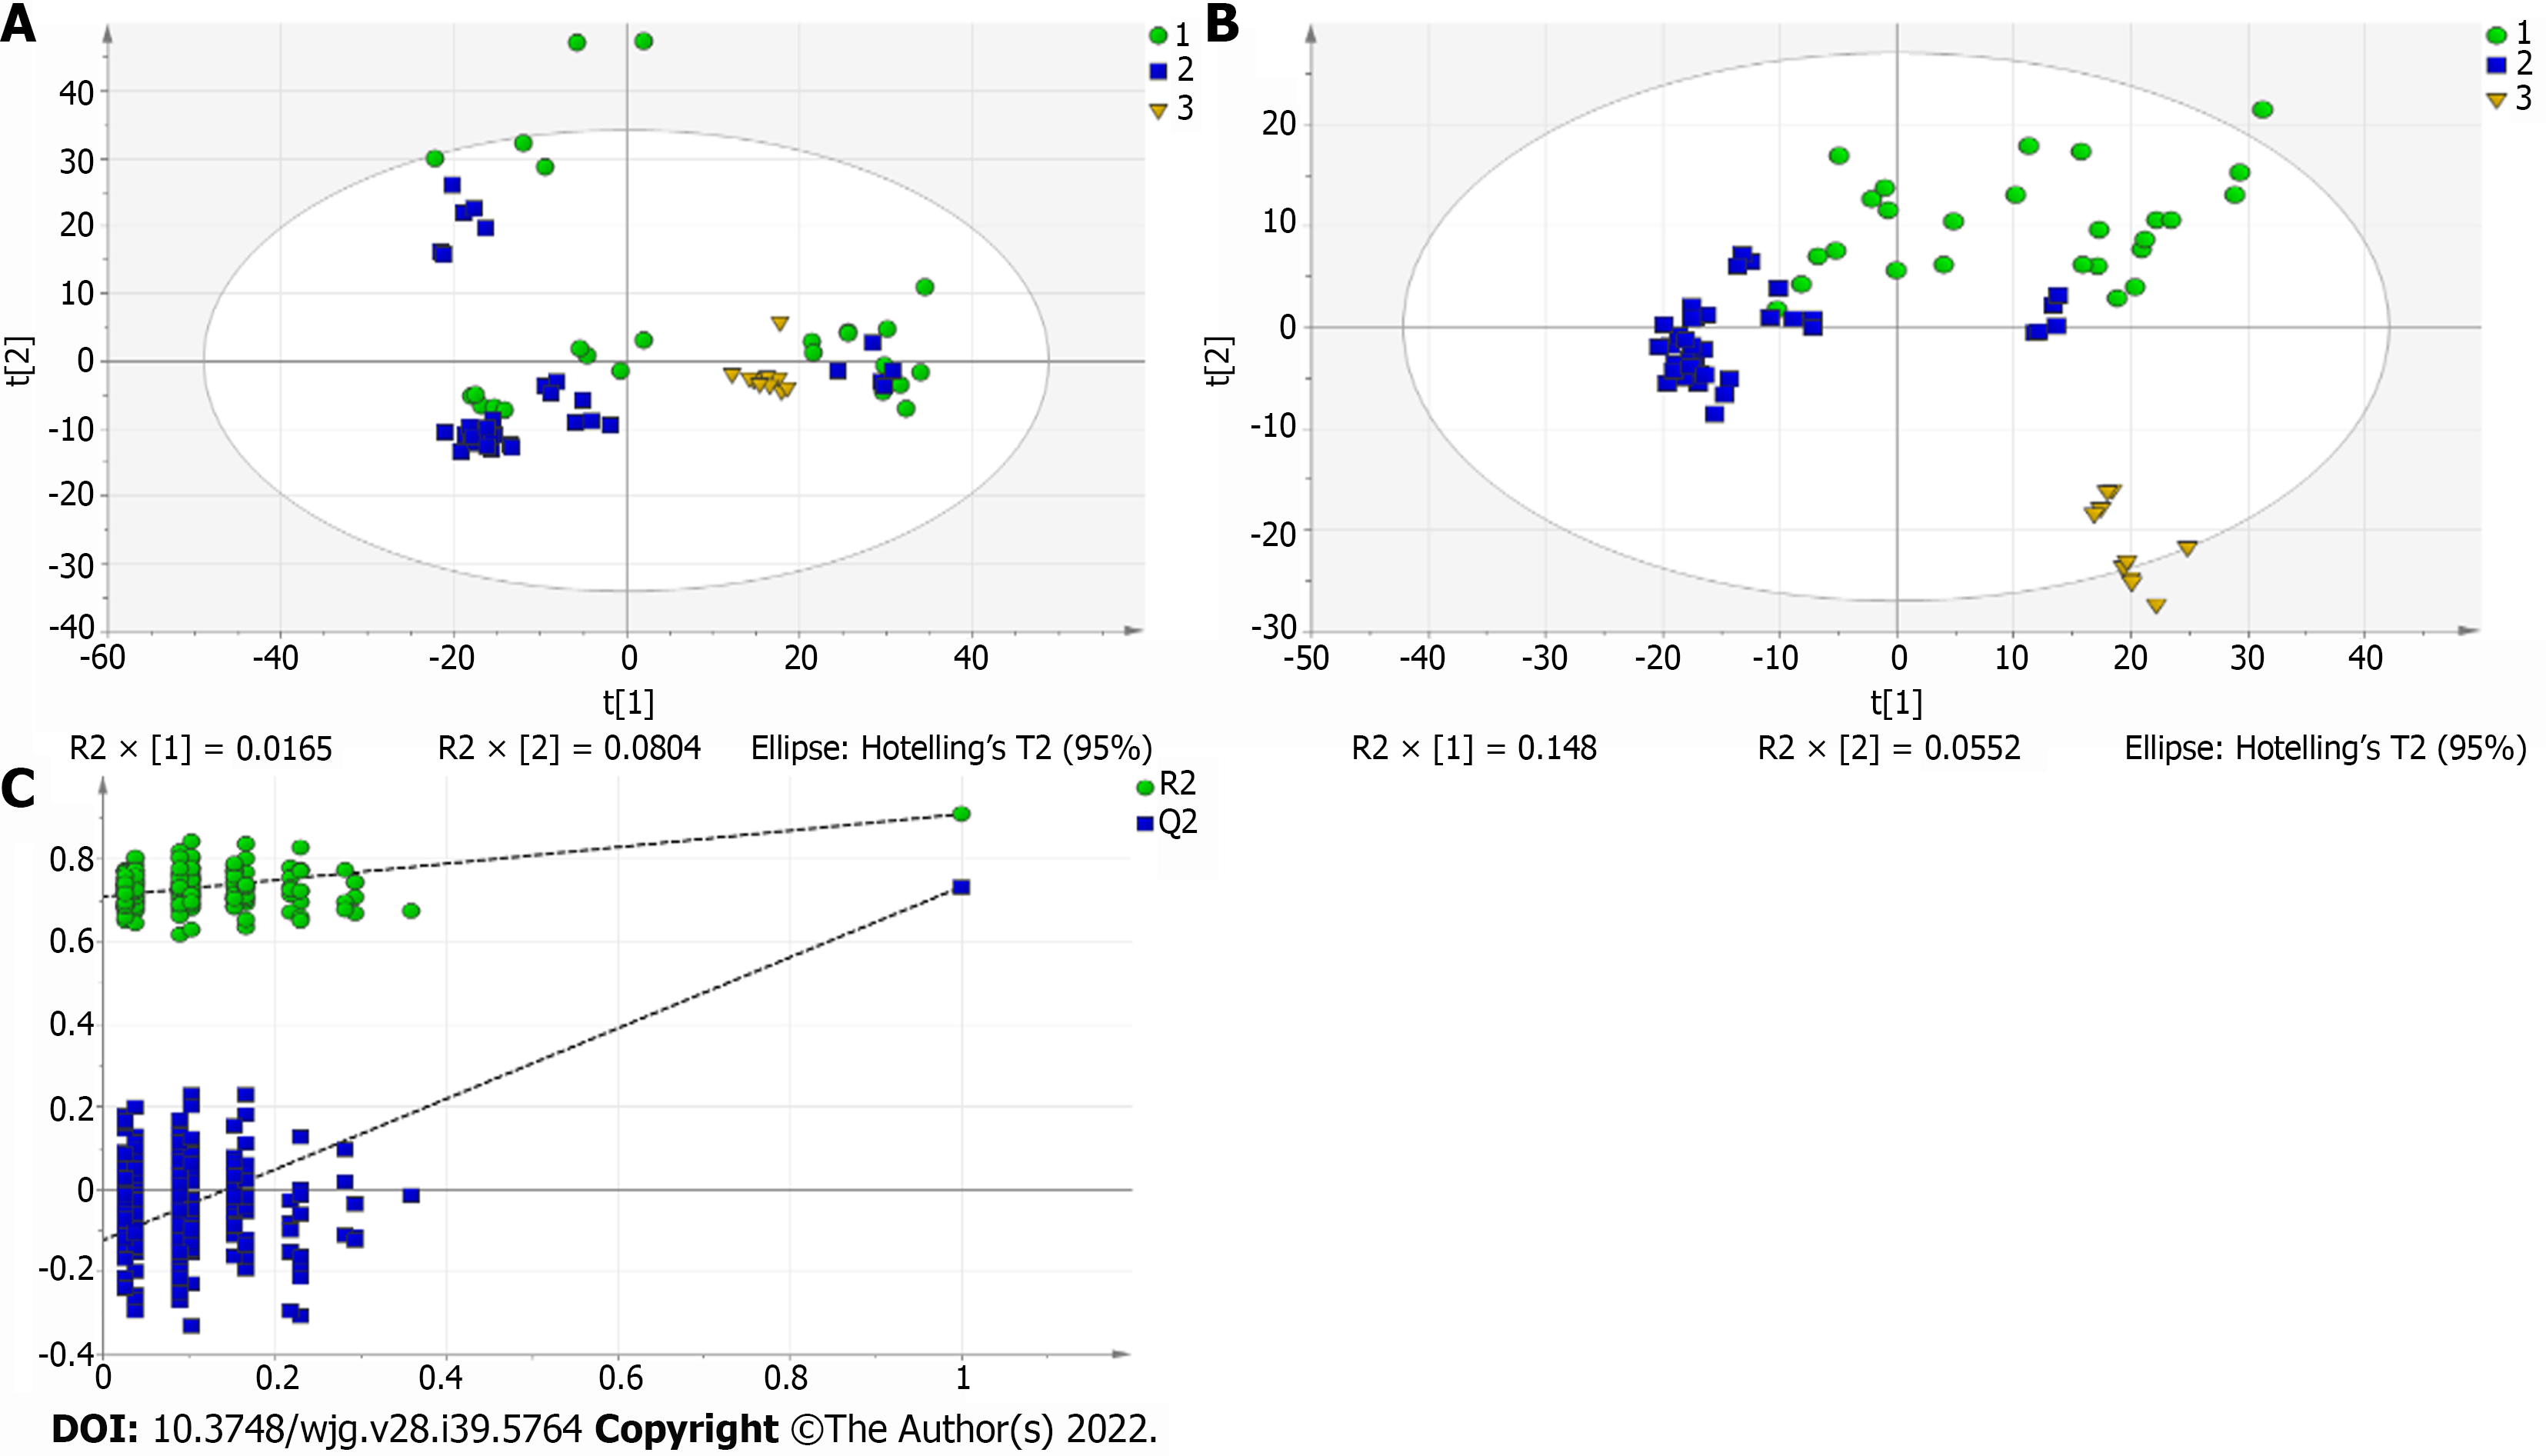
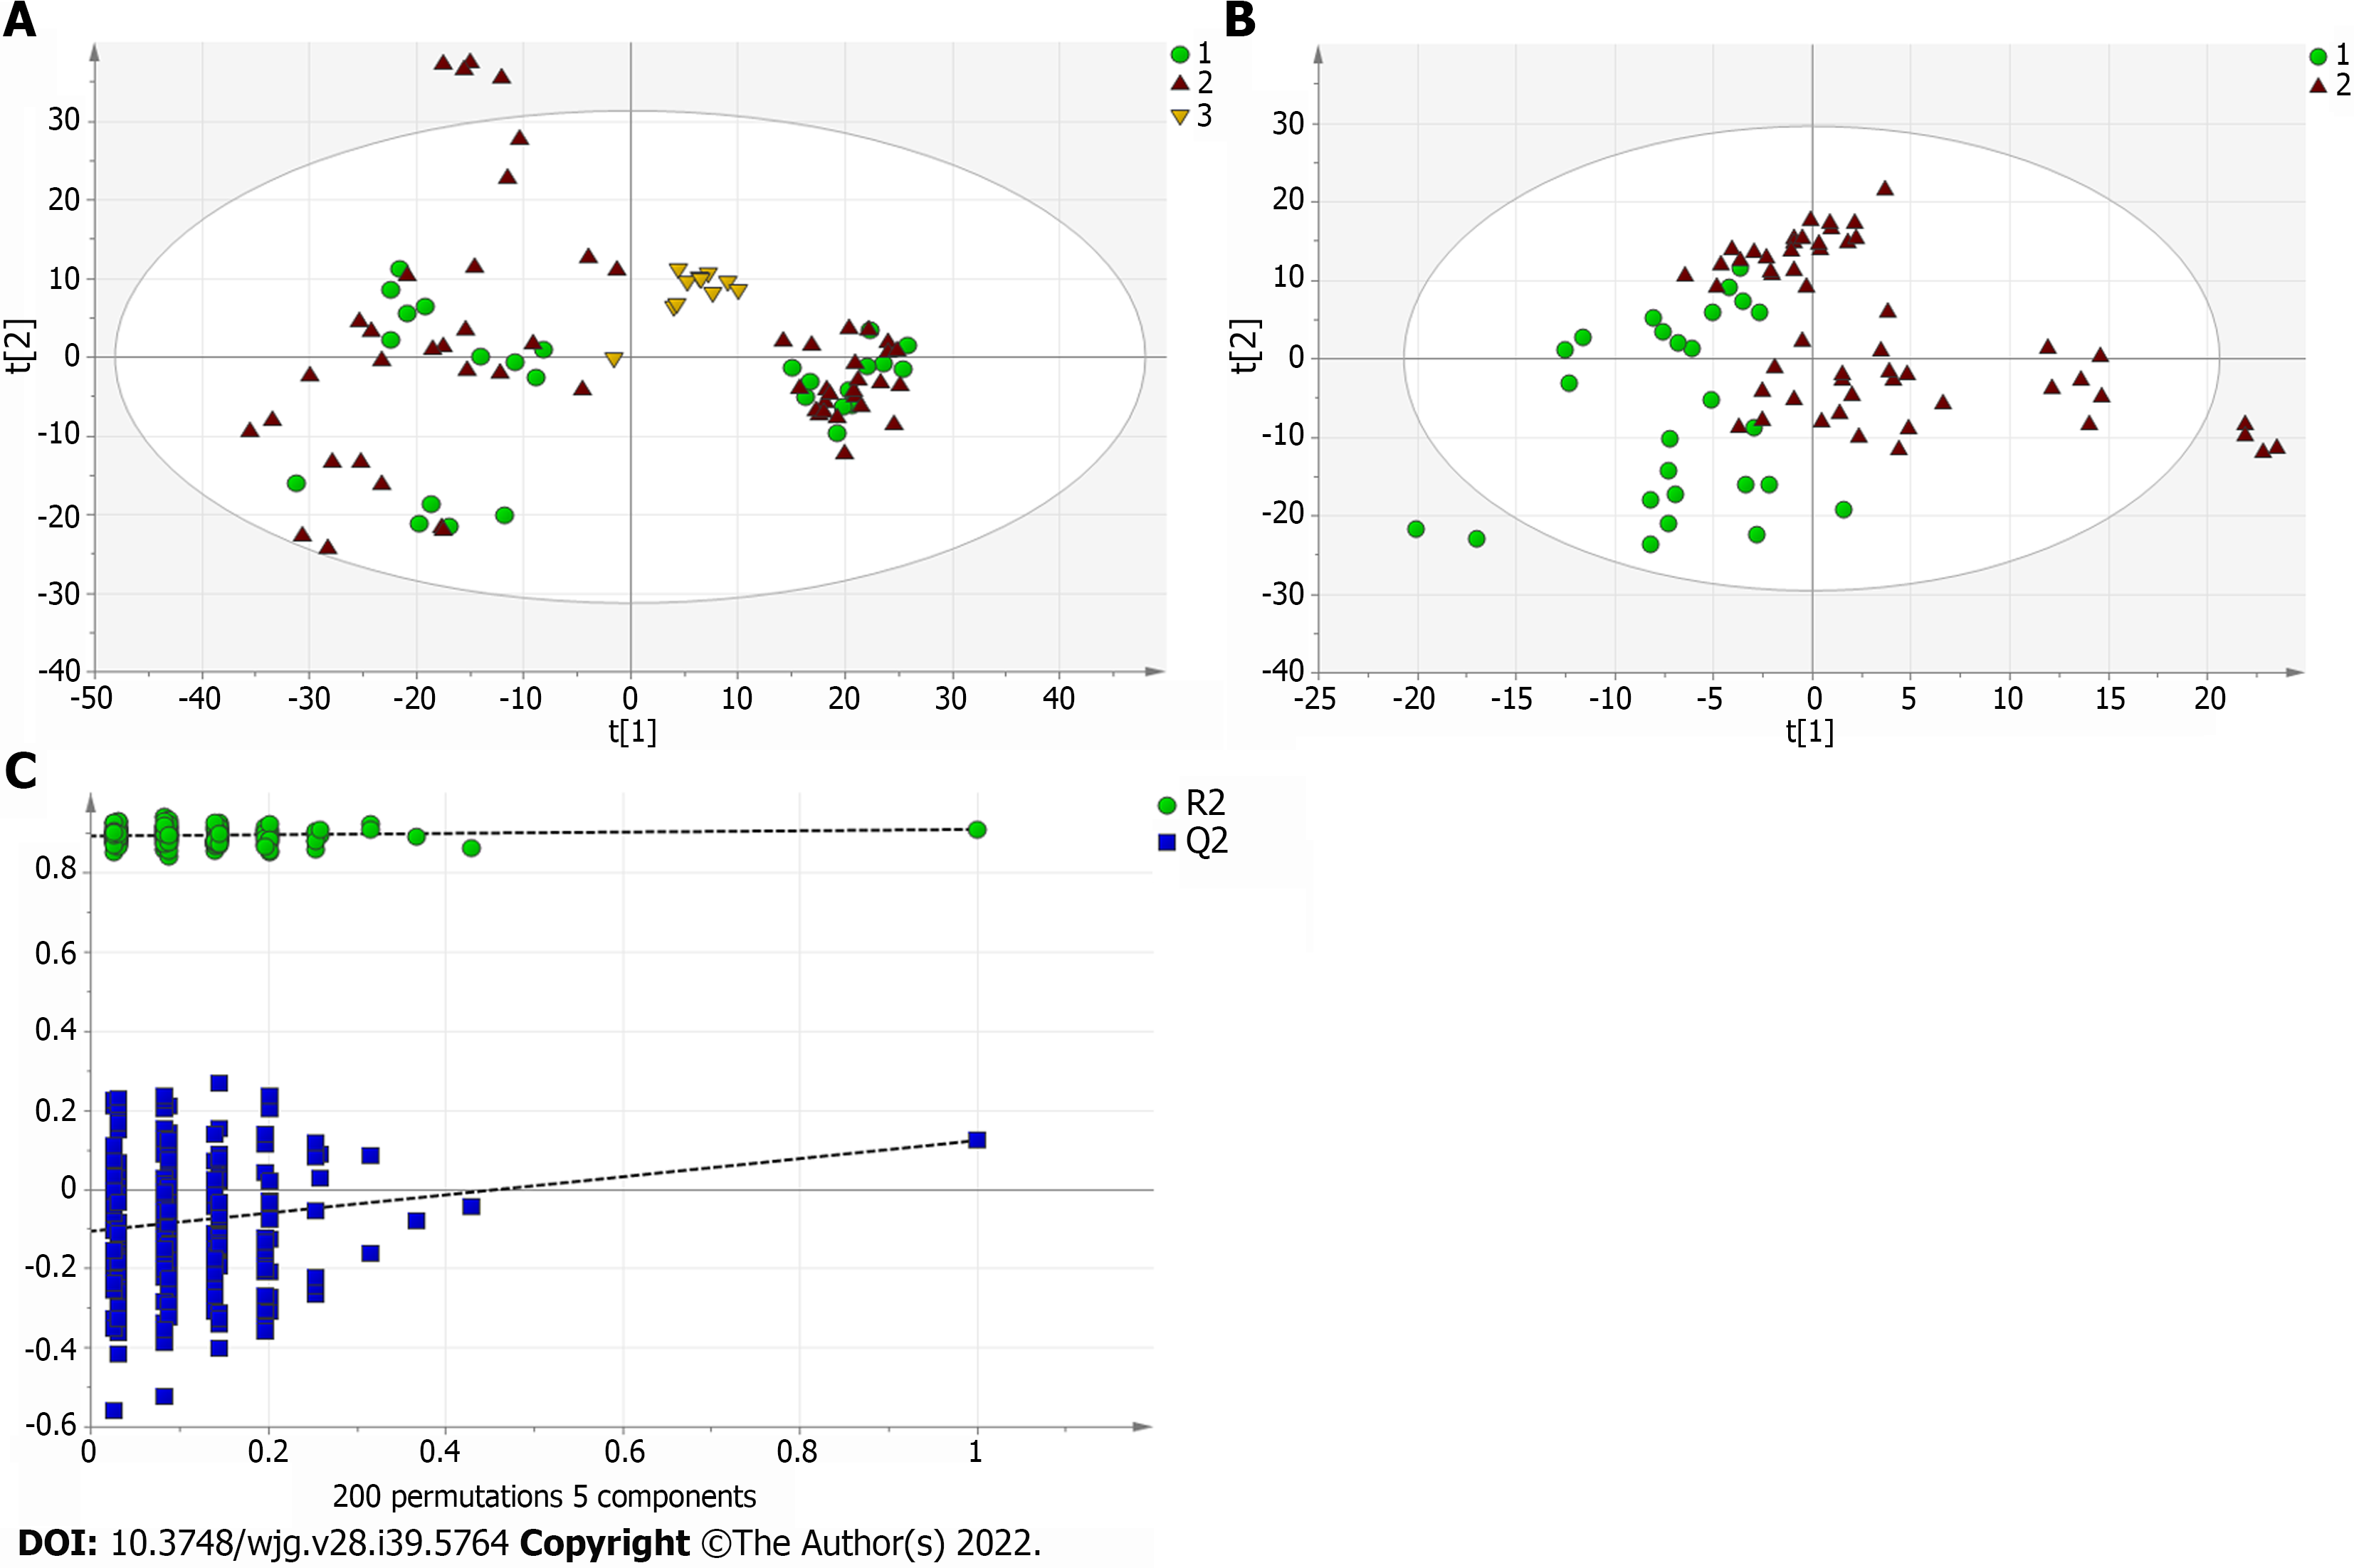
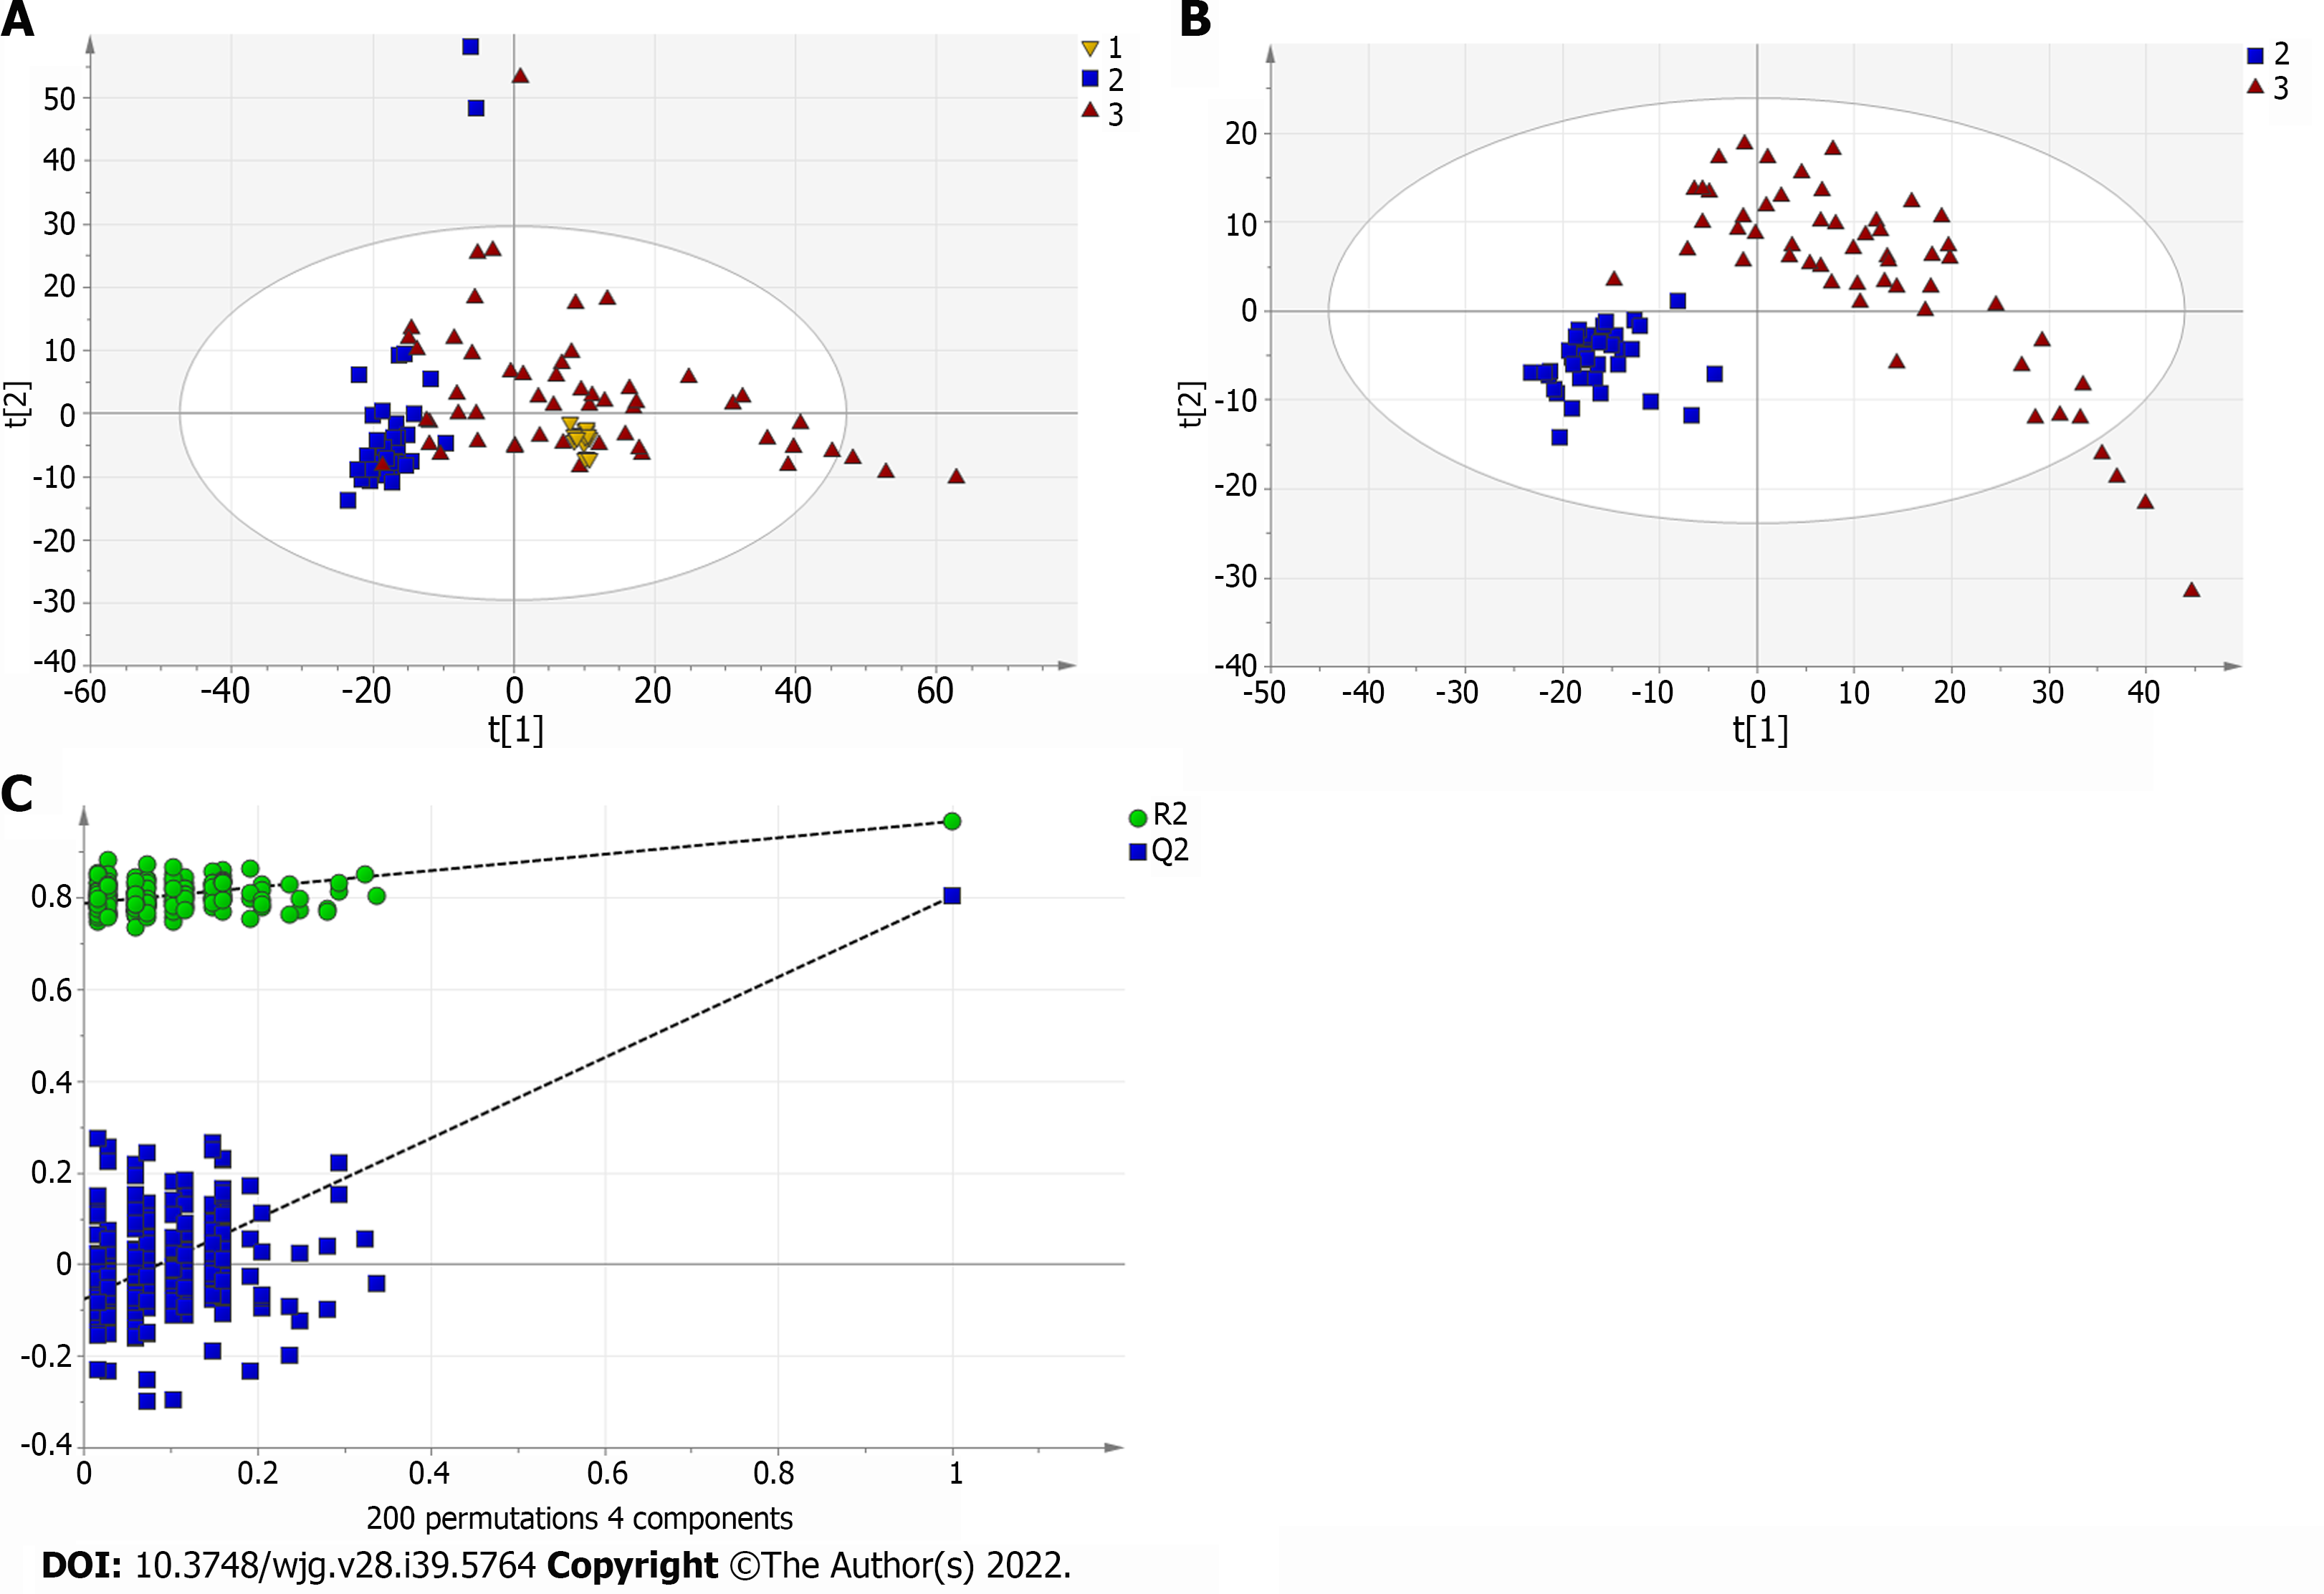
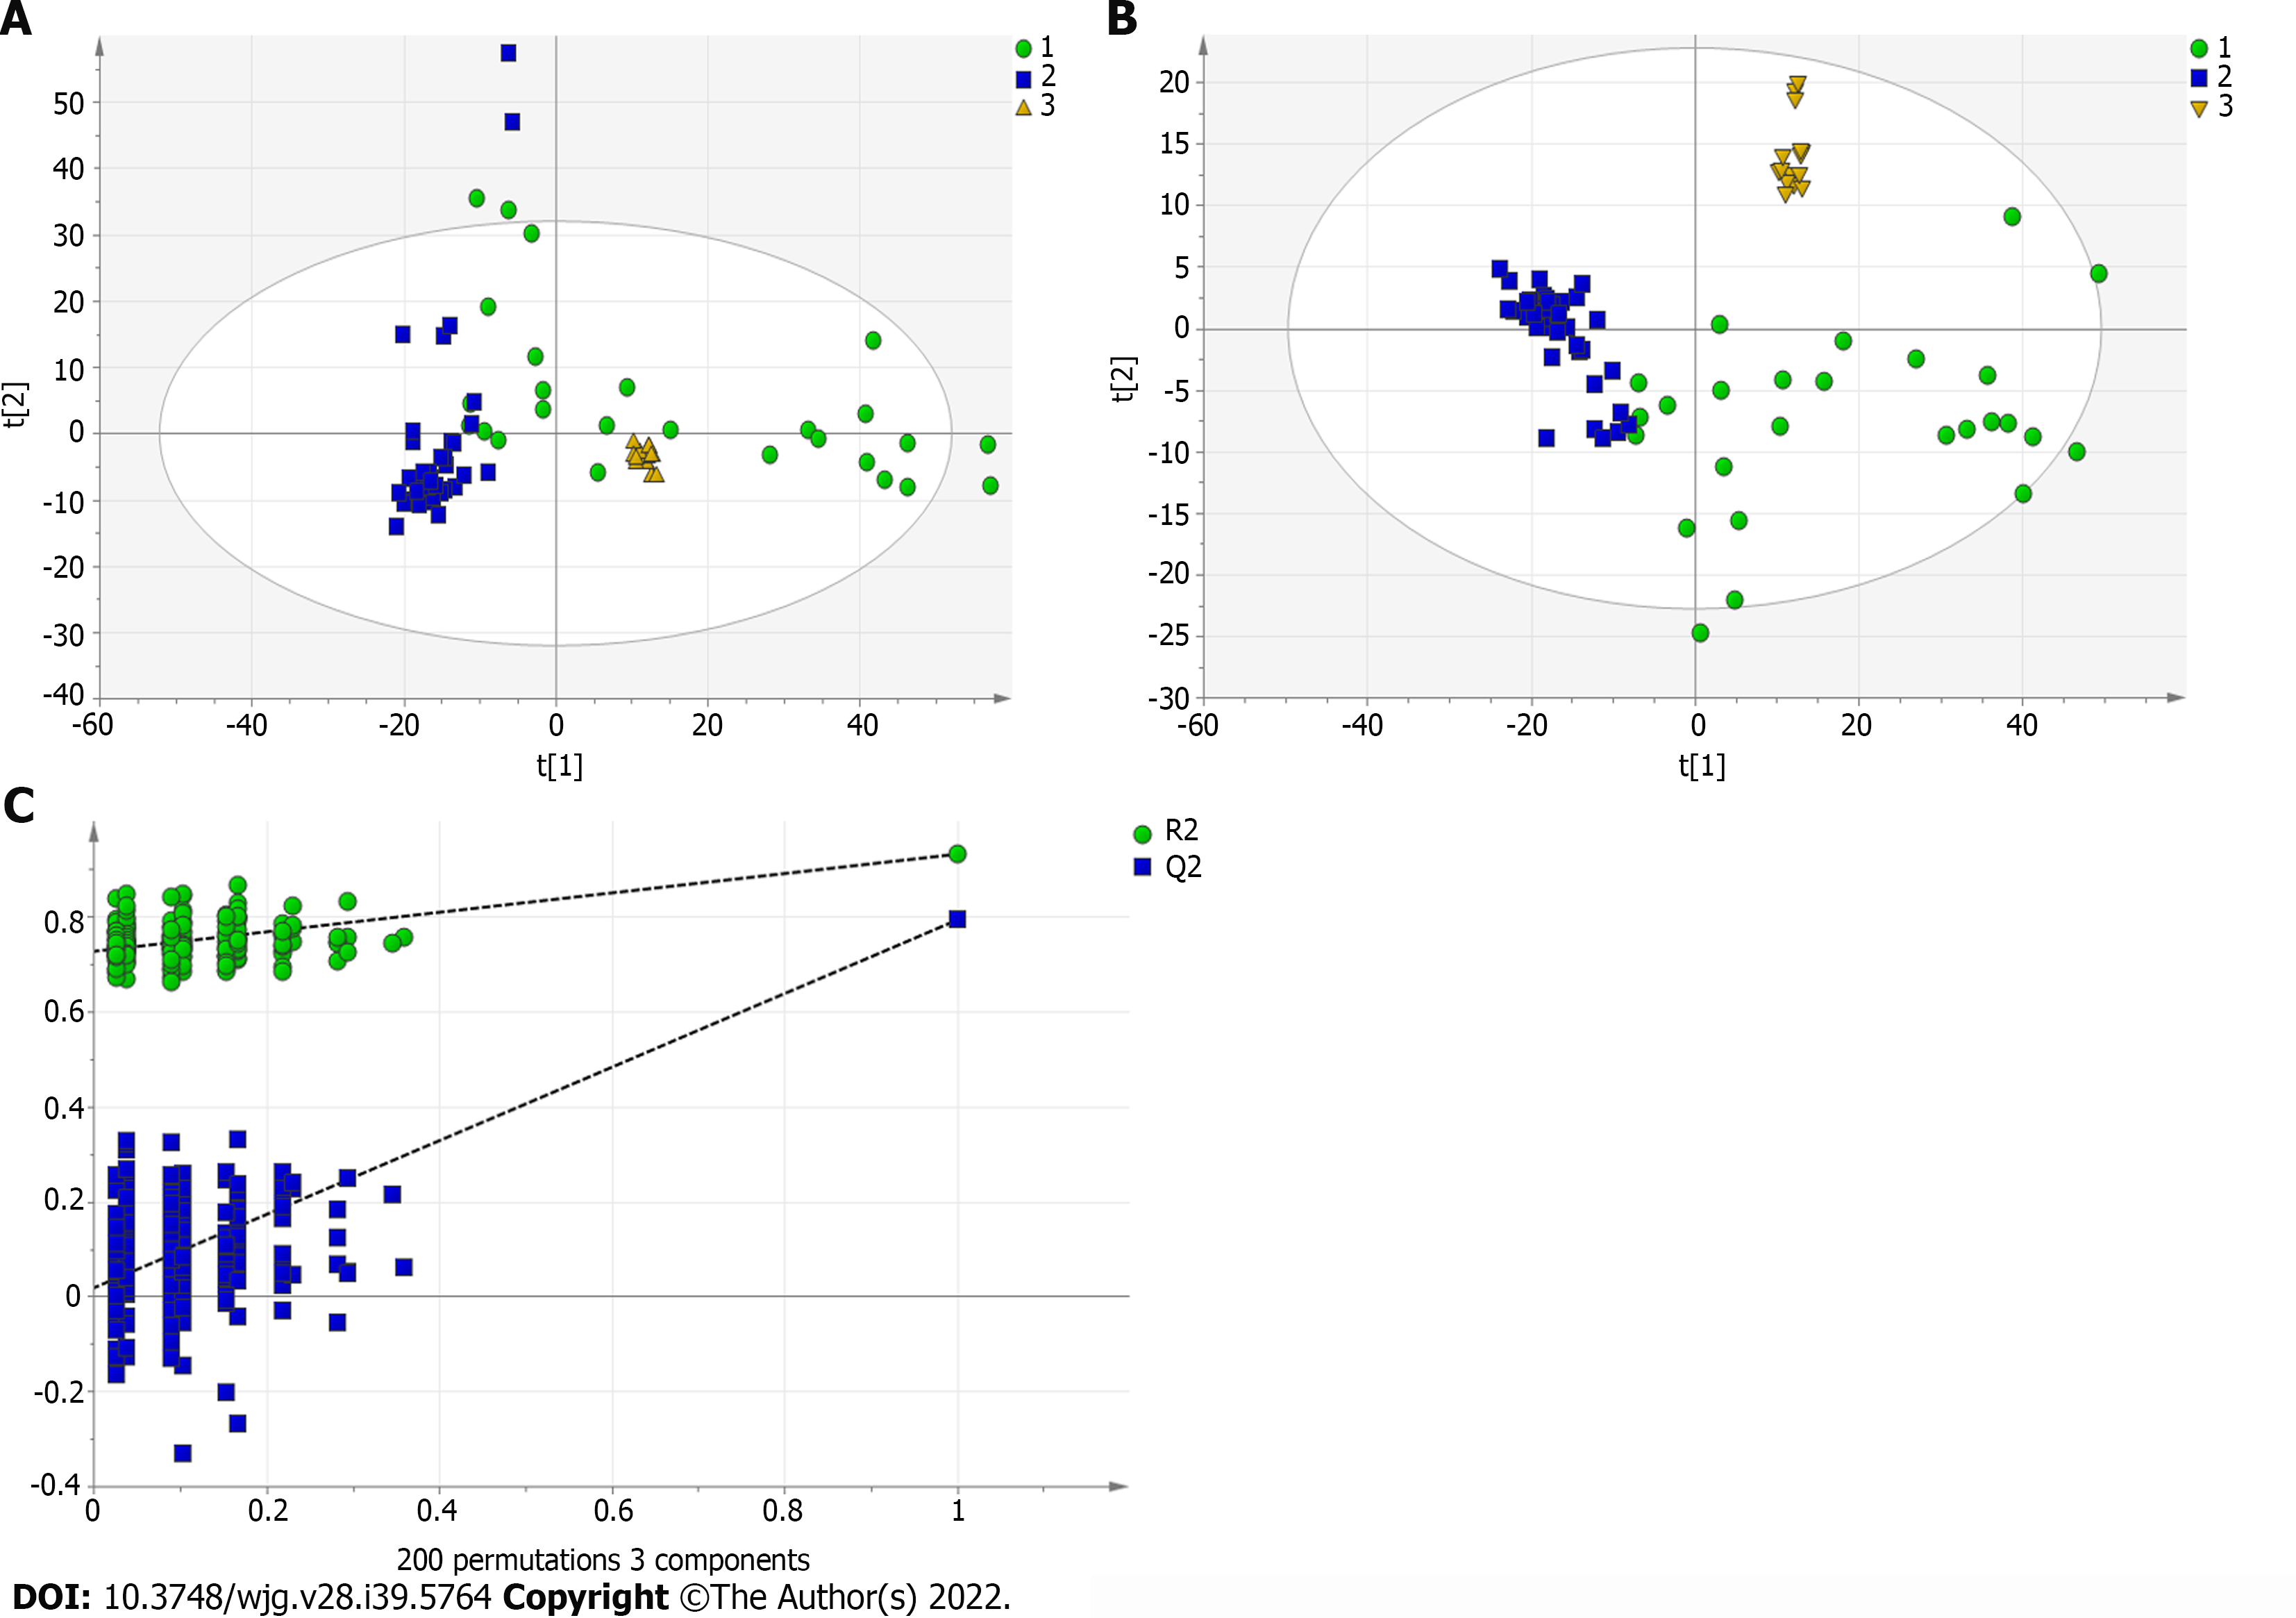
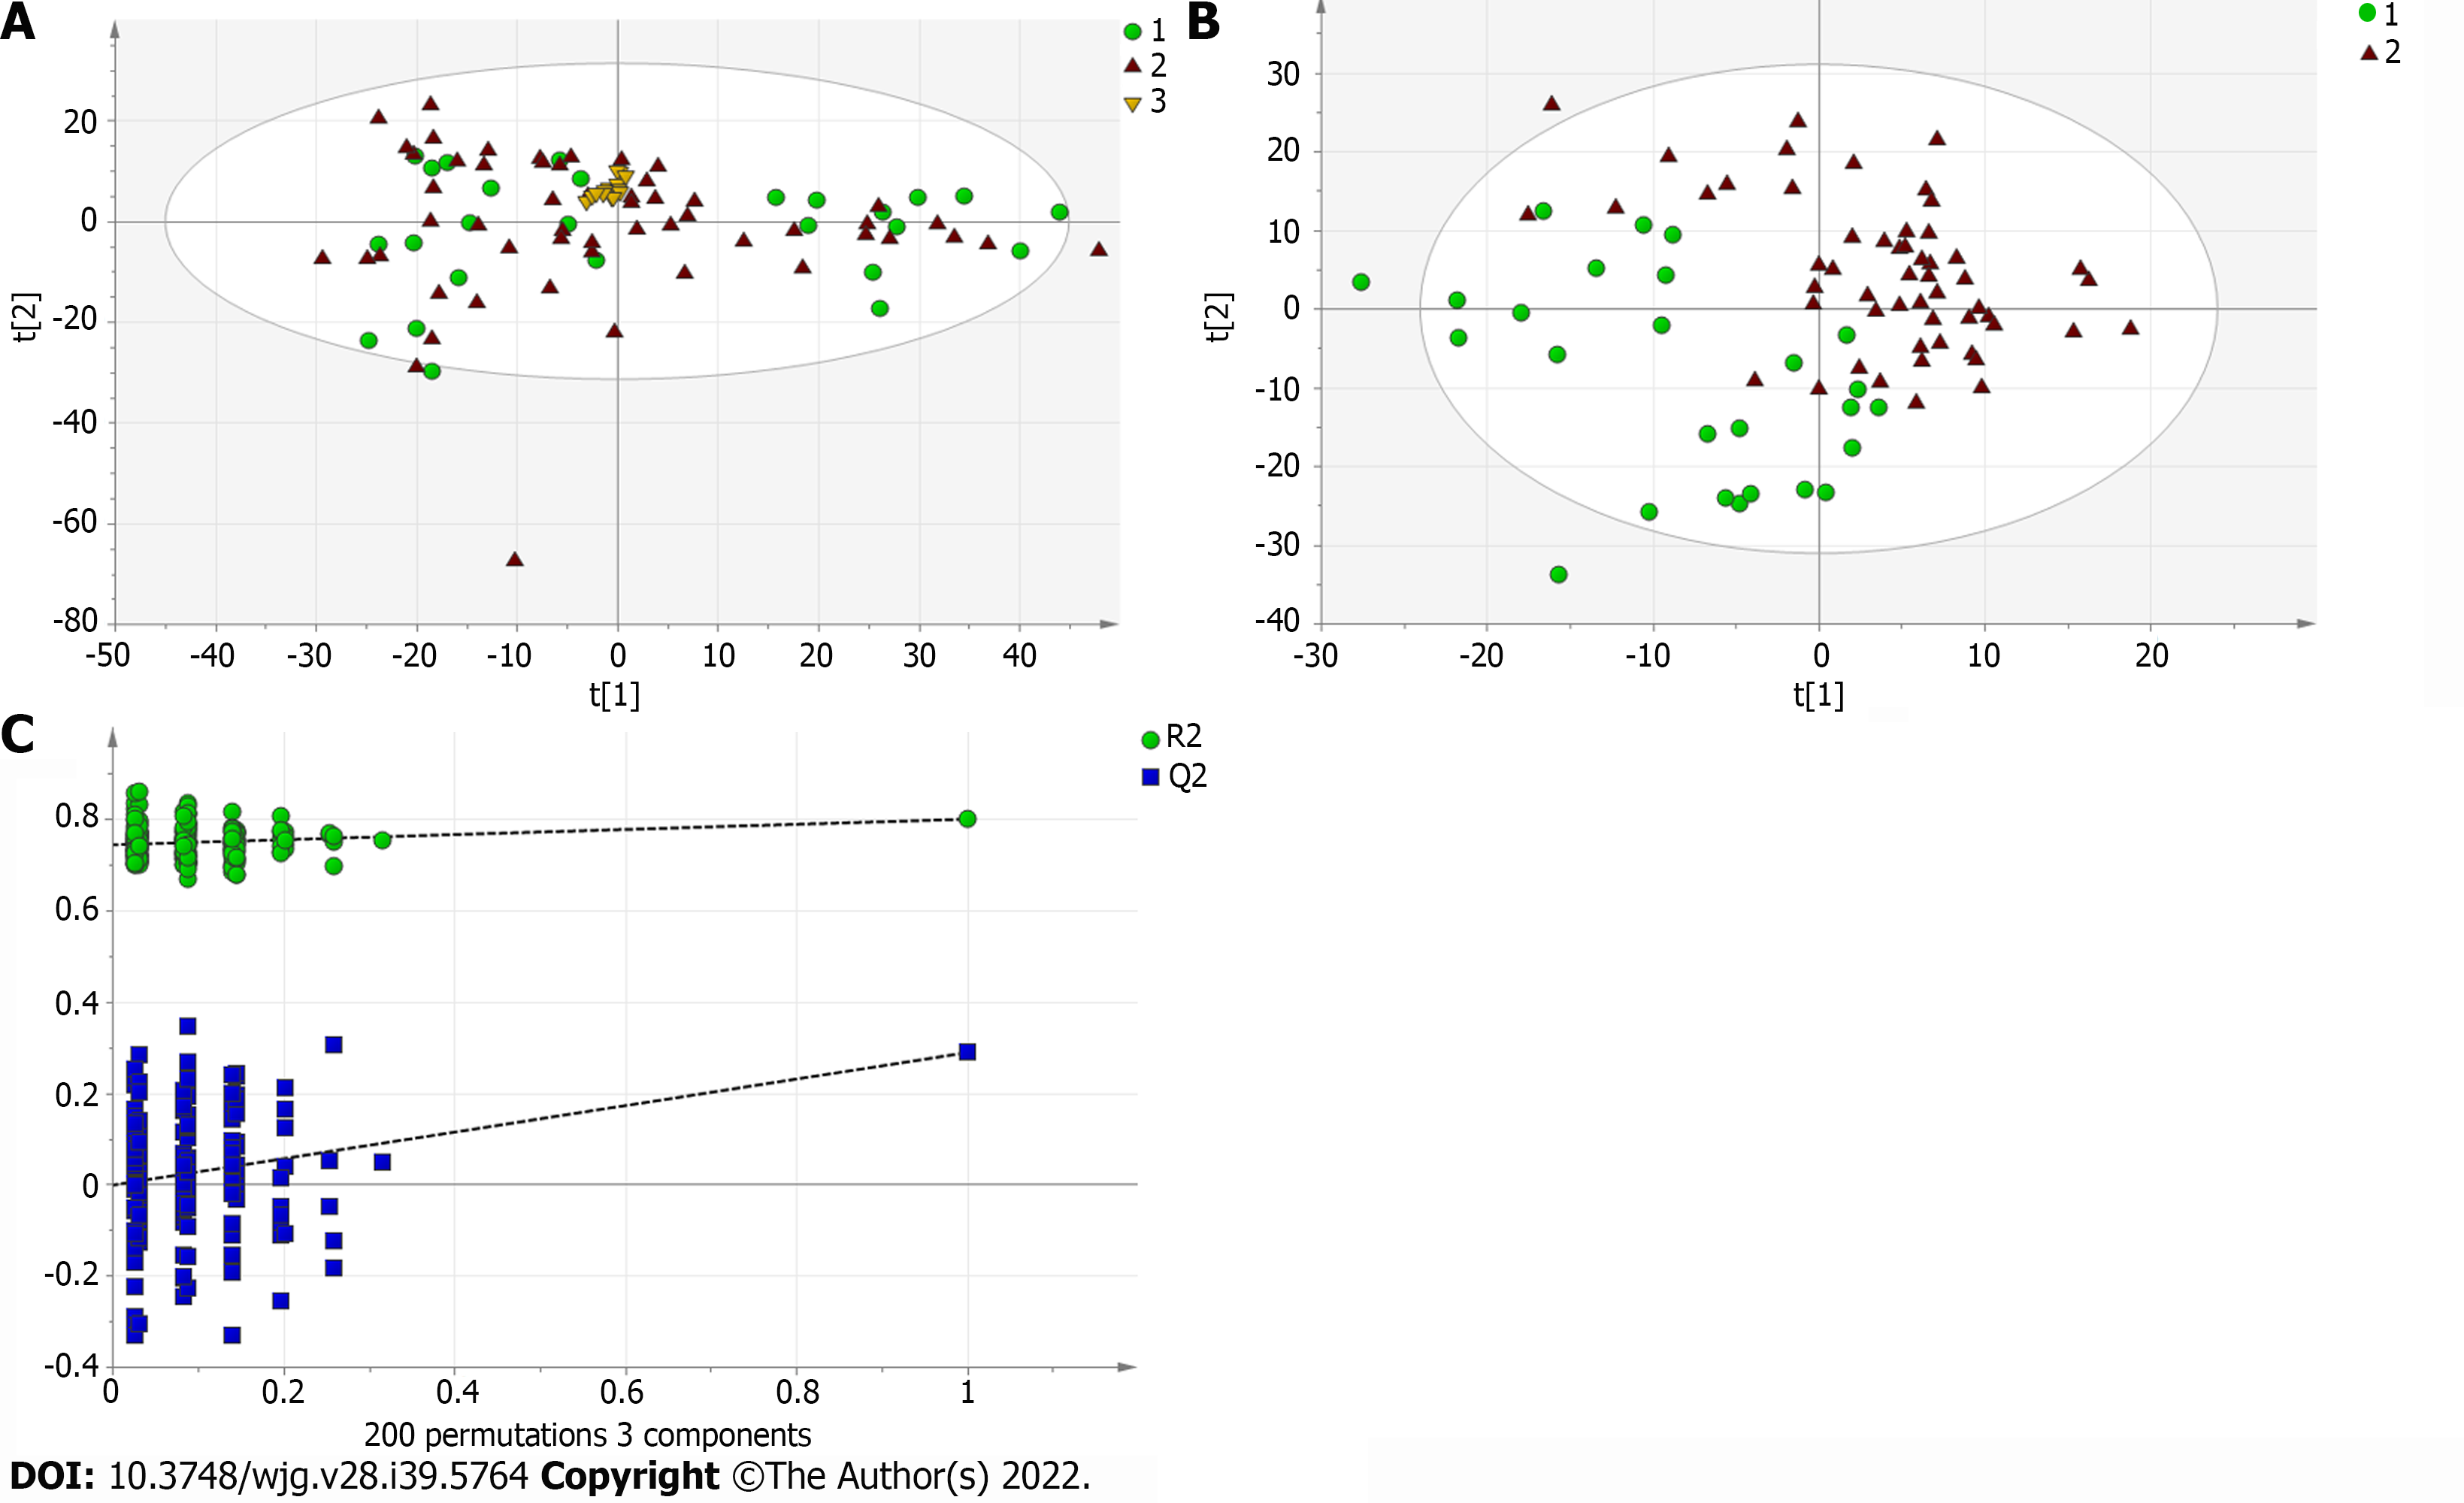
A total of 110 serum samples obtained from 54 patients with PBC, 26 patients with AIH, and 30 HCs were analyzed using UPLC-QTOF-MS in both positive and negative ion modes. As shown in Supplementary Figures 1 and 2, a typical base peak chromatogram was detected by MS in positive and negative ion modes, respectively. After the peaks were aligned, 1133 peaks of positive ions and 963 peaks of negative ions were identified using MassLynx and the same acquisition method. The data were transformed into SIMCA-P11 software for PCA. Plots of the PCA scores in positive and negative ion modes are illustrated in Figure 1A, Figure 2A, Figure 3A, Figure 4A, Figure 5A and Figure 6A. Distinct clustering was observed between PBC patients and HCs, and between AIH patients and HCs. No distinct clustering was found between PBC patients and AIH patients. The QC samples were tightly clustered (Figure 1A, Figure 2A, Figure 3A, Figure 4A, Figure 5A and Figure 6A), ensuring the repeatability of the information[13].
To find out the differentially expressed metabolites, P-values (P < 0.05) in the t-test were combined with variable importance in the projection (VIP) values in the PLS-DA model. The PLS-DA score charts are shown in Figure 1B, Figure 2B, Figure 3B, Figure 4B, Figure 5B and Figure 6B. We also conduct sorting verification on the model to check whether the model is "over-fitting". The results are shown in Figure 1C, Figure 2C, Figure 3C, Figure 4C, Figure 5C and Figure 6C. As can be seen from the sorting test figure, Figure 1C, Figure 2C, Figure 5C and Figure 6C, there is no "over-fitting" in these models. Figure 3C and Figure 4C show that the two models are "overfitted". We only established the discriminant analysis model of multivariate analysis between PBC/Control and AIH/Control, but failed to establish the discriminant analysis model of PBC/AIH. The PBC and AIH samples of the two groups overlaps on the PCA score plot (as shown in Figure 3A and Figure 6A), and the supervised PLS-DA (as shown in Figure 3B and Figure 6B) still failed to distinguish them significantly, indicating that there was little difference in metabolic profile between the two groups of different autoimmune liver diseases.
The METLIN metabolomics database (http://metlin.scripps.edu/) was used to facilitate metabolite annotation through MS analysis. The data of differentially expressed are presented in Tables 3 and 4. Fold-change (FC) was used to indicate changes in potential PBC- and AIH-specific biomarkers, and the chosen FC values were > 2 and < 0.5.
| Name | VIP | MZ | Time | PBC/control | |
| t-test | Fold change (P/C) | ||||
| ESI+ | |||||
| Taurodeoxycholic acid | 1.747 | 500.3033 | 10.598 | 0.001 | 8.146 |
| Glycodeoxycholate | 2.175 | 450.3207 | 12.146 | 0.000 | 4.558 |
| Tetracosahexaenoic acid | 1.100 | 357.2786 | 9.333 | 0.045 | 3.490 |
| Bilirubin | 1.511 | 585.2701 | 10.218 | 0.006 | 3.334 |
| Sphinganine | 1.953 | 302.3052 | 12.792 | 0.000 | 3.285 |
| Phytosphingosine | 2.482 | 318.2999 | 10.734 | 0.000 | 3.039 |
| L-Phenylalanine | 1.690 | 166.0860 | 2.037 | 0.002 | 0.372 |
| L-Proline | 1.194 | 116.0706 | 0.725 | 0.030 | 0.180 |
| 12-Ketodeoxycholic acid | 1.573 | 391.2842 | 15.210 | 0.004 | -0.324 |
| ESI- | |||||
| Taurocholic acid | 1.493 | 514.2805 | 9.146 | 0.000 | 6.634 |
| LysoPC [18:3(6Z, 9Z, 12Z)] | 1.184 | 516.3064 | 13.057 | 0.001 | 5.263 |
| Tauroursodeoxycholic acid | 1.843 | 498.2861 | 10.456 | 0.000 | 4.627 |
| Glycocholic Acid | 1.866 | 464.2988 | 9.957 | 0.000 | 3.644 |
| LysoPE [0:0/18:4 (6Z, 9Z, 12Z, 15Z)] | 1.316 | 472.2430 | 9.798 | 0.000 | 3.274 |
| LysoPE [20:3 (11Z, 14Z, 17Z)/0:0] | 1.882 | 500.2947 | 10.456 | 0.000 | 3.225 |
| L-Urobilinogen | 1.027 | 595.3478 | 11.784 | 0.003 | 3.202 |
| L-Urobilin | 1.032 | 593.3315 | 11.665 | 0.003 | 2.411 |
| Deoxycholic acid | 1.032 | 391.2833 | 11.641 | 0.003 | 2.121 |
| α-ketoisovaleric acid | 1.040 | 115.0399 | 1.831 | 0.003 | -0.348 |
| Pyroglutamic acid | 1.252 | 128.0350 | 0.931 | 0.000 | -0.392 |
| Lactic acid | 1.548 | 89.0242 | 0.938 | 0.000 | -0.402 |
| Hypoxanthine | 1.384 | 135.0308 | 0.886 | 0.000 | -0.431 |
| LysoPE [0:0/20:2 (11Z, 14Z)] | 1.335 | 504.3072 | 14.333 | 0.000 | -0.453 |
| Ketoleucine | 1.392 | 129.0555 | 4.110 | 0.000 | -0.486 |
| LysoPE [0:0/22:4 (7Z, 10Z, 13Z, 16Z)] | 1.333 | 528.2850 | 13.617 | 0.000 | -0.544 |
| MG [0:0/18:4 (6Z, 9Z, 12Z, 15Z)/0:0] | 2.060 | 349.2373 | 8.969 | 0.000 | -2.181 |
| Name | VIP | MZ | Time | AIH/control | |
| t-test | Fold change (A/C) | ||||
| ESI+ | |||||
| Taurodeoxycholic acid | 1.900 | 500.3033 | 10.598 | 0.000 | 8.791 |
| Glycodeoxycholate | 1.912 | 450.3207 | 12.146 | 0.000 | 5.217 |
| L-Urobilin | 1.442 | 595.3484 | 7.835 | 0.007 | 5.164 |
| Sphinganine | 2.308 | 302.3052 | 12.792 | 0.000 | 4.509 |
| Phytosphingosine | 2.344 | 318.2999 | 10.734 | 0.000 | 4.118 |
| I-Urobilin | 1.454 | 591.3169 | 7.628 | 0.006 | 3.661 |
| Bilirubin | 1.876 | 585.2701 | 10.218 | 0.000 | 3.578 |
| Kynurenine | 2.279 | 209.0919 | 1.944 | 0.000 | 0.592 |
| L-Threonine | 1.446 | 120.0655 | 0.708 | 0.007 | 0.386 |
| L-Phenylalanine | 1.551 | 166.0860 | 2.037 | 0.004 | 0.262 |
| Urea | 1.160 | 61.0395 | 0.730 | 0.032 | 0.113 |
| 12-Ketodeoxycholic acid | 1.125 | 391.2842 | 15.210 | 0.037 | -0.270 |
| Uric acid | 1.208 | 169.0354 | 1.035 | 0.025 | -0.265 |
| Pyroglutamic acid | 2.489 | 130.0499 | 1.029 | 0.000 | -0.517 |
| ESI- | |||||
| Taurocholic acid | 1.605 | 514.281 | 9.146 | 0.000 | 7.368 |
| LysoPC [18:3 (6Z, 9Z, 12Z)] | 1.454 | 516.306 | 13.057 | 0.000 | 6.614 |
| Tauroursodeoxycholic acid | 1.807 | 498.286 | 10.456 | 0.000 | 5.151 |
| Glycocholic Acid | 1.961 | 464.299 | 9.957 | 0.000 | 3.946 |
| LysoPE [20:3 (11Z, 14Z, 17Z)/0:0] | 1.807 | 500.295 | 10.456 | 0.000 | 3.670 |
| LysoPE [0:0/20:2 (11Z, 14Z)] | 1.234 | 504.307 | 14.333 | 0.001 | -0.471 |
| Lactic acid | 1.489 | 89.024 | 0.938 | 0.000 | -0.489 |
| Hypoxanthine | 1.380 | 135.031 | 0.886 | 0.000 | -0.562 |
| CPA (16:0/0:0) | 1.629 | 391.224 | 26.118 | 0.000 | -2.159 |
| MG [0:0/18:4 (6Z, 9Z, 12Z, 15Z)/0:0] | 1.771 | 349.237 | 8.969 | 0.000 | -2.464 |
As presented in Table 3 the levels of 17 of 26 potential biomarkers identified were elevated in the serum samples of patients with PBC, while the levels of 9 of these 26 potential biomarkers were reduced in the serum samples of patients with PBC compared with those in HCs. Among these biomarkers, the levels of TDCA, GUDCA, tetracosahexaenoic acid, bilirubin, sphinganine, phytosphingosine, L-phenylalanine, L-proline, TCA, LysoPC [18:3 (6Z, 9Z, 12Z)], TUDCA, GCA, LysoPE [0:0/18:4 (6Z, 9Z, 12Z, 15Z)], LysoPE [20:3 (11Z, 14Z, 17Z)/0:0], L-urobilinogen, L-urobilin, and DCA significantly increased in patients with PBC compared with those in HCs (P < 0.5). The levels of 12-ketodeoxycholic acid, α-ketoisovaleric acid, pyroglutamic acid, lactic acid, hypoxanthine, LysoPE [0:0/20:2 (11Z, 14Z)], ketoleucine, LysoPE [0:0/22:4 (7Z, 10Z, 13Z, 16Z)], and MG [0:0/18:4 (6Z, 9Z, 12Z, 15Z)/0:0] in patients with PBC were significantly reduced compared with those in HCs.
As shown in Table 4. The levels of 17 of 25 potential biomarkers identified were elevated in the serum samples of the patients with AIH, while the levels of 8 of these 25 potential biomarkers were reduced in the serum samples of patients with AIH compared with those in HCs. Among these biomarkers, the levels of TDCA, GUDCA, L-Urobilin, sphinganine, phytosphingosine, I-Urobilin, bilirubin, stearamide, kynurenine, L-threonine, L-phenylalanine, urea, TCA, LysoPC [18:3 (6Z, 9Z, 12Z)], TDCA, GCA, and LysoPE [20:3 (11Z, 14Z, 17Z)/0:0] significantly increased in patients with AIH compared with those in HCs. The levels of 12-ketodeoxycholic acid, uric acid, pyroglutamic acid, LysoPE [0:0/20:2 (11Z, 14Z)], lactic acid, pyroglutamic acid, hypoxanthine, CPA (16:0/0:0), and MG [0:0/18:4 (6Z, 9Z, 12Z, 15Z)/0:0] significantly decreased in patients with AIH compared with those in HCs.
Recently, BAs have been shown to be potentially more effective biomarkers for PBC and AIH. Regarding the most abundant BAs in humans, the following 15 BAs were selected: CA, GCA, TCA, UDCA, GUDCA, TUDCA, CDCA, GCDCA, TCDCA, GCDCS, DCA, GDCA, TDCA, LCA, and TLCA. The levels of these 15 BAs were measured using the UPLC-QTOF-MS. The levels of all BAs in the disease group were higher than those in the control group, and the levels of glycine-bound cholic acid and tauro-bound cholic acid were elevated, shown in Supplementary Table 1.
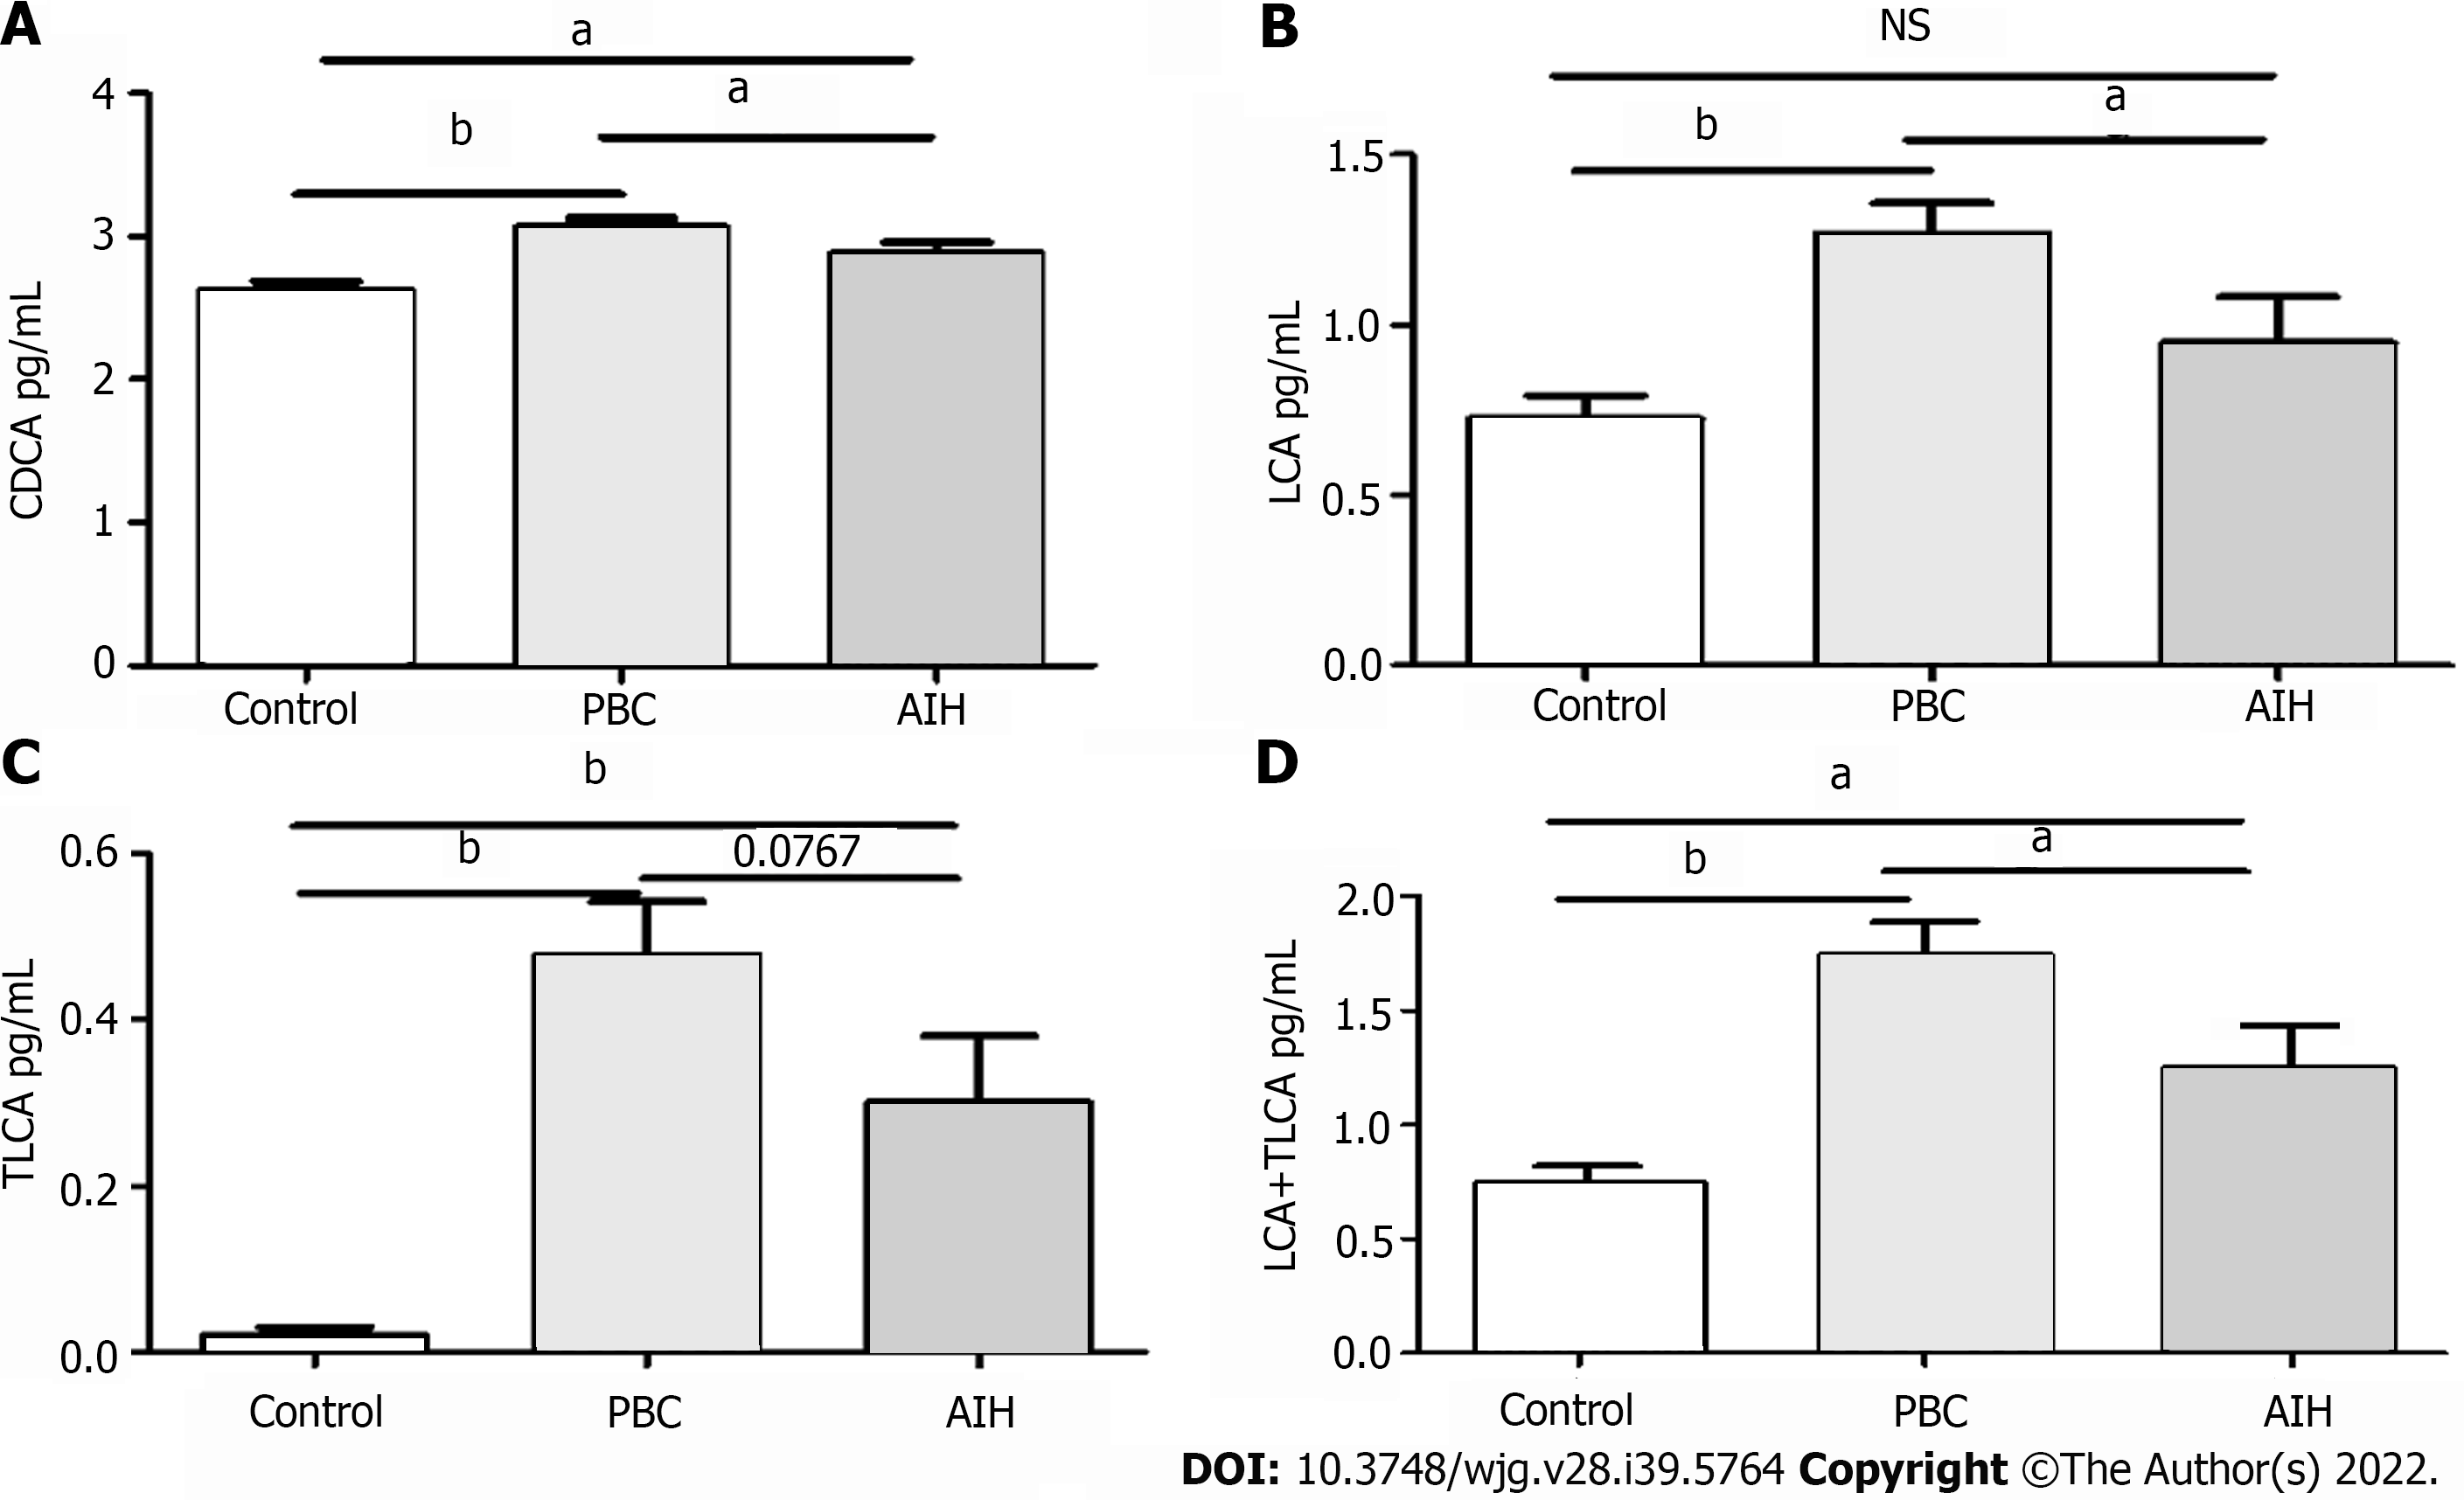
Furthermore, the levels of BAs in patients with PBC and AIH were compared with the corresponding levels in HCs, show in Table 5. It was revealed that the levels of BAs were elevated in patients with PBC and AIH. The levels of CDCA, LCA, TLCA, and LCA + TLCA in PBC patients were higher than those in AIH patients, in which a significant difference was found in the levels of CDCA and LCA (P < 0.05; for TLCA, P = 0.0767).The differences in the levels of CDCA, LCA, and LCA + TLCA among the three groups were statistically show in Figure 7. The levels of CDCA, LCA, and LCA + TLCA significantly increased in PBC patients compared with those in AIH patients (P < 0.05). Moreover, the CDCA-to-CA ratio decreased in PBC and AIH patients compared with that in HCs.
| AIH (mean ± SD) | PBC (mean ± SD) | Control (mean ± SD) | PBC/AIH | AIH/control | PBC/control | |
| P value | P value | P value | ||||
| CA | 2.38 ± 0.69 | 2.26 ± 0.85 | 1.60 ± 0.51 | 0.53 | < 0.001b | < 0.001a |
| GCA | 3.00 ± 1.02 | 2.91 ± 0.91 | 1.33 ± 0.50 | 0.69 | < 0.001b | < 0.001a |
| TCA | 2.12 ± 1.23 | 2.12 ± 0.93 | 0.03 ± 0.46 | 0.99 | < 0.001b | < 0.001a |
| UDCA | 2.41 ± 1.03 | 2.60 ± 1.05 | 2.05 ± 0.36 | 0.62 | 0.2 | 0.01a |
| GUDCA | 2.59 ± 1.17 | 3.04 ± 1.14 | 1.64 ± 0.50 | 0.09 | < 0.001b | < 0.001a |
| TUDCA | 1.48 ± 1.07 | 1.84 ± 1.09 | 0.13 ± 0.25 | 0.15 | < 0.001b | < 0.001a |
| CDCA | 2.88 ± 0.39 | 3.07 ± 0.48 | 2.63 ± 0.38 | 0.046c | 0.01b | < 0.001a |
| GCDCA | 3.78 ± 0.80 | 3.79 ± 0.67 | 2.93 ± 0.33 | 0.96 | < 0.001b | < 0.001a |
| TCDCA | 2.73 ± 0.40 | 2.84 ± 0.44 | 2.49 ± 0.57 | 0.27 | 0.09 | 0.004a |
| GCDCS | 2.39 ± 0.82 | 2.42 ± 0.70 | 1.08 ± 0.39 | 0.95 | < 0.001b | < 0.001a |
| DCA | 2.76 ± 0.35 | 2.75 ± 0.40 | 2.76 ± 0.18 | 0.87 | 0.7 | 0.59 |
| GDCA | 3.18 ± 0.58 | 3.14 ± 0.53 | 2.64 ± 0.32 | 0.8 | < 0.001b | < 0.001a |
| TDCA | 3.32 ± 0.64 | 3.16 ± 0.50 | 2.57 ± 0.19 | 0.33 | < 0.001b | < 0.001a |
| LCA | 0.94 ± 0.68 | 1.28 ± 0.66 | 0.72 ± 0.43 | 0.04c | 0.14 | < 0.001a |
| TLCA | 0.30 ± 0.41 | 0.48 ± 0.47 | 0.02 ± 0.06 | 0.07 | < 0.001b | < 0.001a |
| LCA + TLCA | 1.25 ± 0.18 | 1.75 ± 0.14 | 0.74 ± 0.07 | 0.034c | 0.031b | < 0.001a |
| CDCA/CA | 1.30 ± 0.35 | 1.56 ± 0.65 | 1.74 ± 0.42 | 0.26 | < 0.001b | < 0.001a |
| pBA | 3.11 ± 0.45 | 3.17 ± 0.51 | 2.67 ± 0.38 | 0.98 | < 0.001b | < 0.001a |
| sBA | 3.14 ± 0.52 | 3.19 ± 0.61 | 2.87 ± 0.17 | 0.75 | 0.003b | 0.002a |
| pBA/sBA | 1.02 ± 0.18 | 1.01 ± 0.17 | 1.08 ± 0.13 | 0.85 | 0.087 | < 0.001 |
| sBA | 2.77 ± 0.35 | 2.79 ± 0.40 | 2.77 ± 0.18 | 0.81 | 0.02b | 0.003a |
| G-BA | 4.14 ± 0.70 | 4.12 ± 0.64 | 3.16 ± 0.31 | 0.97 | < 0.001b | < 0.001a |
| T-BA | 3.58 ± 0.54 | 3.47 ± 0.46 | 2.89 ± 0.27 | 0.34 | < 0.001b | < 0.001a |
| G-BA/T-BA | 0.55 ± 0.34 | 0.65 ± 0.34 | 0.27 ± 0.30 | 0.25 | < 0.001b | < 0.001a |
| total BA | 36.31 ± 6.00 | 37.69 ± 7.40 | 24.80 ± 3.12 | 0.41 | < 0.001b | 0.026a |
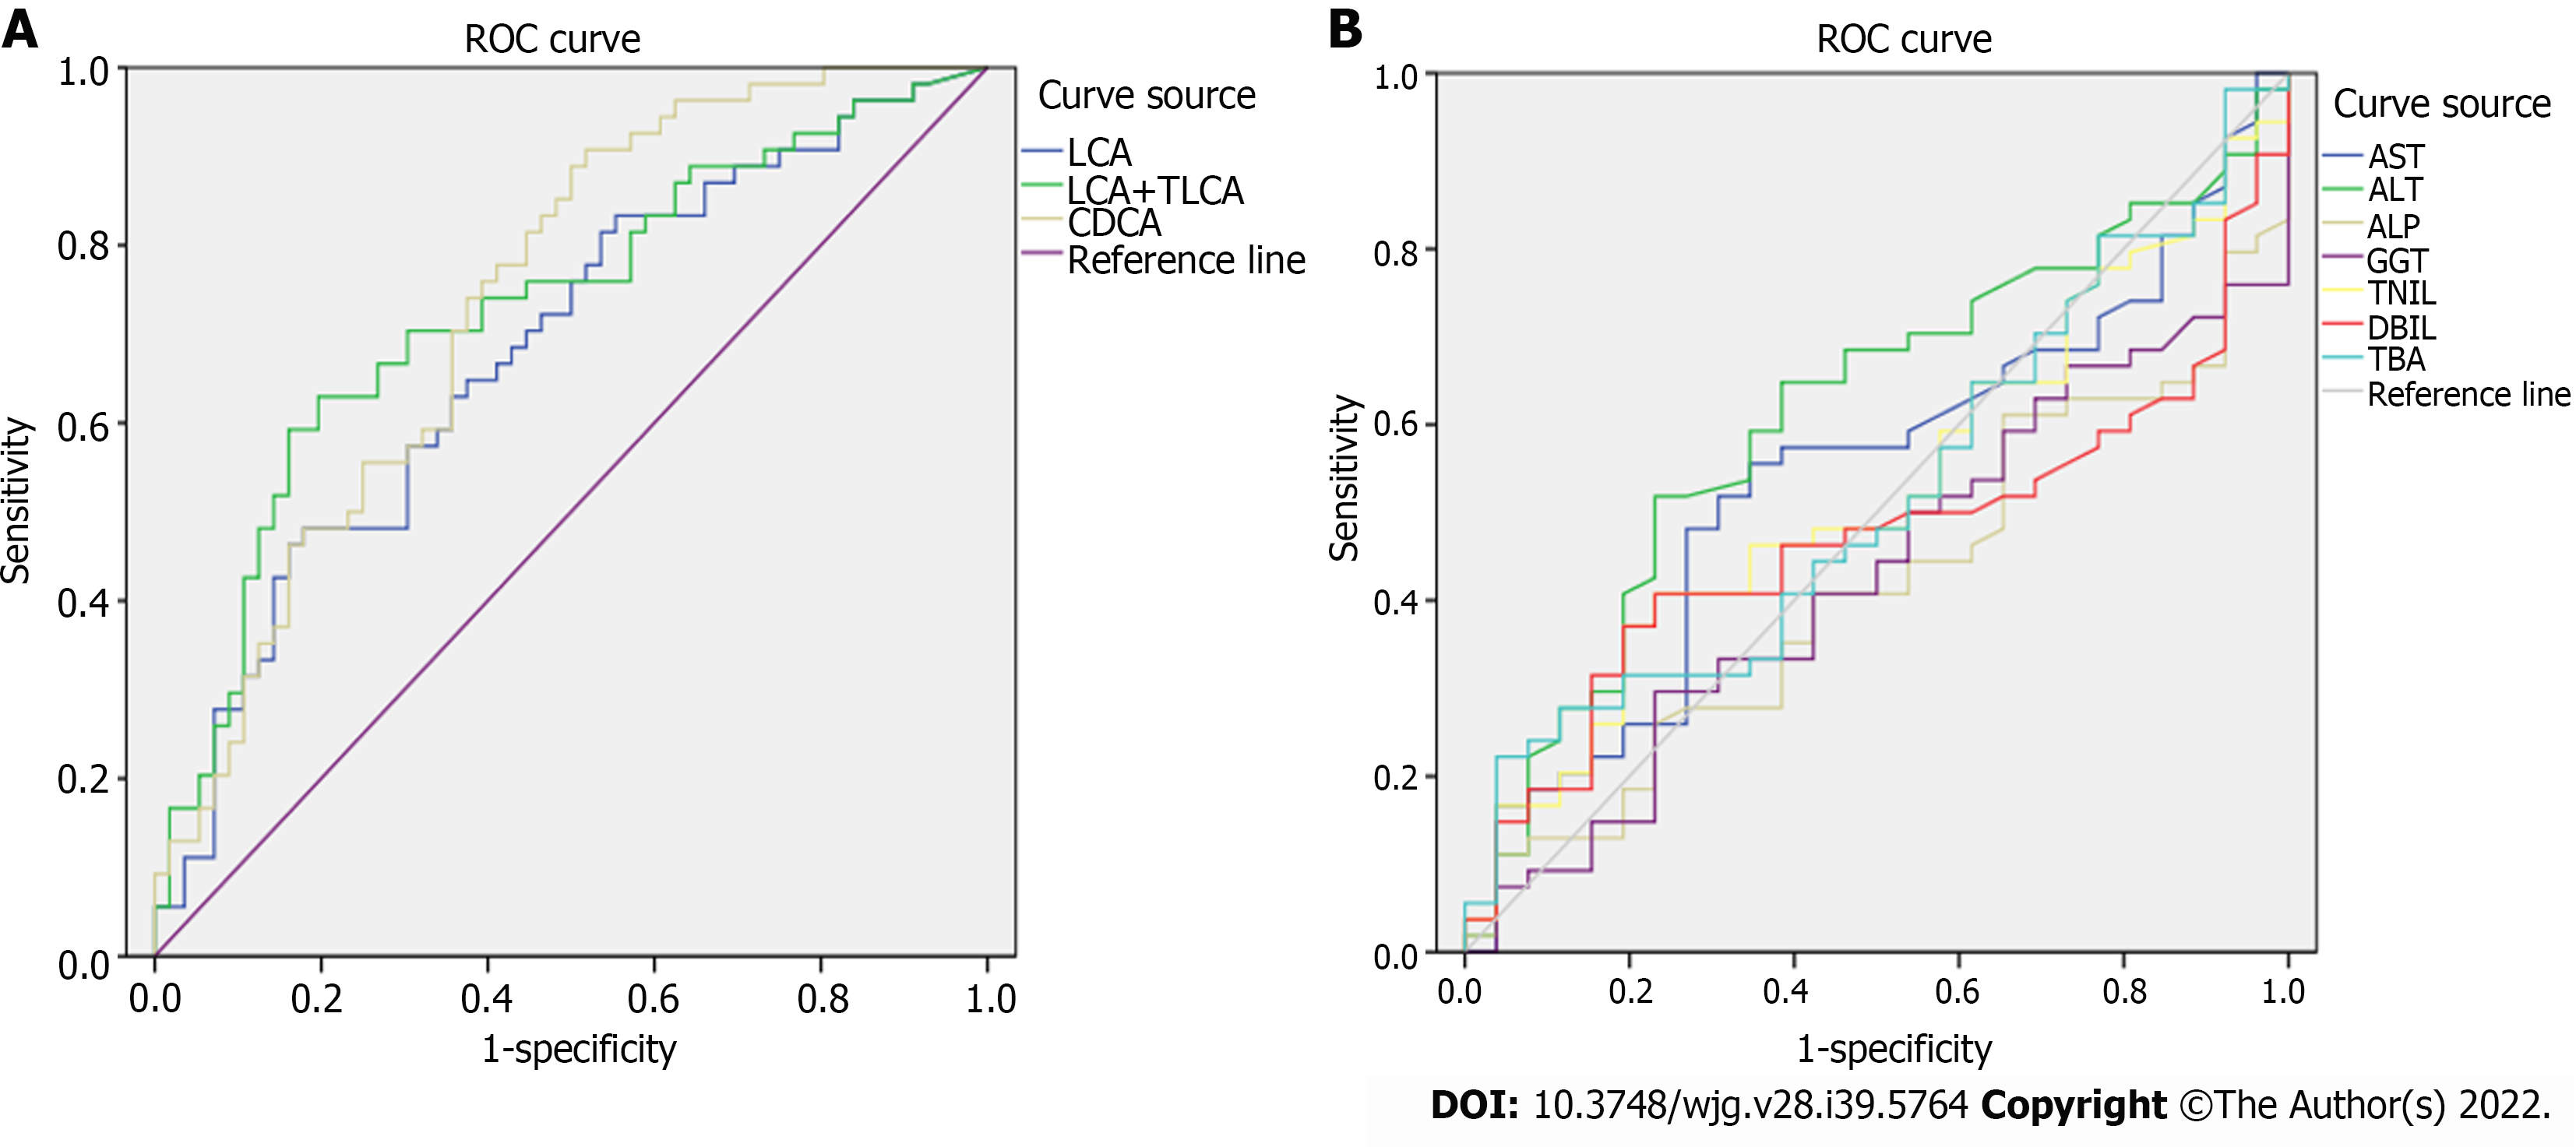
The receiver operating characteristic curve analysis of BAs with differences between the PBC and AIH groups showed that the area under the curve values of CDCA, LCA, and TLCA were greater than 0.7, and sensitivity was higher than 70%, indicating a high sensitivity, while a low specificity was noted in identification of patients with PBC and AIH (Figure 8 and Table 6). Compared with sensitivity and specificity of the traditional biochemical indicators, such as alanine transaminase, aspartate transaminase, gamma glutamyl transpeptidase, alkaline phosphatase, total bilirubin, direct bilirubin, and total bile acid, sensitivity and specificity of CDCA, LCA and TLCA were higher than the traditional markers of liver injury, which are of great significance for clinical diagnosis and can be further verified by enlarging the sample size. Thus, BAs can be potentially considered as markers for the diagnosis of PBC and AIH.
| AUC | Sensitivity | Specificity | |
| LCA | 0.68 | 0.82 | 0.50 |
| LCA + TLCA | 0.73 | 0.74 | 0.46 |
| CDCA | 0.74 | 0.74 | 0.54 |
| AST | 0.54 | 0.67 | 0.58 |
| ALT | 0.61 | 0.64 | 0.61 |
| ALP | 0.41 | 0.56 | 0.35 |
| GGT | 0.43 | 0.50 | 0.46 |
| TBiL | 0.53 | 0.59 | 0.42 |
| DBiL | 0.47 | 0.44 | 0.62 |
| TBA | 0.52 | 0.52 | 0.42 |
In the present study, we established a diagnostic model for PBC and AIH using the UPLC-QTOF-MS. Besides, VIP values from PLS-DA were calculated to describe a quantitative estimation of the discriminatory power of each individual feature. We found changes in the levels of amino acids, BAs, organic acids, phospholipids, sugar, and sugar alcohols in patients with PBC and AIH, and in HCs. These substances are mainly involved in lipid metabolism, BA metabolism, and bilirubin metabolism, which are related to metabolic functions of the liver and inflammatory reactions. These compound classes are also associated with key hepatic metabolic pathways. Importantly, our findings are consistent with those reported previously; for instance, BAs have been identified as a significant factor contributing to PBC[14-16]. When liver injury occurs, intrahepatic clearance rate of BAs decreases and serum BA level increases. BAs have long been used as markers of liver dysfunction. In recent studies, elevated serum levels of BAs have been found to be closely associated with liver diseases[17-21].
The levels of lysophosphatidylcholine (LPC) and lysophosphatidylethanolamine (LPE) significantly changed in patients with PBC and AIH. To date, no study has used lysophospholipids in the diagnosis of PBC and AIH. Lysophospholipids are biologically active lipids that are involved in a variety of important processes, including cell proliferation, cell migration, angiogenesis, and inflammation[22]. Our results also provided important clues to further explore the pathogenesis of PBC and AIH.
A discriminatory diagnostic model of PBC/AIH could not be established using the UPLC/MS/MS, suggesting that the changes of terminal metabolites in serum samples of patients with PBC and AIH were no special differences. Failure in the establishment of a discriminatory diagnostic model of PBC/AIH could be related to the sample size. Therefore, BAs were quantitatively analyzed according to the differences found between PBC/control and AIH/control groups.
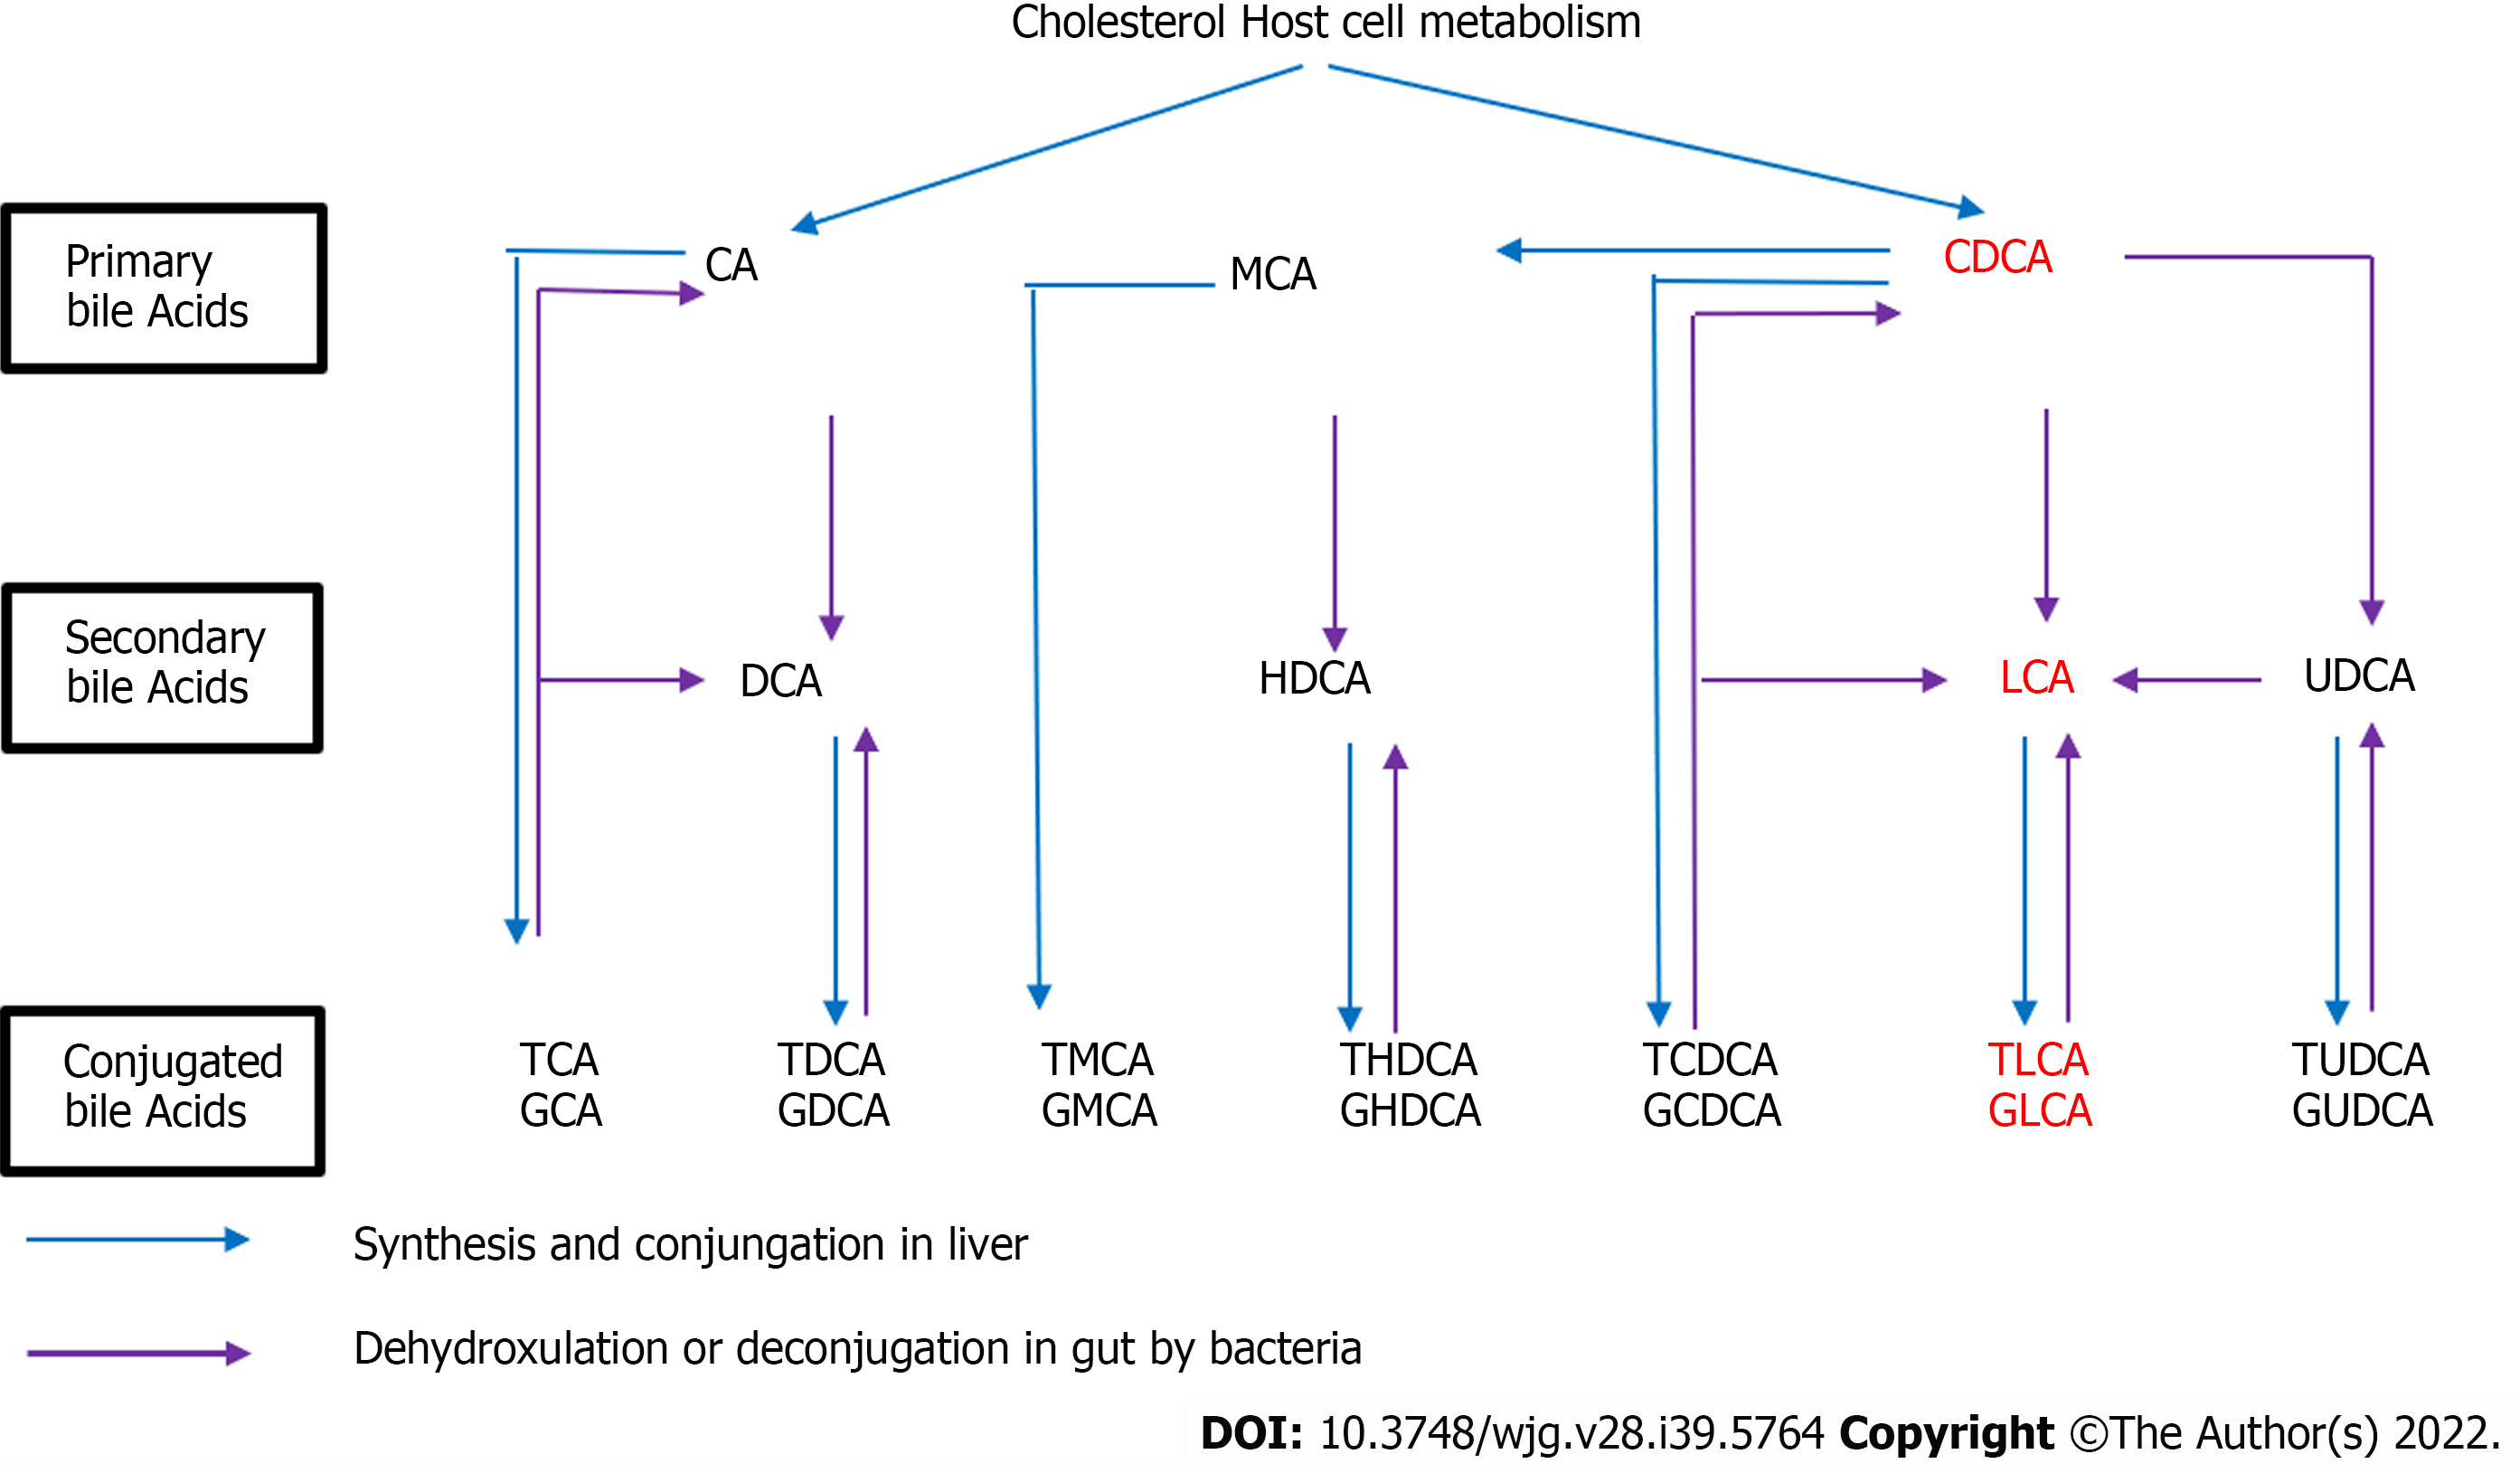
BA is the general term used for a class of bisexual molecules produced by the metabolism of cholesterol. The liver has an effective clearance effect on BAs, and BAs are kept at low levels, confirming the low levels of BAs in the human peripheral blood plasma. In the human liver, cholesterol is metabolized into primary BAs, including CA and CDCA, and then into the intestine, followed by into the corresponding secondary show in Figure 9.
The results of our targeted metabolomic study of BAs showed that the levels of BAs increased in patients with PBC and AIH compared with those in HCs, and the levels of CDCA, LCA, and LCA + TLCA in PBC patients were significantly higher than those in AIH patients. It is noteworthy that CA and CDCA, the two major human BAs, are synthesized from cholesterol in a series of reactions catalyzed by enzymes located in the endoplasmic reticulum, mitochondria, cytosol, and peroxisomes, suggesting that there were significant differences in the levels of BAs in PBC patients, providing clues for the future study on the pathogenesis of PBC. In autoimmune liver diseases, the dysfunction of BA metabolism occurs after liver injury, which may be related to bile stasis after liver injury, especially in PBC, which is more drastic, and is related to the pathogenesis of PBC. After bile duct obstruction and sclerosis, BAs cannot be transported and metabolized normally. Patients may present with jaundice and itchy skin.
Therefore, determination of the levels of BAs in plasma can reflect the synthesis, ingestion, and secretion of hepatocytes. Abnormalities in the levels of BAs not only reflect the extent of liver damage, but also indirectly indicate the conditions of blood-bile barrier in the liver.
To our knowledge, this is the first study that used serum metabolic profiling for diagnosing patients with PBC and AIH.
LCA is an endogenous compound associated with hepatic toxicity during cholestasis. A previous study[23] revealed that LCA induced disruption of phospholipid/ sphingolipid homeostasis through the transforming growth factor-β signaling pathway and serum LPC could be a biomarker for biliary injury.
The hepatic level of LCA was reported to elevate in patients with cholestatic liver disease[24,25]. This result is consistent with our finding, in which the levels of CDCA, LCA, TLCA, and LCA + TLCA were higher in PBC patients than those in AIH patients.
Previous studies[26,27] indicated that the activation of cytochrome P450 is correlated with Farnesoid X receptor (FXR). Mammalian FXR, which is a transcription regulatory factor in bile salt synthesis, is activated by BAs, such as CDCA or LCA[28,29]. The derangements of lipid metabolism are weakened in FXR-null mice compared with those in wild-type mice after LCA exposure[30,31]. As a cholestatic liver disease, the high levels of BAs may induce FXR gene transcription in PBC patients. Therefore, we hypothesized that these pathways may lead to LCA poisoning in PBC patients, and LCA metabolic pathway plays an important role in the incidence of PBC. Lian et al[14] used the untargeted meta
However, the retention of hydrophobic BAs in pathophysiological conditions, such as cholestatic diseases, plays an important role in liver injury by inducing apoptosis or necrosis of hepatocytes[32]. The retention and accumulation of hydrophobic Bas (e.g., CDCA and DCA)inside hepatocytes during cholestasis have long been implicated as a major cause of liver dysfunction[32].
The hydrophobicity of BAs is an important determinant of the toxicity and protection of BAs. Under normal conditions, the levels of BAs undergoing further biotransformations to dianionic glucuronidated or sulfated derivatives are negligible, although they may become important in cholestasis[33].
Several mechanisms may be involved in the cytotoxicity associated with the most hydrophobic BAs in cholestatic liver diseases[32]. BAs could disrupt cell membranes through their detergent action on lipid components[34] and promote the generation of reactive oxygen species that, in turn, oxidatively modify lipids, proteins, and nucleic acids, and eventually cause hepatocyte apoptosis[35].
As shown in Figure 9 CDCA/LCA/TLCA are all related to the decomposition and hydrolysis of bacteria in the intestine. CDCA is decomposed into LCA through bacteria in the intestine, and then, synthesizes TLCA through the intestinal bacteria. Intestinal bacteria may play a key role in this process. Therefore, we can hypothesize that dysfunction of intestinal bacteria may increase the incidence of autoimmune liver diseases, including PBC. Lv et al[36] and Zheng et al[37] found that the interaction of intestinal microflora with metabolism and immunity is crucial for the occurrence or development of PBC.
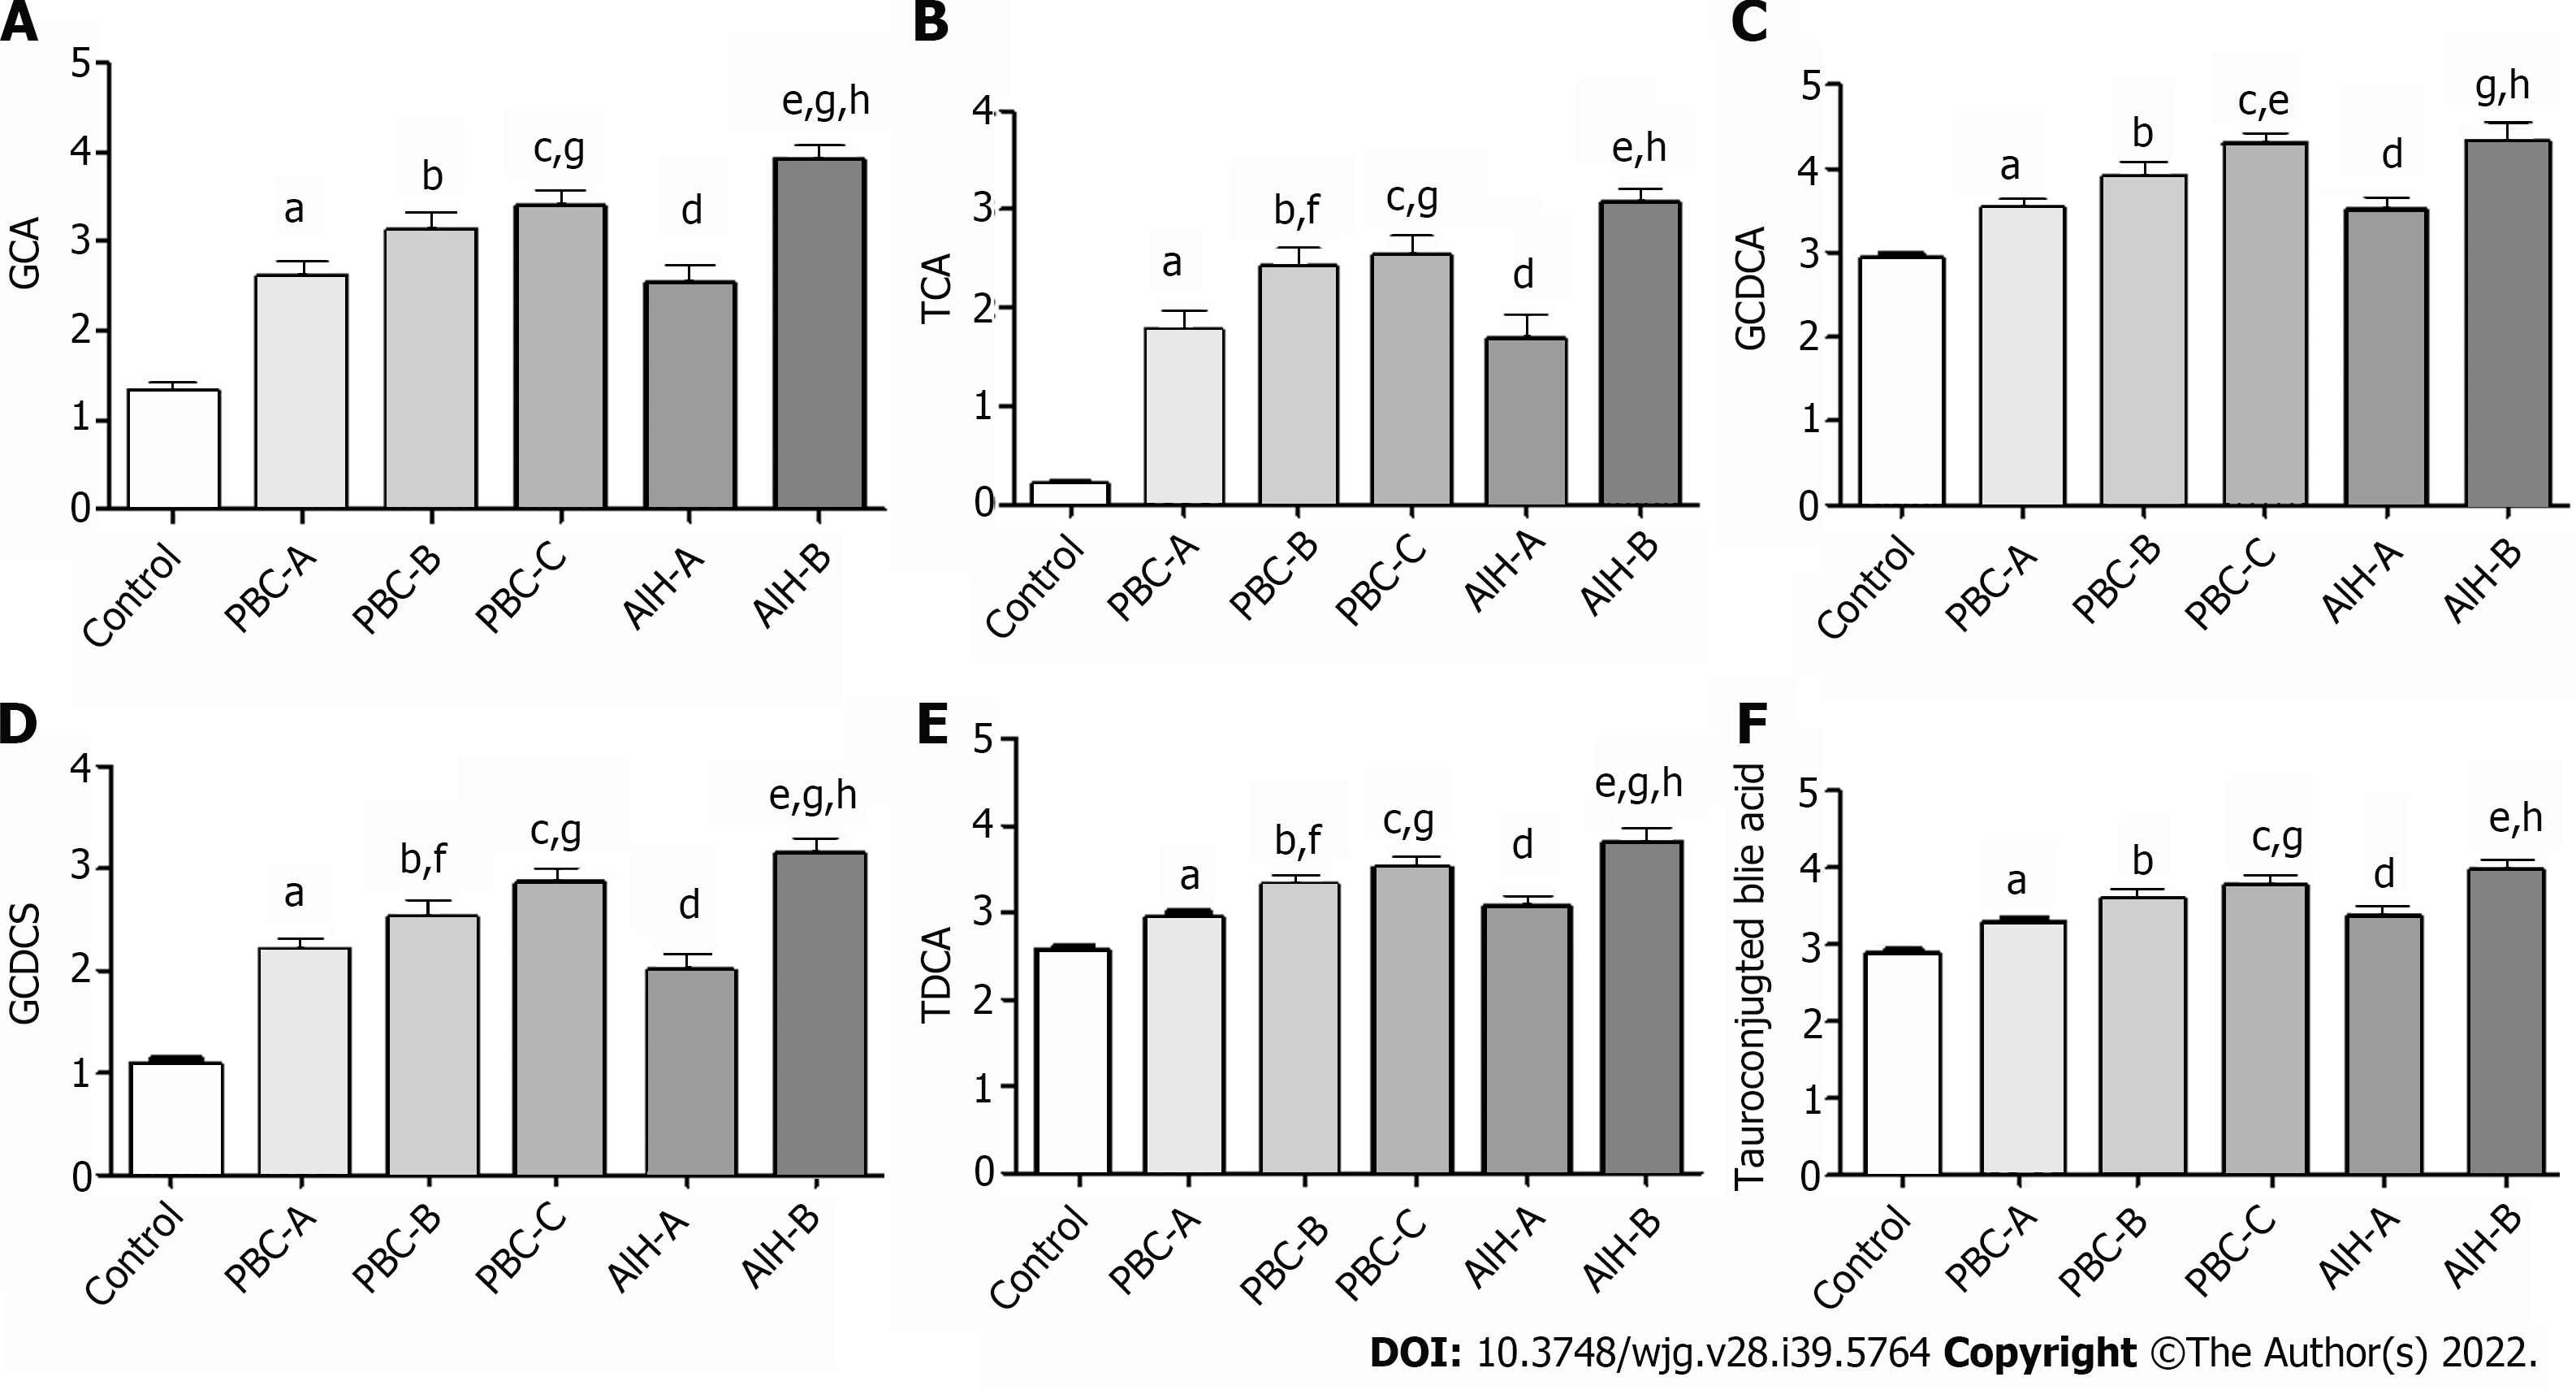
The Child-Pugh scoring system was used to classify PBC and AIH patients according to their Child-Pugh scores, show in Supplementary Table 2 and the levels of BAs in these patients with Child-Pugh scores were statistically show in Table 7. It was found that the levels of GCA, TCA, GCDCA, GCDCS, TDCA, and tauro-conjugated BAs were gradually elevated with the increase of Child-Pugh scores. The levels of BAs in PBC patients with Child-Pugh class C were significantly different from those in PBC patients with Child-Pugh class A (P < 0.05). The levels of BAs in AIH patients with Child-Pugh class B were significantly different from those in PBC patients with Child-Pugh class A (P < 0.05). The levels of GCA, GCDCS, and TDCA significantly differed in PBC and AIH patients with Child-Pugh class B (Figure 10). These BAs are all conjugated BAs, suggesting that the levels of conjugated BAs are elevated in patients with severe liver injury. The determination of BA level can not only reflect liver damage, but also indicate the degree of liver damage, which is similar to the results of our previous study on drug-induced liver injury (DILI)[38]. The increase in the levels of GCA, TCA, TUDCA, GCDCA, GCDCS, and TDCA was corresponded to a higher degree of DILI. Tang et al[15] used UPLC/Q-TOF-MS to analyze the metabolic groups of blood and urine in 32 pairs of PBC patients and HCs. It was found that the BA level increased with the PBC progression, while the higher accuracy of our findings was confirmed. Elevated levels of BAs are correlated with severity of a variety of diseases. BAs can be used as a factor to judge the severity of the disease and as a basis for the diagnosis of the disease. It is necessary to further expand the sample size for research.
| AIH-A/PBC/A | AIH-B/PBC-B | AIH-A/AIH-B | PBC-A/PBC-B | PBC-B/PBC-C | PBC-A/PBC-C | AIH-A/control | AIH-B/control | PBC-A/control | PBC-B/control | PBC-C/control | |
| P value | P value | P value | P value | P value | P value | P value | P value | P value | P value | P value | |
| CA | 0.75 | 0.34 | 0.24 | 0.67 | 0.82 | 0.50 | < 0.001 | < 0.001 | < 0.001 | < 0.001 | 0.03 |
| GCA | 0.79 | 0.03 | < 0.001 | 0.07 | 0.43 | 0.02 | < 0.001 | < 0.001 | < 0.001 | < 0.001 | < 0.001 |
| TCA | 0.79 | 0.03 | < 0.001 | 0.0522 | 0.71 | 0.0567 | < 0.001 | < 0.001 | < 0.001 | < 0.001 | < 0.001 |
| UDCA | 0.77 | 0.26 | 0.07 | 0.70 | 0.30 | 0.38 | < 0.001 | 0.52 | <0.001 | 0.05 | < 0.001 |
| GUDCA | 0.60 | 0.33 | 0.40 | 0.58 | 0.21 | 0.06 | < 0.001 | 0.13 | < 0.001 | < 0.001 | < 0.001 |
| TUDCA | 0.97 | 0.22 | 1.00 | 0.10 | 0.29 | 0.02 | < 0.001 | < 0.001 | < 0.001 | < 0.001 | < 0.001 |
| CDCA | 0.26 | 0.09 | 0.07 | 0.30 | 0.44 | 0.78 | < 0.001 | 0.47 | < 0.001 | < 0.001 | < 0.001 |
| GCDCA | 0.89 | 0.19 | 0.01 | 0.06 | 0.17 | < 0.001 | < 0.001 | < 0.001 | < 0.001 | < 0.001 | < 0.001 |
| TCDCA | 0.82 | 0.20 | 0.31 | 0.34 | 0.92 | 0.26 | 0.05 | 0.48 | 0.02 | 0.01 | 0.04 |
| GCDCS | 0.33 | 0.04 | < 0.001 | 0.15 | 0.24 | 0.01 | < 0.001 | < 0.001 | < 0.001 | < 0.001 | < 0.001 |
| DCA | 0.71 | 0.26 | 0.02 | 0.13 | 0.66 | 0.38 | 0.24 | 0.01 | 0.64 | 0.21 | 0.45 |
| GDCA | 0.50 | 0.08 | 0.09 | 0.37 | 0.09 | 0.11 | < 0.001 | < 0.001 | < 0.001 | 0.01 | < 0.001 |
| TDCA | 0.69 | 0.03 | < 0.001 | 0.01 | 0.33 | < 0.001 | < 0.001 | < 0.001 | < 0.001 | < 0.001 | < 0.001 |
| LCA | 0.29 | 0.13 | 0.57 | 0.82 | 0.24 | 0.33 | 0.08 | 0.51 | < 0.001 | < 0.001 | < 0.001 |
| TLCA | 0.07 | 0.88 | 0.05 | 0.13 | 0.74 | 0.29 | 0.01 | < 0.001 | < 0.001 | < 0.001 | < 0.001 |
| CDCA/CA | 0.46 | 0.04 | 0.04 | 0.66 | 0.50 | 0.27 | < 0.001 | < 0.001 | < 0.001 | 0.06 | 0.26 |
| Primary bile acid | 0.75 | 0.81 | 0.96 | 0.42 | 0.70 | 0.96 | < 0.001 | 0.02 | < 0.001 | < 0.001 | < 0.001 |
| Secondary bile acid | 0.92 | 0.80 | 0.20 | 0.33 | 0.20 | 0.45 | < 0.001 | 0.45 | < 0.001 | 0.15 | < 0.001 |
| Secondary/primary | 0.61 | 0.99 | 0.32 | 0.27 | 0.23 | 0.44 | 0.30 | 0.05 | 0.06 | 0.01 | 0.78 |
| Secondary bile acid | 0.89 | 0.91 | 0.08 | 0.05 | 0.24 | 0.79 | 0.13 | 0.08 | 0.09 | 0.12 | 0.35 |
| Glycoconjugates | 0.53 | 0.16 | < 0.001 | 0.21 | 0.16 | < 0.001 | < 0.001 | < 0.001 | < 0.001 | < 0.001 | < 0.001 |
| Tauroconjugted | 0.48 | 0.08 | < 0.001 | 0.02 | 0.42 | < 0.001 | < 0.001 | < 0.001 | < 0.001 | < 0.001 | < 0.001 |
| Glyco/tauro | 0.21 | 0.56 | 0.23 | 0.63 | 0.07 | 0.18 | 0.01 | < 0.001 | < 0.001 | < 0.001 | < 0.001 |
| Total BA | 0.62 | 0.72 | 0.05 | 0.26 | 0.19 | 0.01 | < 0.001 | < 0.001 | < 0.001 | < 0.001 | < 0.001 |
A discriminatory diagnostic model for PBC and AIH using UPLC-QTOF-MS was established. Besides, differential metabolomics analysis was conducted using the PLS-DA model to screen the differentially expressed substances in the different groups. The changes in the levels of BAs, LPC, LPE, bilirubin, and phytosphingosine in PBC and AIH patients and HCs were compared.
The levels of CDCA, LCA, TLCA, and LCA + TLCA significantly increased in the PBC group compared with those in the AIH group. These results suggested that the levels of BAs can be used as a marker to differentiate PBC from AIH, and the results may be advantageous to study the pathogenesis of PBC/AIH in the future.
In conclusion, this study revealed that in patients with PBC and AIH, there were significant differences in serum levels of BAs. However, due to the existence of some limitations (i.e., the small sample size, the lack of staging methods for PBC and AIH, and phenotypic information), further study with a larger sample size is required to eliminate the above-mentioned limitations and to confirm the findings.
Primary biliary cholangitis (PBC) and autoimmune hepatitis (AIH) are two unexplained immune diseases. It is difficult to identify and Liver biopsy should be done.
Avoid liver perforation and relieve the pain of patient, to improve the diagnostic rate of PBC and AIH.
To determine non-invasive, reliable, and sensitive biochemical markers for the differential diagnosis of PBC and AIH.
Metabolomics technologies, including full-contour metabolomics and target.
We revealed the increased levels of chenodeoxycholic acid, lithocholic acid (LCA), taurolithocholic acid (TLCA), and LCA + TLCA in the PBC group compared with those in the AIH group. The levels of glycochenodeoxycholic acid, glycochenodeoxycholic sulfate, and taurodeoxycholic acid were gradually elevated with the increase of Child-Pugh class, which was correlated with the severity of disease.
The levels of bile acids could serve as potential biomarkers for the early diagnosis and assessment of the severity of PBC and AIH.
It is necessary to further expand the sample size for research and search for the mechanism for the changes.
Thanks to Dalian Chemical Institute for providing the test site and technical guidance.
Provenance and peer review: Unsolicited article; Externally peer reviewed.
Peer-review model: Single blind
Specialty type: Gastroenterology and hepatology
Country/Territory of origin: China
Peer-review report’s scientific quality classification
Grade A (Excellent): 0
Grade B (Very good): B, B
Grade C (Good): 0
Grade D (Fair): 0
Grade E (Poor): 0
P-Reviewer: Liakina V, Lithuania; Velikova TV, Bulgaria S-Editor: Fan JR L-Editor: A P-Editor: Cai YX
| 1. | Biewenga M, Farina Sarasqueta A, Tushuizen ME, de Jonge-Muller ESM, van Hoek B, Trouw LA. The role of complement activation in autoimmune liver disease. Autoimmun Rev. 2020;19:102534. [RCA] [PubMed] [DOI] [Full Text] [Cited by in Crossref: 10] [Cited by in RCA: 23] [Article Influence: 4.6] [Reference Citation Analysis (0)] |
| 2. | He XS, Ansari AA, Ridgway WM, Coppel RL, Gershwin ME. New insights to the immunopathology and autoimmune responses in primary biliary cirrhosis. Cell Immunol. 2006;239:1-13. [RCA] [PubMed] [DOI] [Full Text] [Cited by in Crossref: 52] [Cited by in RCA: 49] [Article Influence: 2.6] [Reference Citation Analysis (0)] |
| 3. | Dumas ME, Davidovic L. Metabolic Profiling and Phenotyping of Central Nervous System Diseases: Metabolites Bring Insights into Brain Dysfunctions. J Neuroimmune Pharmacol. 2015;10:402-424. [RCA] [PubMed] [DOI] [Full Text] [Cited by in Crossref: 30] [Cited by in RCA: 37] [Article Influence: 3.7] [Reference Citation Analysis (0)] |
| 4. | Clayton TA, Lindon JC, Cloarec O, Antti H, Charuel C, Hanton G, Provost JP, Le Net JL, Baker D, Walley RJ, Everett JR, Nicholson JK. Pharmaco-metabonomic phenotyping and personalized drug treatment. Nature. 2006;440:1073-1077. [RCA] [PubMed] [DOI] [Full Text] [Cited by in Crossref: 646] [Cited by in RCA: 603] [Article Influence: 31.7] [Reference Citation Analysis (0)] |
| 5. | Blow N. Metabolomics: Biochemistry's new look. Nature. 2008;455:697-700. [RCA] [PubMed] [DOI] [Full Text] [Cited by in Crossref: 96] [Cited by in RCA: 81] [Article Influence: 4.8] [Reference Citation Analysis (0)] |
| 6. | Yin P, Wan D, Zhao C, Chen J, Zhao X, Wang W, Lu X, Yang S, Gu J, Xu G. A metabonomic study of hepatitis B-induced liver cirrhosis and hepatocellular carcinoma by using RP-LC and HILIC coupled with mass spectrometry. Mol Biosyst. 2009;5:868-876. [RCA] [PubMed] [DOI] [Full Text] [Cited by in Crossref: 173] [Cited by in RCA: 177] [Article Influence: 11.1] [Reference Citation Analysis (0)] |
| 7. | Tokushige K, Hashimoto E, Kodama K, Tobari M, Matsushita N, Kogiso T, Taniai M, Torii N, Shiratori K, Nishizaki Y, Ohga T, Ohashi Y, Sato T. Serum metabolomic profile and potential biomarkers for severity of fibrosis in nonalcoholic fatty liver disease. J Gastroenterol. 2013;48:1392-1400. [RCA] [PubMed] [DOI] [Full Text] [Full Text (PDF)] [Cited by in Crossref: 50] [Cited by in RCA: 59] [Article Influence: 4.9] [Reference Citation Analysis (0)] |
| 8. | Barr J, Caballería J, Martínez-Arranz I, Domínguez-Díez A, Alonso C, Muntané J, Pérez-Cormenzana M, García-Monzón C, Mayo R, Martín-Duce A, Romero-Gómez M, Lo Iacono O, Tordjman J, Andrade RJ, Pérez-Carreras M, Le Marchand-Brustel Y, Tran A, Fernández-Escalante C, Arévalo E, García-Unzueta M, Clement K, Crespo J, Gual P, Gómez-Fleitas M, Martínez-Chantar ML, Castro A, Lu SC, Vázquez-Chantada M, Mato JM. Obesity-dependent metabolic signatures associated with nonalcoholic fatty liver disease progression. J Proteome Res. 2012;11:2521-2532. [RCA] [PubMed] [DOI] [Full Text] [Cited by in Crossref: 145] [Cited by in RCA: 185] [Article Influence: 14.2] [Reference Citation Analysis (0)] |
| 9. | Hao J, Yang T, Zhou Y, Gao GY, Xing F, Peng Y, Tao YY, Liu CH. Serum Metabolomics Analysis Reveals a Distinct Metabolic Profile of Patients with Primary Biliary Cholangitis. Sci Rep. 2017;7:784. [RCA] [PubMed] [DOI] [Full Text] [Full Text (PDF)] [Cited by in Crossref: 17] [Cited by in RCA: 30] [Article Influence: 3.8] [Reference Citation Analysis (0)] |
| 10. | Sreekumar A, Poisson LM, Rajendiran TM, Khan AP, Cao Q, Yu J, Laxman B, Mehra R, Lonigro RJ, Li Y, Nyati MK, Ahsan A, Kalyana-Sundaram S, Han B, Cao X, Byun J, Omenn GS, Ghosh D, Pennathur S, Alexander DC, Berger A, Shuster JR, Wei JT, Varambally S, Beecher C, Chinnaiyan AM. Metabolomic profiles delineate potential role for sarcosine in prostate cancer progression. Nature. 2009;457:910-914. [RCA] [PubMed] [DOI] [Full Text] [Full Text (PDF)] [Cited by in Crossref: 1841] [Cited by in RCA: 1668] [Article Influence: 104.3] [Reference Citation Analysis (0)] |
| 11. | Alvarez F, Berg PA, Bianchi FB, Bianchi L, Burroughs AK, Cancado EL, Chapman RW, Cooksley WG, Czaja AJ, Desmet VJ, Donaldson PT, Eddleston AL, Fainboim L, Heathcote J, Homberg JC, Hoofnagle JH, Kakumu S, Krawitt EL, Mackay IR, MacSween RN, Maddrey WC, Manns MP, McFarlane IG, Meyer zum Büschenfelde KH, Zeniya M. International Autoimmune Hepatitis Group Report: review of criteria for diagnosis of autoimmune hepatitis. J Hepatol. 1999;31:929-938. [RCA] [PubMed] [DOI] [Full Text] [Cited by in Crossref: 2003] [Cited by in RCA: 1985] [Article Influence: 76.3] [Reference Citation Analysis (0)] |
| 12. | Silveira MG, Brunt EM, Heathcote J, Gores GJ, Lindor KD, Mayo MJ. American Association for the Study of Liver Diseases endpoints conference: design and endpoints for clinical trials in primary biliary cirrhosis. Hepatology. 2010;52:349-359. [RCA] [PubMed] [DOI] [Full Text] [Cited by in Crossref: 69] [Cited by in RCA: 76] [Article Influence: 5.1] [Reference Citation Analysis (0)] |
| 13. | Yin P, Zhao X, Li Q, Wang J, Li J, Xu G. Metabonomics study of intestinal fistulas based on ultraperformance liquid chromatography coupled with Q-TOF mass spectrometry (UPLC/Q-TOF MS). J Proteome Res. 2006;5:2135-2143. [RCA] [PubMed] [DOI] [Full Text] [Cited by in Crossref: 135] [Cited by in RCA: 103] [Article Influence: 5.4] [Reference Citation Analysis (0)] |
| 14. | Lian JS, Liu W, Hao SR, Chen DY, Wang YY, Yang JL, Jia HY, Huang JR. A serum metabolomic analysis for diagnosis and biomarker discovery of primary biliary cirrhosis and autoimmune hepatitis. Hepatobiliary Pancreat Dis Int. 2015;14:413-421. [RCA] [PubMed] [DOI] [Full Text] [Cited by in Crossref: 22] [Cited by in RCA: 27] [Article Influence: 2.7] [Reference Citation Analysis (0)] |
| 15. | Tang YM, Wang JP, Bao WM, Yang JH, Ma LK, Yang J, Chen H, Xu Y, Yang LH, Li W, Zhu YP, Cheng JB. Urine and serum metabolomic profiling reveals that bile acids and carnitine may be potential biomarkers of primary biliary cirrhosis. Int J Mol Med. 2015;36:377-385. [RCA] [PubMed] [DOI] [Full Text] [Full Text (PDF)] [Cited by in Crossref: 25] [Cited by in RCA: 33] [Article Influence: 3.3] [Reference Citation Analysis (0)] |
| 16. | Chen W, Wei Y, Xiong A, Li Y, Guan H, Wang Q, Miao Q, Bian Z, Xiao X, Lian M, Zhang J, Li B, Cao Q, Fan Z, Zhang W, Qiu D, Fang J, Gershwin ME, Yang L, Tang R, Ma X. Comprehensive Analysis of Serum and Fecal Bile Acid Profiles and Interaction with Gut Microbiota in Primary Biliary Cholangitis. Clin Rev Allergy Immunol. 2020;58:25-38. [RCA] [PubMed] [DOI] [Full Text] [Cited by in Crossref: 51] [Cited by in RCA: 106] [Article Influence: 21.2] [Reference Citation Analysis (0)] |
| 17. | Yang L, Xiong A, He Y, Wang Z, Wang C, Li W, Yang L, Hu Z. Bile acids metabonomic study on the CCl4- and alpha-naphthylisothiocyanate-induced animal models: quantitative analysis of 22 bile acids by ultraperformance liquid chromatography-mass spectrometry. Chem Res Toxicol. 2008;21:2280-2288. [RCA] [PubMed] [DOI] [Full Text] [Cited by in Crossref: 82] [Cited by in RCA: 87] [Article Influence: 5.4] [Reference Citation Analysis (0)] |
| 18. | Monte MJ, Marin JJ, Antelo A, Vazquez-Tato J. Bile acids: chemistry, physiology, and pathophysiology. World J Gastroenterol. 2009;15:804-816. [RCA] [PubMed] [DOI] [Full Text] [Full Text (PDF)] [Cited by in CrossRef: 364] [Cited by in RCA: 403] [Article Influence: 25.2] [Reference Citation Analysis (9)] |
| 19. | Perez MJ, Briz O. Bile-acid-induced cell injury and protection. World J Gastroenterol. 2009;15:1677-1689. [RCA] [PubMed] [DOI] [Full Text] [Full Text (PDF)] [Cited by in CrossRef: 469] [Cited by in RCA: 518] [Article Influence: 32.4] [Reference Citation Analysis (3)] |
| 20. | Gilat T, Leikin-Frenkel A, Goldiner I, Juhel C, Lafont H, Gobbi D, Konikoff FM. Prevention of diet-induced fatty liver in experimental animals by the oral administration of a fatty acid bile acid conjugate (FABAC). Hepatology. 2003;38:436-442. [RCA] [PubMed] [DOI] [Full Text] [Cited by in Crossref: 44] [Cited by in RCA: 48] [Article Influence: 2.2] [Reference Citation Analysis (0)] |
| 21. | Kobayashi N, Katsumata H, Uto Y, Goto J, Niwa T, Kobayashi K, Mizuuchi Y. A monoclonal antibody-based enzyme-linked immunosorbent assay of glycolithocholic acid sulfate in human urine for liver function test. Steroids. 2002;67:827-833. [RCA] [PubMed] [DOI] [Full Text] [Cited by in Crossref: 15] [Cited by in RCA: 18] [Article Influence: 0.8] [Reference Citation Analysis (0)] |
| 22. | Goetzl EJ. Pleiotypic mechanisms of cellular responses to biologically active lysophospholipids. Prostaglandins Other Lipid Mediat. 2001;64:11-20. [RCA] [PubMed] [DOI] [Full Text] [Cited by in Crossref: 61] [Cited by in RCA: 61] [Article Influence: 2.5] [Reference Citation Analysis (0)] |
| 23. | Matsubara T, Tanaka N, Patterson AD, Cho JY, Krausz KW, Gonzalez FJ. Lithocholic acid disrupts phospholipid and sphingolipid homeostasis leading to cholestasis in mice. Hepatology. 2011;53:1282-1293. [RCA] [PubMed] [DOI] [Full Text] [Full Text (PDF)] [Cited by in Crossref: 81] [Cited by in RCA: 73] [Article Influence: 5.2] [Reference Citation Analysis (0)] |
| 24. | Fischer S, Beuers U, Spengler U, Zwiebel FM, Koebe HG. Hepatic levels of bile acids in end-stage chronic cholestatic liver disease. Clin Chim Acta. 1996;251:173-186. [RCA] [PubMed] [DOI] [Full Text] [Cited by in Crossref: 92] [Cited by in RCA: 100] [Article Influence: 3.4] [Reference Citation Analysis (0)] |
| 25. | Setchell KD, Rodrigues CM, Clerici C, Solinas A, Morelli A, Gartung C, Boyer J. Bile acid concentrations in human and rat liver tissue and in hepatocyte nuclei. Gastroenterology. 1997;112:226-235. [RCA] [PubMed] [DOI] [Full Text] [Cited by in Crossref: 138] [Cited by in RCA: 144] [Article Influence: 5.1] [Reference Citation Analysis (0)] |
| 26. | Akiyama TE, Gonzalez FJ. Regulation of P450 genes by liver-enriched transcription factors and nuclear receptors. Biochim Biophys Acta. 2003;1619:223-234. [RCA] [PubMed] [DOI] [Full Text] [Cited by in Crossref: 90] [Cited by in RCA: 89] [Article Influence: 4.0] [Reference Citation Analysis (0)] |
| 27. | Krasowski MD, Ni A, Hagey LR, Ekins S. Evolution of promiscuous nuclear hormone receptors: LXR, FXR, VDR, PXR, and CAR. Mol Cell Endocrinol. 2011;334:39-48. [RCA] [PubMed] [DOI] [Full Text] [Full Text (PDF)] [Cited by in Crossref: 101] [Cited by in RCA: 99] [Article Influence: 7.1] [Reference Citation Analysis (0)] |
| 28. | Eloranta JJ, Kullak-Ublick GA. The role of FXR in disorders of bile acid homeostasis. Physiology (Bethesda). 2008;23:286-295. [RCA] [PubMed] [DOI] [Full Text] [Cited by in Crossref: 58] [Cited by in RCA: 72] [Article Influence: 4.2] [Reference Citation Analysis (0)] |
| 29. | Hofmann AF. Detoxification of lithocholic acid, a toxic bile acid: relevance to drug hepatotoxicity. Drug Metab Rev. 2004;36:703-722. [RCA] [PubMed] [DOI] [Full Text] [Cited by in Crossref: 193] [Cited by in RCA: 208] [Article Influence: 10.4] [Reference Citation Analysis (0)] |
| 30. | Bogdanos DP, Invernizzi P, Mackay IR, Vergani D. Autoimmune liver serology: current diagnostic and clinical challenges. World J Gastroenterol. 2008;14:3374-3387. [RCA] [PubMed] [DOI] [Full Text] [Full Text (PDF)] [Cited by in CrossRef: 151] [Cited by in RCA: 145] [Article Influence: 8.5] [Reference Citation Analysis (0)] |
| 31. | Kitada H, Miyata M, Nakamura T, Tozawa A, Honma W, Shimada M, Nagata K, Sinal CJ, Guo GL, Gonzalez FJ, Yamazoe Y. Protective role of hydroxysteroid sulfotransferase in lithocholic acid-induced liver toxicity. J Biol Chem. 2003;278:17838-17844. [RCA] [PubMed] [DOI] [Full Text] [Cited by in Crossref: 122] [Cited by in RCA: 121] [Article Influence: 5.5] [Reference Citation Analysis (0)] |
| 32. | Attili AF, Angelico M, Cantafora A, Alvaro D, Capocaccia L. Bile acid-induced liver toxicity: relation to the hydrophobic-hydrophilic balance of bile acids. Med Hypotheses. 1986;19:57-69. [RCA] [PubMed] [DOI] [Full Text] [Cited by in Crossref: 206] [Cited by in RCA: 211] [Article Influence: 5.4] [Reference Citation Analysis (0)] |
| 33. | Javitt NB. Cholesterol, hydroxycholesterols, and bile acids. Biochem Biophys Res Commun. 2002;292:1147-1153. [RCA] [PubMed] [DOI] [Full Text] [Cited by in Crossref: 32] [Cited by in RCA: 31] [Article Influence: 1.3] [Reference Citation Analysis (0)] |
| 34. | Billington D, Evans CE, Godfrey PP, Coleman R. Effects of bile salts on the plasma membranes of isolated rat hepatocytes. Biochem J. 1980;188:321-327. [RCA] [PubMed] [DOI] [Full Text] [Cited by in Crossref: 107] [Cited by in RCA: 116] [Article Influence: 2.6] [Reference Citation Analysis (0)] |
| 35. | Sokol RJ, Straka MS, Dahl R, Devereaux MW, Yerushalmi B, Gumpricht E, Elkins N, Everson G. Role of oxidant stress in the permeability transition induced in rat hepatic mitochondria by hydrophobic bile acids. Pediatr Res. 2001;49:519-531. [RCA] [PubMed] [DOI] [Full Text] [Cited by in Crossref: 114] [Cited by in RCA: 114] [Article Influence: 4.8] [Reference Citation Analysis (0)] |
| 36. | Lv LX, Fang DQ, Shi D, Chen DY, Yan R, Zhu YX, Chen YF, Shao L, Guo FF, Wu WR, Li A, Shi HY, Jiang XW, Jiang HY, Xiao YH, Zheng SS, Li LJ. Alterations and correlations of the gut microbiome, metabolism and immunity in patients with primary biliary cirrhosis. Environ Microbiol. 2016;18:2272-2286. [RCA] [PubMed] [DOI] [Full Text] [Cited by in Crossref: 121] [Cited by in RCA: 182] [Article Influence: 22.8] [Reference Citation Analysis (0)] |
| 37. | Zheng Y, Ran Y, Zhang H, Wang B, Zhou L. The Microbiome in Autoimmune Liver Diseases: Metagenomic and Metabolomic Changes. Front Physiol. 2021;12:715852. [RCA] [PubMed] [DOI] [Full Text] [Full Text (PDF)] [Cited by in Crossref: 5] [Cited by in RCA: 16] [Article Influence: 4.0] [Reference Citation Analysis (0)] |
| 38. | Ma Z, Wang X, Yin P, Wu R, Zhou L, Xu G, Niu J. Serum metabolome and targeted bile acid profiling reveals potential novel biomarkers for drug-induced liver injury. Medicine (Baltimore). 2019;98:e16717. [RCA] [PubMed] [DOI] [Full Text] [Full Text (PDF)] [Cited by in Crossref: 24] [Cited by in RCA: 34] [Article Influence: 5.7] [Reference Citation Analysis (0)] |


