Hill CE, Biasiolli L, Robson MD, Grau V, Pavlides M. Emerging artificial intelligence applications in liver magnetic resonance imaging. World J Gastroenterol 2021; 27(40): 6825-6843 [PMID: 34790009 DOI: 10.3748/wjg.v27.i40.6825]
Corresponding Author of This Article
Michael Pavlides, BSc, DPhil, MBBS, MRCP, Consultant Physician-Scientist, Doctor, Oxford Centre for Clinical Magnetic Resonance Research, Division of Cardiovascular Medicine, Radcliffe Department of Medicine, University of Oxford, Level 0, John Radcliffe Hospital, Headley Way, Headington, Oxford OX3 9DU, United Kingdom. michael.pavlides@cardiov.ox.ac.uk
Research Domain of This Article
Gastroenterology & Hepatology
Article-Type of This Article
Minireviews
Open-Access Policy of This Article
This article is an open-access article which was selected by an in-house editor and fully peer-reviewed by external reviewers. It is distributed in accordance with the Creative Commons Attribution Non Commercial (CC BY-NC 4.0) license, which permits others to distribute, remix, adapt, build upon this work non-commercially, and license their derivative works on different terms, provided the original work is properly cited and the use is non-commercial. See: http://creativecommons.org/licenses/by-nc/4.0/
Charles E Hill, Department of Engineering Science, University of Oxford, Oxford OX3 7DQ, United Kingdom
Luca Biasiolli, Radcliffe Department of Medicine, University of Oxford, Oxford OX3 9DU, United Kingdom
Matthew D Robson, MR Physics, Perspectum Ltd, Oxford OX4 2LL, United Kingdom
Vicente Grau, Department of Engineering, University of Oxford, Oxford OX3 7DQ, United Kingdom
Michael Pavlides, Oxford Centre for Clinical Magnetic Resonance Research, Division of Cardiovascular Medicine, Radcliffe Department of Medicine, University of Oxford, Oxford OX3 9DU, United Kingdom
Michael Pavlides, Translational Gastroenterology Unit, University of Oxford, Oxford OX3 9DU, United Kingdom
Michael Pavlides, Oxford NIHR Biomedical Research Centre, University of Oxford, Oxford OX3 9DU, United Kingdom
Author contributions: Hill CE did the literature search and drafted the manuscript; all other authors revised the manuscript for important intellectual content.
Supported bythe Engineering and Physical Sciences Research Council and Medical Research Council, No. EP/L016052/1.
Conflict-of-interest statement: Pavlides M is a shareholder for the company Perspectum Ltd. and has applied for a patent for medical imaging; All other authors declare no conflicts of interest; Robson M is an employee and shareholder for the company Perspectum Ltd.; Hill CE is partially funded by the company Perspectum Ltd.
Open-Access: This article is an open-access article that was selected by an in-house editor and fully peer-reviewed by external reviewers. It is distributed in accordance with the Creative Commons Attribution NonCommercial (CC BY-NC 4.0) license, which permits others to distribute, remix, adapt, build upon this work non-commercially, and license their derivative works on different terms, provided the original work is properly cited and the use is non-commercial. See: http://creativecommons.org/Licenses/by-nc/4.0/
Corresponding author: Michael Pavlides, BSc, DPhil, MBBS, MRCP, Consultant Physician-Scientist, Doctor, Oxford Centre for Clinical Magnetic Resonance Research, Division of Cardiovascular Medicine, Radcliffe Department of Medicine, University of Oxford, Level 0, John Radcliffe Hospital, Headley Way, Headington, Oxford OX3 9DU, United Kingdom. michael.pavlides@cardiov.ox.ac.uk
Received: February 6, 2021 Peer-review started: February 6, 2021 First decision: March 29, 2021 Revised: April 16, 2021 Accepted: September 26, 2021 Article in press: September 30, 2021 Published online: October 28, 2021 Processing time: 262 Days and 13.8 Hours
Abstract
Chronic liver diseases (CLDs) are becoming increasingly more prevalent in modern society. The use of imaging techniques for early detection, such as magnetic resonance imaging (MRI), is crucial in reducing the impact of these diseases on healthcare systems. Artificial intelligence (AI) algorithms have been shown over the past decade to excel at image-based analysis tasks such as detection and segmentation. When applied to liver MRI, they have the potential to improve clinical decision making, and increase throughput by automating analyses. With Liver diseases becoming more prevalent in society, the need to implement these techniques to utilize liver MRI to its full potential, is paramount. In this review, we report on the current methods and applications of AI methods in liver MRI, with a focus on machine learning and deep learning methods. We assess four main themes of segmentation, classification, image synthesis and artefact detection, and their respective potential in liver MRI and the wider clinic. We provide a brief explanation of some of the algorithms used and explore the current challenges affecting the field. Though there are many hurdles to overcome in implementing AI methods in the clinic, we conclude that AI methods have the potential to positively aid healthcare professionals for years to come.
Core Tip: Artificial Intelligence (AI) algorithms are becoming increasingly prevalent in magnetic resonance imaging (MRI) after their proven success in computer vision tasks. With regards to liver MRI, these methods have been shown to be successful in tasks from hepatocellular carcinoma detection, to motion reduction to improve undiagnostic scans. They have also been shown in some cases to outperform radiographer level performance. The widespread use of these techniques could positively aid clinicians for years to come, if implemented properly into clinical workflows.
Citation: Hill CE, Biasiolli L, Robson MD, Grau V, Pavlides M. Emerging artificial intelligence applications in liver magnetic resonance imaging. World J Gastroenterol 2021; 27(40): 6825-6843
Since the advent of magnetic resonance imaging (MRI) in the 1970s, its use has grown exponentially worldwide, due to its ability to give high resolution images in the body, allowing the early diagnosis and accurate prognosis of many diseases[1,2]. In contrast to computed tomography (CT), MRI uses no ionising radiation, has superior soft tissue contrast and allows the probing of metabolic processes due to the ubiquitous nature of water in our bodies. With regards to the liver, it has become an essential tool for anatomical assessment. In addition, current cutting edge methods allow for quantification of liver fat, liver iron and staging of fibrosis levels within the liver[3-5]. These methods have the possibility to provide early detection and staging of many chronic liver diseases (CLDs), and are becoming more in demand with the rising prevalence in liver disease in western society. With 1/3 of adults believed to have non-alcoholic fatty liver disease (NAFLD) and 12% the more severe non-alcoholic steatohepatitis (NASH), NAFLD has been defined as a silent pandemic and the most prevalent liver disease in human history[6-9]. As there is currently no medical treatment for NAFLD beyond lifestyle interventions, the need for early detection is paramount, so that the disease progression can be halted and reversed, and MRI can play an important role in this[10].
The need for early detection is not only limited to CLDs but is also important in detection of liver cell cancer (hepatocellular cancer; HCC). With mortality rates from HCC predicted to rise to become the third highest leading cause of cancer-related deaths in the US by 2030, the need for early diagnosis is needed so that treatment can be effective[11]. Currently this requires expert radiologists studying liver MRI scans trying to find a tumour. Though many tumours are identified, some tumours can also be missed, with one study finding that 16% of lesions were missed in multiparametric MR imaging of the prostate, highlighting the need for a method for identifying these missed cases[12].
Early detection can be addressed in many liver diseases using liver MRI. The current gold standard for staging is liver biopsy, however, it is invasive, is localized (sampling error) and has risk of complications[13]. Liver MRI is overtaking this standard, due to being non-invasive and allowing global metrics to be calculated across the whole liver. When diagnosing liver fibrosis stage, an important biomarker in staging NAFLD, many different sequences have predictive potential, such as MRE, T1 and T2* mapping, diffusion weighted imaging (DWI) and hepatocellular function imaging using contrast agents[14]. When identifying HCC within the liver, hepatocellular function imaging is commonly used, however DWI also has good predictive power[15,16]. These methods all require a level of expert analysis to interpret the images, similarly to biopsies, which means they are prime candidates for automation using AI methods.
Artificial intelligence (AI) techniques, have been shown to perform well when applied to computer vision problems, from classification of objects in a photograph to fast object segmentation of video frames for self-driving cars[17,18]. These techniques have also been applied successfully to many areas of MRI in the body, such as segmentation of brain tissue, ejection fraction prediction and diagnosis of heart conditions[19-21]. An AI approach to report mammograms for the presence of breast cancer has been shown to outperform radiologist reporting[22]. AI techniques in Liver MRI are relatively underdeveloped compared to brain and cardiac MRI, but nevertheless, they provide opportunities to alleviate workload in many settings.
In this review, we assess the current gold standard of AI in liver imaging. Specifically, we review the recent application of AI techniques for segmentation (Table 1), classification (Table 2) and image synthesis for different CLDs and MR imaging techniques. We briefly provide an overview of AI techniques in the field, describe the implementation of AI to achieve these applications and explain how they are quantitatively and qualitatively assessed. We explore the publications that have sought to solve these problems and assess the challenges that still face the field.
Table 1 Applications of artificial intelligence segmentation methods to liver magnetic resonance imaging.
We broadly focus on two subsets of AI algorithms: traditional machine learning (ML) algorithms and deep learning (DL) algorithms. Traditional machine learning algorithms often rely on the input of handcrafted features, an additional piece of data which has been derived from acquired data. In the case of MR images, these handcrafted features are often statistical measurements such as the mean intensity of the image or a sub region of the image, and are called radiomic features as they are derived from medical images. These radiomic features are then passed to a statistical model, such as a support vector machine (SVM), kMeans Clustering, random forests or a naïve bayes algorithm among many others[23,24]. These models can either be supervised, where you have a desired target outcome, or unsupervised, where no target outcome is enforced. When you have selected the appropriate model for your task, the model is then trained. In the case of supervised models, the model updates its parameters to minimise the error between your desired output and the model output, as new data is sequentially passed to it. An example would be inputting radiomic features extracted from tumours and the model getting better at classifying the tumours into their classes, such as hepatocellular carcinoma (HCC) or intrahepatic cholangiocarcinoma (ICC), as it updates its parameters to minimise the error between its output prediction and the ground truth. In the case of unsupervised models, the model updates its parameters to be able to separate input data into a predefined number of classes, without knowledge of what those classes may be. In the above example, you would input the radiomic features from different tumours and ask the model to output two distinct classes for HCC and ICC, without explicitly giving the model information about which tumour corresponds to which class. During training you monitor the success at a desired task and stop training once the model performance meets some predefined criteria, such as the model no longer improving even when new data is added. If the model is accurate, i.e., it rivals human performance, it can then be used in a research or clinical setting.
LeCun et al[25] defines DL methods as ML methods with multiple levels of features, obtained by composing simple but non-linear modules that each transform the feature at one level (starting with the raw input) into a feature at a higher, slightly more abstract level. In essence, this means that DL algorithms calculate successive features based on the features or data that you provide it. The most common way of doing this in MR images is to employ convolutional layers. A convolution, in terms of images, is a filter of a defined size, which when applied to a portion of an MR image of the liver equal to the size of the filter, outputs a singular value, as shown in Figure 1. When applied sequentially to a whole scan, it outputs an image containing these values, known as a feature map. Additional convolutional layers are applied to these feature maps, to produce feature maps with deeper information. When these layers are stacked together, a convolutional neural network (CNN) is generated. The final convolutional layer generates the desired size of your output, anything from a single value to classify the disease state, or a new image which could be a segmentation map of the liver. Like traditional machine learning, the accuracy of the output compared to a gold standard measurement, is maximised during training.
Figure 1 A deep convolutional network.
An example deep learning segmentation network, the U-Net. A series of convolutions, combined with downsampling and upsampling to learn feature maps at different scales, are used to output a segmentation map. An example of a convolution, and feature map are shown on the right.
SEGMENTATION
Segmentation describes the process by which anatomical structures can be selected from a radiological image. Anatomical structures can be organs like the liver, tissues like subcutaneous and visceral fat or malignant deposits. Metrics resulting from the segmentation process and segmentation maps can help with estimation of volumes (e.g., liver volume), important metabolic ratios (ratio of visceral to subcutaneous fat) and provide important anatomical information that can help in the radiotherapy and surgical planning for the treatment of malignant tumours[26,27]. Segmentation can therefore play an important role in many aspects of clinical decision making. Segmentation maps are also often used in quantitative techniques, such as T1 mapping and MRE, to give accurate measurements across the whole liver and not just in a region of interest[26,28].
The segmentation processes are usually carried out manually using software tools for this purpose. However, these manual processes can be time consuming and inaccurate, and the introduction of automated AI methods can reliably supersede these methods, improving output and reliability by performing close to the level of expert radiologists in a much shorter time[28]. For example, automatic segmentation to measure liver fat, adipose tissue depots and muscle volume and fat content led to an improved risk stratification for the presence of type 2 diabetes and cardiovascular disease compared to discrete categorisations of body composition in a large population study (n = 10000)[29]. Such a study would not be possible without automatic segmentation to measure the parameters of interest.
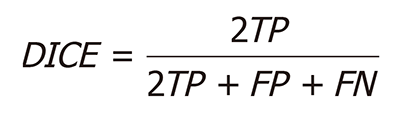
When applying AI algorithms to segmentation tasks, the aim is to highlight every voxel in an MR image that applies to a certain class. For example, this could be that the voxel contains the liver, a tumour, or neither. Though different algorithms have different approaches to achieving this goal, they are all evaluated by their ability to correctly identify which voxel of the MR image corresponds to which class. One common metric for evaluating this is the DICE score, which is defined as follows (Formula 1):
Where TP is the number of true positives, where the voxel has been correctly classified, FP the false positives, where the voxel has been incorrectly given a class instead of no class, and FN the false negatives, where a voxel which belongs to a desired class has been labelled as belonging to no class. If the DICE score is high, then the segmentation map is accurate. Additional metrics of performance do exist, such as intersect over union (IoU), where the closer to 1 the result is, the better the segmentation.
Though non-deep learning AI segmentation methods do exist, the majority of papers presented here are based on deep learning methods due to the successful application of these methods in natural image space, an example being the U-Net, as shown in Figure 1[30]. Though other methods are used, the U-Net is the most common due to its proven performance in segmentation maps, in part down to its ability to learn features at different scales due to the downsampling, and inclusion of previous feature maps in the concatenation steps.
Segmentation for surgical and radiotherapy planning
Segmentation maps are crucial in surgical planning, especially in giving the clinician information of the size and location of tumours, to allow for safe and successful surgery. They are also useful in radiotherapy planning, allowing the therapy to be performed such that there is minimal risk to organs and maximal damage to tumours.
Chen et al[31] and Huang et al[32] implemented a 2D U-Net, with densely connected blocks, to segment up to 10 organs at risk in radiotherapy. They achieved a DICE coefficient of 0.963 ± 0.0010 in the liver with high metrics in most of all the other organs studied. Likewise, Valindria et al[33] and He et al[34] trained a 2D residual network to segment out multiple organs in CT or MR scans which can similarly be used for radiotherapy planning. The use of both modalities increased performance in both their segmentation maps, achieving a DICE score of 0.914 in the liver, when compared to training with just one modality. This is still less than that achieved by Chen et al[31], even with the additional information from the CT scans used in the Valindria study. This may be due to the use of T2-weighted MR images being used by Valindria et al[33] as opposed to T1 -weighted. Fu et al[35] used a trio of CNNs to segment multiple organs in images acquired on a dual radiotherapy MR machine, in order to expediate the MRI guided adaptive radiotherapy. They achieved a DICE score of 0.953 ± 0.007 in the liver. The segmentations took approximately 5 s to produce and as such could not be used yet in a real-time radiotherapy setting, however, the method does still alleviate radiologist workflow, where they only quality control the output which takes a quarter of the time of a full manual segmentation. Bousabarah et al[36] automate the segmentation of the liver and classification of tumours within into the Liver Imaging Reporting and Data System (LI-RADS) classes. They used a 2D U-Net to segment contrast enhanced MR images into two segmentation maps, one of the liver and one of any tumours within. The proposed tumour segmentation then undergoes post-processing by using a random forest classifier using radiomic features extracted from the proposed region. The combined model detected 75% of lesions in the test data, when there was a DICE score of 0.2 or greater between the detected and actual tumour. The output could not only be used in surgery and radiotherapy planning, but also be used in conjunction with a radiologist’s assessment to improve detection accuracy. They achieved a similar performance as Valindria et al[33], but with the harder task of segmenting out bodies within the liver itself, which will likely decrease performance in liver segmentation. Mole et al[37] and Owleret al[38] used a 3D U-Net to segment out the liver in a pipeline for surgical planning. They segmented the liver in a T1-mapping acquisition with a DICE score of 0.970. The metrics calculated using this segmentation map were used to predict post-operative liver function with a high degree of accuracy. This shows that the method could be used in determining whether a patient should go for surgery or whether other treatments should be considered. Christ et al[39] implemented two 2D U-Nets to segment out the liver and metastases within the liver, in both CT and MRI images, which could be used both for radiotherapy planning and measuring response to therapy. The first U-Net segments out the liver region, which is used to process the input MR image. The second U-Net segments out any tumours within this identified region. They achieved a DICE score of 0.87 when applied to diffusion weighted MRI images. Jansen et al[40] utilised information from both dynamic contrast enhanced MRI (DCE-MRI) and DW-MRI to segment out the liver and metastases within, achieving a DICE score of 0.95 in the liver, and an accuracy of 96% in detecting the liver metastases.
Non-CNN based methods have also been used to segment out the liver in multi-phase contrast enhanced MRI[41]. Ivashchenko et al[41] used a K-means clustering algorithm on multiple phases of the contrast enhancement to generate 8 initial compartments. They then select a best candidate and apply multiple post-processing non-AI methods to generate a full segmentation of the liver, achieving a DICE score of 0.949 ± 1.2. This method could also be used to segment out the vessels and biliary tree, allowing safer execution of complicated liver resections. Masoumi et al[42] also used a non -CNN based method using both traditional non-AI methods, the watershed algorithm, and an artificial neural network (ANN) to automate the traditional algorithm. Six ANNs were trained to estimate 6 chosen features from the image, such as the ratio of the maximum and minimum diameter of the liver. These also extracted from the watershed algorithm and the error between the two feature sets calculated. This error is then iteratively used to update the watershed algorithm parameters until there is no longer a reduction in the error between the two feature sets. They achieved a mean Intersect over Union (IoU) of 0.94.
Segmentation of the liver when applied to surgical planning is, in most studies covered, exceeding a DICE score of 0.9. Variations in this value for the liver will likely be down to imaging protocol used (T1-weighted, T2-weighted, etc.), the patient group of interest, and the target outcome, in this case whether you are optimising to segment out the liver or whether it is a subtask among others, e.g., segmenting out metastases or multiple over organs.
Segmentation for liver function assessment
Another application area for AI segmentation methods is liver function assessment. A full liver segmentation provides a more comprehensive estimation of liver function compared to region of interest placement. To get an overview of whole liver quantitative measures, radiologists must take the time to create these segmentations, that can easily be automated. Winther et al[27] showed that it is possible to segment out Gd-EOB-DTPA-enhanced liver MR images to calculate liver volumetry to assess hepatic functional reserve. They trained a 3D U-Net using the liver images of 100 patients, achieving a DICE score of 0.967 ± 0.019, when compared to two experts who had a corresponding DICE score of 0.952 ± 0.028. The segmentation time using a 3D U-Net took on average 60 s to generate a 3D segmentation map, compared to 10 min for an expert. Another study seeks to automate quantification of liver iron using a liver segmentation[30]. Liu et al[30] used a 2D U-Net to output a segmentation map for a T2* quantitative map, generated using 16 slices from the T2* relaxometry method used to calculate it. They achieved a DICE score of 0.86 ± 0.01 with the manual segmentations and subsequently a strong correlation of the liver iron in mg/g calculated using the automated and manual methods. This lower DICE score in T2*-weighted images correlates with the lower DICE score seen in the Valindria et al[33] study above, suggesting that it is harder for these networks to segment the liver in T2* weighted images, or that it is harder for humans to segment out the liver accurately in T2*-weighted images leading to a larger variation in your training dataset. Wang et al[43] implemented a 2D U-Net to segment the liver from abdominal MRI and CT scans. They achieved a DICE score of 0.95 in 100 T1-weighted MRI scans, and 0.92 in T2*-weighted MRI scans. They used the segmentations to automate the calculation of liver volumetry and hepatic PDFF, both of which had good agreement with manual segmentation derived values. Liver function assessment can also be performed during scanning. Irving et al[44], used a 2D U-Net to segment out the liver with exclusion of internal vasculature, so that quantitative liver T1 scores could be calculated. They achieved a DICE score of 0.95. The above four studies, all showed to have liver function assessment measurements that correlate with the current methods. Though, most of the measurements derived from the automated segmentations are usually derived from manual segmentations and so if the segmentation is accurate, then it should be expected that the output measurement would correlate highly. Yang et al[45] also used a 2D U-Net to generate segmentation maps of the liver, however by using a process known as disentangled representation, they were able to transform MR and CT images into a shared image space which contains only shared content. On these images, they achieved a DICE score or 0.891 ± 0.040. This segmentation network could be applied to multiple imaging modalities, which could be useful in clinical uptake as the end user won’t have to carefully choose which model they apply. However, if accuracy of segmentation is the most important outcome, then many of the papers covered here have shown better performance when seeking to maximise the segmentation accuracy in a single use case. Cunha et al[46] used AI methods to determine the optimal point for hepatobiliary phase acquisition in contrast enhanced MRI, thus avoiding overwaiting. They used a 2D U-Net to segment out a liver mask, which is applied to the original image. This masked liver is then passed to a classification CNN, which outputs a contrast uptake quality ranging from 0, minimal uptake, to 1, adequate uptake. They achieve an area under the receiver operating characteristic (AUROC) curve of 0.952 in the test set, indicating good classification accuracy. By applying their model in situ, they could reduce examination time in 48% of patients, by detecting when optimal uptake of contrast has occurred.
CLASSIFICATION
Classification or stratification is an important step in any disease treatment in healthcare. Without a proper classification of the disease causing symptoms, it is not possible to implement the correct medical response. Unfortunately, some diseases are hard to differentiate, even by experienced healthcare professionals. Providing additional support in this task could help ensure that patients are stratified correctly and swiftly. AI algorithms have been shown to deal well with image-to-class-based tasks, as demonstrated in applications to the ImageNet dataset[47].
AI classification algorithms are almost identical in their approach as segmentation networks. Whereas segmentation networks classify each voxel in an image, a classification seeks to classify all voxel in an image into a single class. They are evaluated against their ability to do this, by use of metrics such as accuracy, the percentage true positives and true negatives, sensitivity, the rate of true positives, specificity, the true negative rate, and by using receiver operating characteristic (ROC) curves, the true positive rate vs the false positive rate (1 – true negative rate/specificity), as shown in Figure 2.
Figure 2 Classification algorithms and their performance metrics
. Artificial intelligence classification algorithms use the combination of data provided to them and output a class probability. They are often evaluated according to the metrics on the right. MR: Magnetic resonance; AUROC: Area under the receiver operating characteristic curve.
Tumour detection and classification
Tumour classification is a useful tool in staging the severity of the cancer. The ability to differentiate between the various types of liver tumours would give the ability to medical professionals to implement an optimised treatment plan. Wu et al[48] used the AlexNet network architecture to classify cropped HCC tumours into either LR-3 (intermediate probability for HCC) or the combined class LR-4/LR-5 (likely/definite HCC respectively)[48,49]. They achieved a 90% accuracy in classification and an AUROC 0.95 with reference to an expert radiologist. Messaoudi et al[50] achieved similar accuracy when applying a CNN to classify HCC tumours from liver dynamic contrast enhanced (DCE) MRI sequences with an accuracy of 90% when classifying between HCC and non-HCC. Hamm et al[51] also implemented a CNN for the classification of tumours into both the LI-RADS grading system and the lesion class. Their input to the network was the three phases, arterial, venous and equilibrium phases, of the contrast enhanced scans. They achieved an accuracy of 91.9% when classifying into the distinct lesion classes, and an accuracy of 94.3% when classifying into the LI-RADS score. This was both more accurate and faster (1.0ms runtime of the model) than two radiologists on the same dataset. When comparing to the study by Wu et al[48], though they both sought to differentiate cases using the LI-RADS system, Hamm et al[51] differentiated into more classes (LR-1,LR-4,LR-M) instead of just between LR-3 and LR-4/5. Hamm et al[51] outperformed the performance of Wu et al[48], however it is likely that it is harder to differentiate between LR-3 and 4/5, so they are not directly comparable. Ideally a neural network would be able to differentiate between all LI-RADS classes. Kim et al[52] used a CNN to detect presence of HCC in liver MRI scans. By simplifying the problem into detection without segmentation, they get a high accuracy of 93.7% in detecting liver HCC lesions. This was comparable to the performance of a junior radiologist with an AUROC of 0.9 compared to 0.893, though was outperformed by an expert radiologist who had an AUROC of 0.957. Zhen et al[53] used a CNN to classify tumours into multiple classes of benign, primary malignant and metastatic tumours using a combination of MR, clinical data and laboratory results. When using all the data together they achieved their best model performance with AUROCs of 0.951, 0.985 and 0.989 when classifying HCC, metastatic malignancy and primary malignancy (excluding HCC) respectively. Trivizakis et al[54] trained both a 2D and 3D CNN to classify liver tumours into primary and metastatic classes. The 2D network took the axial slices as input, whereas the 3D network took the abdominal volume. Unlike the papers above, they then used the features learnt during the training of these networks to train a support vector machine (SVM), a non-CNN based AI approach. They achieved an accuracy of 83% in the SVM trained on the features from the 3D network, and 67.4% in the SVM trained on the features from the 2D network. When not using the SVM as an additional step, they achieved an accuracy of 85.5% in the 3D network, with unreported accuracy in the 2D network though they conclude that the 3D model outperforms this. It shows that the inclusion of additional data, in this case more slices as a volume, often leads to an increased performance in the network performance. Though that does not always hold true, as in the study by Hamm et al[51] where the inclusion of all phases of a gadoxetic acid-enhanced MRI scan produced worse results that selected phases. It is important that the addition of data is performed with care, such that you are not adding more noise to the data.
Radiomic-based approaches have also been shown to be successful in classifying detected tumours into potential classes. Liu et al[55] extract radiomic features from tumours manually segmented from Gd-EOB-DTPA-enhanced liver MR images. These features are input into two support vector machines (SVM), with the first classifying into combined hepatocellular cholangiocarcinoma (cHCC-CC) or non-cHCC-CC, and the second classifying into HCC and non-HCC. They achieved a mean AUROC of 0.77 ± 0.19 and 0.81 ± 0.13 for the first and second methods respectively. Conversely, radiologists misdiagnosed cHCC-CC as HCC or CC in 69% of cases. With the model accuracy higher than that of the radiologists, having the model available as an additional tool for radiologists would help improve the diagnostic accuracy. Lewis et al[56] used extracted radiomic features from diffusion weighted imaging (DWI) MR, combined with LI-RADS category, to classify whether a tumour is HCC or another primary liver cancer such as intrahepatic cholangiocarcinoma (ICC) and combined HCC-ICC. Using binary logistic regression, they achieved an AUROC of 0.9 and 0.89 when compared to two observers. This is comparable in performance to similar LI-RADS based studies above, but without the expertise an training time needed for a large neural network. Another radiomic based study, by Wu et al[57], similarly extracted radiomic features from lesions detected in T2-weighted and DWI images. They achieved a similar AUROC score of 0.89, when compared to Lewis et al[56], by also using logistic regression on their extracted features. They additionally showed that their model outperformed a junior radiologist with 2 years’ experience and rivalled a senior radiographer with 10 years’ experience. Other radiomic based studies have shown similar performance, when applied to tumour classification, when using a variety of MR sequences and often the addition of additional non-MR features such as BMI and medical records[58,59].
Liver disease staging and response
Liver fibrosis staging is used clinically in predicting the prognosis of liver diseases and helps in determining the appropriate action to take in treatment[60]. Several approaches of AI applications on liver MR have been described for the assessment of liver fibrosis. Hectors et al[60], used a VGG16 network to predict the fibrosis stage from F1-4 using Gd-EOB-DTPA-enhanced liver MR images. The network, which was pretrained on image net with only the last few layers being trainable, predicted a class from F1-F4, F2-F4, F3-F4 and F4, achieving an AUROC of 0.77, 0.91, 0.91 and 0.85 respectively, showing good diagnostic ability. This was comparable to the use of MRE with no significant difference between MRE and the use of deep learning methods for fibrosis prediction. The diagnostic performance of combined MRE and AI classification of contrast enhanced MRI was better overall at 0.87, 0.93, 0.95 and 0.87 for F1-F4, F2-F4, F3-F4, and F4 respectively, but was not significantly better than MRE alone. Schawkat et al[61] also sought to quantify the liver fibrosis from T1- or T2-weighted MR images. To do this, they did an initial texture analysis, to extract handmade features from the data. These handmade features underwent some pre-processing, then were input into an SVM which was trained to output whether the patient had a high fibrosis score, 3-4 on a standardized scale using multiple different scoring approaches, or low fibrosis score, 0-2. They achieved an AUROC of 0.82 for T1 and an AUROC of 0.57 for T2. However, when applied to MRE they achieved an AUROC of 0.92. This shows that machine learning methods are only as good as the data that is input. In the above two cases, MRE contains the information needed to output an accurate classification. However, MRE is often expensive and limited to highly funded MRI centres, therefore it is still important that techniques that don’t use MRE are explored and developed while uptake of MRE is limited. The two studies above have shown in this case that deep learning methods are outperforming more traditional methods, however the use of two different scanning sequences doesn’t allow for a direct comparison, as any difference in performance could be down to the data provided. Yasaka et al[62] also used a CNN with contrast enhanced MR images and clinical information as input, to stage liver fibrosis. They achieved AUROCs of 0.84, 0.84 and 0.85 for classifying into cirrhosis, advanced fibrosis and substantial fibrosis respectively. They were unable to differentiate fibrosis scores as well as Hectors et al[60] with similar methods, likely due to the Hectors study pre-training on Image Net data and so compensating for the small datasets that these study have to train on. Radiomics combined with a logistic regression model has also been used to classify into liver fibrosis scores. Park et al[63] extracted radiomic features from Gd-EOB-DTPA-enhanced liver MR images, and used these to classify into F0 to F4 fibrosis stages, achieving an accuracy of 80.3% in classifying F2-F4, 80.3% in F3-F4 and 81.3% in F4. Gallego-Duran et al[64] used radiomics approaches, combined with a logistic regression classifier, on non-contrast enhanced MRI scans to define the NASH-MRI and fibro-MRI score that could diagnose non-alcoholic steatohepatitis and advanced fibrosis with an AUROC of 0.83 and 0.85 respectively. He et al[65] utilised an SVM to classify patient groups into MR elastography liver stiffness measurement of ≤ 3 kPa and ≥ 3 kPa as surrogates of low and high fibrosis burden respectively, They combine radiomic features derived from T2-weighted images, with clinical data such as blood scores, BMI and their medical history. The SVM achieves an accuracy of 81.8% with an AUROC of 0.84.
Portal hypertension is one of the complications of liver fibrosis and develops in late stage disease. Portal hypertension is usually assessed by the hepatic vein pressure gradient with a gradient of ≥ 10 mmHg signifying “clinically significant portal hypertension (CSPH)” which is associated with a higher risk of adverse outcomes. AI techniques to identify CSPH have been applied to CT and MR images with some promising results. Liu et al[66], used a CNN to predict the presence of CSPH in both the liver and the spleen, which were then input into a logistic regression model to output an overall prediction. They achieved an AUROC of 0.940 in their test set when classifying between CSPH and non-CSPH.
Zhao et al[67] extracted radiomics from four MRI acquisitions (fat suppressed T2-weighted images, arterial phase, portal venous phase and delayed phase of contrast enhanced imaging) to predict early recurrence of intrahepatic mass-forming cholangiocarcinoma (IMCC). This was combined with biomarkers from histology studies, and input into a logistic regression model, to achieve an AUROC of 0.949 in predicting early recurrence of IMCC. This would assist in personalising a treatment plan for each patient. Reimer et al[68] utilised a radiomics approach combined with logistic regression, to predict the response to therapy in patients with liver metastases. They classified patients into two classes of stable disease and progressive disease based on features extracted from dynamic contrast enhanced MR images taken at a mean of 2.2 d after transarterial radioembolization. They achieved an AUROC of 0.73 and 0.76 in the radiomics extracted from the arterial and venous phase respectively. Chen et al[69] used a combination of clinical data and radiomics with decision trees to predict the immunoscore of HCC pre-treatment and therefore its response to therapy. Their best model, when using all the clinical and radiomics data, achieved and AUROC of 0.926 when classifying into high (≥ 3) and low (≤ 2) immunoscores. Finally Kim et al[70] utilise random forests with radiomics to predict the postoperative reoccurrence time of single HCC. Additionally, they combine their radiomics model with a clinicopathologic model. When evaluating their model using Harrell c-index, a measure where higher than 0.5 has predictive value, their combined model was 0.716. This was better than the current clinicopathologic model (0.696), however the difference was not significant. As Kim et al[70] and Zhao et al[67] use different performance metrics, it is hard to compare their ability in tumour reoccurrence, regardless of each study focusing on different tumour types. It is important that these studies, where possible, quote similar metrics so that future researchers can determine which one is best for their task.
IMAGE SYNTHESIS
It is often the case that, when training an AI model, we are limited by the data that we have available. This is also true in healthcare settings when making clinical decisions. The simplest way to rectify this lack of data is to find more, however, this is not always possible due to many reasons both medical and logistical. The field of image synthesis or domain transfer seeks to address this. These algorithms can generate synthetic MR data based on information they are provided with, allowing this data to be either used in a setting where you might not have access to a particular technique, e.g., hospitals without an MR scanner, or used to improve AI algorithms by giving it more data to train on. A common group of networks for image synthesis are conditional generative adversarial networks (cGAN). A cGAN combines a generator network, e.g., a U-Net for generating the new MR image, and a discriminator network, a classification network to distinguish between real ground truth MR image and fake generated image. These networks compete against each other. The generator seeks to create an output that the discriminator believes is anatomically plausible, and the discriminator seeks to detect the output of the generator. This adversarial training often leads to improved results in segmentation or domain transfer tasks.
Liu et al[71] developed a cGAN to generate CT images from T1-weighted MR images, also to aid clinicians in radiotherapy treatment planning. They achieved a low mean absolute error of 72.87 HU in their generated CT scans. Jiang et al[72] used a cGAN to perform the opposite transformation of synthesising MR images from CT images in order to improve segmentation maps of organs at risk in MR for radiotherapy planning. They achieve a DICE score of 0.91, 0.92 in the liver when applied to real non-synthesised T2-weighted images and T1-weighted images respectively.
GANs were also implemented in Zhao et al[73] study to synthesise contrast enhanced MR images from non-contrast enhanced images, in order to improve tumour detection. They combined this with an additional tumour detection CNN which was applied to synthetic images in order to help improve the quality of the synthesised image, and the detection of tumours. The combined synthesis and detection networks achieved a classification accuracy of 91.3% when classifying between healthy and hemangioma present, 88.4% when classifying between healthy and HCC present and 89.2% when classifying between hemangioma and HCC. This combination of networks not only allows for accurate detection of tumours, but also supersedes the need for a contrast enhanced scan, while still giving the radiographer a proposed contrast scan to aid in their diagnosis.
ARTEFACT DETECTION
Motion detection and removal
Artefacts can occur in many forms in MRI scans, from patient induced breathing artefacts to scanner related field susceptibility artefacts. AI based methods, as shown with classification and image synthesis, have the potential to detect these artefacts and generate artefact free images which can then be used in a clinical setting. Motion is the dominating artefact present in many MR techniques. Breath holding is necessary in most scanning protocols to reduce movement artefacts. New scanning sequences are specifically designed to be shorter (i.e., shorter breath-holds) and produce the same output in order to reduce these problems[74,75]. However, motion still occurs even when these steps are implemented. AI offers us the opportunity to detect, so that re-acquisition of the scans can occur; remove, so that a motion degraded scan can be used clinically; and predict, so that free-breathing methods can be used with optimal acquisition.
Romaguera et al[76] have developed a spatial transformer network that takes an image sequence and predicts the next image in the sequence with an error in vessel localisation of 0.45 ± 0.55 mm when 320 ms has passed. This rises to 0.77 ± 1.36 mm at 1.6 s, but still allows the accurate prediction of frames in the future based on what has been acquired so far. This would be useful in predicting when to acquire a scan so that any data is motion free, and can also be useful in the MR-Linac systems so that radiotherapy is only applied to any tumours within the liver, reducing damage to the organs. Esses et al[77] used a CNN, similar to those presented in the classification section, to classify artefact degraded images into a quality score of diagnostic to non-diagnostic. They achieve a concordance rate with two trained radiographers of 79% and 73%. Tamada et al[78] utilise a CNN to reduce motion artefacts caused by respiratory motion in DCE-MRI. They generated simulated motion data from the ground truth data and then trained a network to predict the residual between that and collected ground truth data. They then tested on non-simulated motion degraded data, with radiographers rating on a scale of no artefact (0) to non-diagnostic (5). The output of the network was better by a mean score of 0.37 and 0.35 when rated by two radiologists. Kromrey et al[79] utilised the same CNN to reduce motion artifacts in arterial phase contrast enhanced MRI by 0.56 on average, on a scale of no artifact (0) to severe artifact (4). Küstner et al[80] try both a GAN and a variational autoencoder to remove motion artefacts from both brain and abdominal liver scans. The GAN was able to reduce the presence of motion artefacts by 67% and 65% when evaluated by two experienced radiologists. The same group had also previously used a patch based CNN to predict the amount of motion in a specific region of an image, achieving an accuracy of 72% ± 5% in classifying the images into motion from no motion to strong motion[81]. As many of the above techniques rely on radiologist qualitative assessment, they can be heavily biased by the skill of those doing the check, and as such can’t be compared well as the improvement is highly subjective. More importantly though all studies showed an improvement when comparing before and after, and all the radiologists were suitably blinded. Oh et al[82] used an unsupervised GAN to correct for motion in Gd-EOB-DTPA-enhanced MR images. They did this by down sampling k space in each input image and regenerating the fully sampled image. This would train the network to reconstruct the missing data from what it is given, and so generate data without artefacts if clean data is given. They then apply it to artefact degraded images, achieving an improvement from 3.20 ± 1.28 to 1.95 ± 0.94 on a scale of 1 (no artefacts) to 5 (non-diagnostic) when applied to artefact degraded images. Wang et al[83] used a two-step approach by segmenting the liver from MR scans using a U-Net, then using this to extract patches from the liver which are classified into diagnostic and non-diagnostic. They achieved a DICE of 0.90 ± 0.05 in their liver segmentation, and an AUROC of 0.911 [95% confidence interval (CI): 0.882-0.939, P < 0.05] when classifying. The predictive performance when using patches extracted from the liver was better than trying to directly classify from the whole image (AUROC of 0.802, 95%CI: 0.759-0.846, P < 0.05). Though this final method shows a greater performance when using patches, we believe it is unlikely that each individual patch was classified for whether it was diagnostic or non-diagnostic, therefore this process would fail if applied to artefacts which only have affect a sub region of an image.
IMAGE REGISTRATION
Registration of two MR images into a shared cartesian space is an important step in allowing comparisons to be made. This could be longitudinal comparisons in a single participant in order to stage disease progression and treatment response, or it could be latitudinal comparisons within a patient cohort for research studies. Additionally, the registration of two different modalities is important when differing but complimentary clinical information is in different scan types such as CT and MR. In all cases, the manual task of registering images can be time consuming and is often composed of rigid body transformations and as such it is hard to compare between two participants of differing dimensions. AI methods can help solve these issues by introducing fast, reliable non-rigid deformation techniques for image registration.
Kuznetsova et al[84] looked into the use of a commercial AI based registration software for the registration of CT and MRI. They assessed the performance of their registration for three different seed points, using the liver contour, using an internal liver structures such as the inferior vena cava (IVC) or portal region (PR), and using internal liver structures along with the liver contour. They achieved the highest performance when using just the liver contour, with a DICE score of 0.89 in the liver segmentation and 0.76 in the IVC segmentation when compared between MR and CT segmentations. As they used commercial software, we are not able to comment on the model used, however it does show that these methods have already been developed for those who need them. Fu et al[85] similarly assessed the performance of their bespoke MRI and CT registration CNN by assessing the DICE score between the two segmentations. They achieved a score of 0.93 ± 0.02 in the whole liver segmentation, outperforming the previous study.
CONCLUSION
Current challenges and future directions
Though the benefits of AI algorithms in Liver MRI have been displayed above, there are also many obstacles in the way of application in the clinic where they can have an impact. The first and foremost is that of open data, i.e., the access to large publicly-available clinical databanks. Many of the studies above have used internal datasets which are specific to a certain hospital or patient group. Though performing well in their specific setting, they are limited in scope and generalizability due to un-modelled variations across different hospitals. Additionally, these datasets are rather small for the purpose of training ML algorithms which perform better when trained on more data, and will thus benefit from a larger suitable dataset. However, of the large datasets available, such as UKBiobank, most are focused on healthy volunteers and not clinically relevant patient cohorts. This means any AI algorithm trained on these datasets must be applied with care and knowledge of their limitations. By pooling datasets of clinical patients, the AI algorithms will both perform better, due to the increased data to learn from, and be universally applicable, due to the increased variation.
The second challenge will be overcoming scepticism towards AI algorithms. Deep learning algorithms are often termed “black boxes”, due to their lack of interpretability. This is problematic when the model fails, as it is impossible to reason why. Therefore, care must be taken to apply models in their correct setting, i.e., on data that fits within the distribution of that which the model was trained and tested. If interpretability is desired and a-priori knowledge and physical/biological assumptions are to be incorporated in the model, then traditional ML methods should be used, as they allow to select features and focus on ROIs more easily than with DL. Radiomics is an example of this, as you are able to determine how the model you use weighs the importance of each input feature. From this you can start to reason why the model might fail. As with deep learning methods though, when used in conjunction with radiologists, it can be a vital tool in getting the cases which are traditionally missed.
Finally, the third challenge is translating these networks into clinical workflows. The above papers have shown an ability to either speed up or achieve a radiologist level accuracy in many tasks they perform. However, until recently, there was no standard protocol into getting these networks approved for mainstream use. In April 2019, the US Food and Drug Administration published a paper on the proposed regulatory framework for AI/ML based software as a medical device and have since developed new rules and processes for approval of AI assisted software[86]. Since these new rules have been implemented, multiple AI methods have been given approval, but their wide spread use is still limited. Therefore, developing a framework for widespread distribution should be implemented.
If the above challenges can be addressed, the techniques shown in this review and those yet to be invented can positively transform many aspects of medical imaging in years to come.
Kasivisvanathan V, Rannikko AS, Borghi M, Panebianco V, Mynderse LA, Vaarala MH, Briganti A, Budäus L, Hellawell G, Hindley RG, Roobol MJ, Eggener S, Ghei M, Villers A, Bladou F, Villeirs GM, Virdi J, Boxler S, Robert G, Singh PB, Venderink W, Hadaschik BA, Ruffion A, Hu JC, Margolis D, Crouzet S, Klotz L, Taneja SS, Pinto P, Gill I, Allen C, Giganti F, Freeman A, Morris S, Punwani S, Williams NR, Brew-Graves C, Deeks J, Takwoingi Y, Emberton M, Moore CM; PRECISION Study Group Collaborators. MRI-Targeted or Standard Biopsy for Prostate-Cancer Diagnosis.N Engl J Med. 2018;378:1767-1777.
[RCA] [PubMed] [DOI] [Full Text][Cited by in Crossref: 1568][Cited by in RCA: 2159][Article Influence: 308.4][Reference Citation Analysis (0)]
Loomba R, Cui J, Wolfson T, Haufe W, Hooker J, Szeverenyi N, Ang B, Bhatt A, Wang K, Aryafar H, Behling C, Valasek MA, Lin GY, Gamst A, Brenner DA, Yin M, Glaser KJ, Ehman RL, Sirlin CB. Novel 3D Magnetic Resonance Elastography for the Noninvasive Diagnosis of Advanced Fibrosis in NAFLD: A Prospective Study.Am J Gastroenterol. 2016;111:986-994.
[RCA] [PubMed] [DOI] [Full Text][Cited by in Crossref: 129][Cited by in RCA: 166][Article Influence: 18.4][Reference Citation Analysis (0)]
Wong VW, Chu WC, Wong GL, Chan RS, Chim AM, Ong A, Yeung DK, Yiu KK, Chu SH, Woo J, Chan FK, Chan HL. Prevalence of non-alcoholic fatty liver disease and advanced fibrosis in Hong Kong Chinese: a population study using proton-magnetic resonance spectroscopy and transient elastography.Gut. 2012;61:409-415.
[RCA] [PubMed] [DOI] [Full Text][Cited by in Crossref: 356][Cited by in RCA: 390][Article Influence: 30.0][Reference Citation Analysis (0)]
McKinney SM, Sieniek M, Godbole V, Godwin J, Antropova N, Ashrafian H, Back T, Chesus M, Corrado GS, Darzi A, Etemadi M, Garcia-Vicente F, Gilbert FJ, Halling-Brown M, Hassabis D, Jansen S, Karthikesalingam A, Kelly CJ, King D, Ledsam JR, Melnick D, Mostofi H, Peng L, Reicher JJ, Romera-Paredes B, Sidebottom R, Suleyman M, Tse D, Young KC, De Fauw J, Shetty S. International evaluation of an AI system for breast cancer screening.Nature. 2020;577:89-94.
[RCA] [PubMed] [DOI] [Full Text][Cited by in Crossref: 1364][Cited by in RCA: 1193][Article Influence: 238.6][Reference Citation Analysis (0)]
Owler J, Irving B, Ridgway G, Wojciechowska M, McGonigle J, Brady M.
Comparison of Multi-atlas Segmentation and U-Net Approaches for Automated 3D Liver Delineation in MRI. In: Zheng Y, Williams BM, Chen K, eds. Medical Image Understanding and Analysis. Springer International Publishing, 2020.
[RCA] [PubMed] [DOI] [Full Text][Cited by in Crossref: 8][Cited by in RCA: 8][Article Influence: 1.6][Reference Citation Analysis (0)]
Wang K, Mamidipalli A, Retson T, Bahrami N, Hasenstab K, Blansit K, Bass E, Delgado T, Cunha G, Middleton MS, Loomba R, Neuschwander-Tetri BA, Sirlin CB, Hsiao A; members of the NASH Clinical Research Network. Automated CT and MRI Liver Segmentation and Biometry Using a Generalized Convolutional Neural Network.Radiol Artif Intell. 2019;1.
[RCA] [PubMed] [DOI] [Full Text][Cited by in Crossref: 50][Cited by in RCA: 75][Article Influence: 12.5][Reference Citation Analysis (0)]
Irving B.
Deep Quantitative Liver Segmentation and Vessel Exclusion to Assist in Liver Assessment. In: Valdés Hernández M, González-Castro V. eds. Medical Image Understanding and Analysis. Springer International Publishing, 2017: 663-673.
[PubMed] [DOI]
Krizhevsky A, Sutskever I, Hinton GE. ImageNet classification with deep convolutional neural networks. Commun.ACM. 2017;60:84-90.
[PubMed] [DOI] [Full Text]
Messaoudi R, Jaziri F, Vacavant A, Mtibaa A, Gargouri F.
A Novel Deep Learning Approach for Liver MRI Classification and HCC Detection. In: Lu Y. eds. Pattern Recognition and Artificial Intelligence. Springer International Publishing, 2020: 635-645.
[PubMed] [DOI]
Liu X, Khalvati F, Namdar K, Fischer S, Lewis S, Taouli B, Haider MA, Jhaveri KS. Can machine learning radiomics provide pre-operative differentiation of combined hepatocellular cholangiocarcinoma from hepatocellular carcinoma and cholangiocarcinoma to inform optimal treatment planning?Eur Radiol. 2021;31:244-255.
[RCA] [PubMed] [DOI] [Full Text][Cited by in Crossref: 24][Cited by in RCA: 71][Article Influence: 14.2][Reference Citation Analysis (0)]
Schawkat K, Ciritsis A, von Ulmenstein S, Honcharova-Biletska H, Jüngst C, Weber A, Gubler C, Mertens J, Reiner CS. Diagnostic accuracy of texture analysis and machine learning for quantification of liver fibrosis in MRI: correlation with MR elastography and histopathology.Eur Radiol. 2020;30:4675-4685.
[RCA] [PubMed] [DOI] [Full Text][Cited by in Crossref: 24][Cited by in RCA: 41][Article Influence: 8.2][Reference Citation Analysis (0)]
Gallego-Durán R, Cerro-Salido P, Gomez-Gonzalez E, Pareja MJ, Ampuero J, Rico MC, Aznar R, Vilar-Gomez E, Bugianesi E, Crespo J, González-Sánchez FJ, Aparcero R, Moreno I, Soto S, Arias-Loste MT, Abad J, Ranchal I, Andrade RJ, Calleja JL, Pastrana M, Iacono OL, Romero-Gómez M. Imaging biomarkers for steatohepatitis and fibrosis detection in non-alcoholic fatty liver disease.Sci Rep. 2016;6:31421.
[RCA] [PubMed] [DOI] [Full Text] [Full Text (PDF)][Cited by in Crossref: 26][Cited by in RCA: 25][Article Influence: 2.8][Reference Citation Analysis (0)]
Liu Y, Ning Z, Örmeci N, An W, Yu Q, Han K, Huang Y, Liu D, Liu F, Li Z, Ding H, Luo H, Zuo C, Liu C, Wang J, Zhang C, Ji J, Wang W, Wang Z, Yuan M, Li L, Zhao Z, Wang G, Li M, Liu Q, Lei J, Tang T, Akçalar S, Çelebioğlu E, Üstüner E, Bilgiç S, Ellik Z, Asiller ÖÖ, Liu Z, Teng G, Chen Y, Hou J, Li X, He X, Dong J, Tian J, Liang P, Ju S, Zhang Y, Qi X. Deep Convolutional Neural Network-Aided Detection of Portal Hypertension in Patients With Cirrhosis.Clin Gastroenterol Hepatol. 2020;18:2998-3007.e5.
[RCA] [PubMed] [DOI] [Full Text][Cited by in Crossref: 41][Cited by in RCA: 40][Article Influence: 8.0][Reference Citation Analysis (0)]
Kuznetsova S, Grendarova P, Ploquin N, Thind K.
Multimodality Image Fusion of the Liver Using Structure-Guided Deformable Image Registration in Velocity AI---What Is the Preferred Approach? In: Lhotska L, Sukupova L, Lacković I, Ibbott G (eds). World Congress on Medical Physics and Biomedical Engineering 2018. IFMBE Proceedings, Singapore, 2019: 273-277.
[RCA] [PubMed] [DOI] [Full Text][Cited by in Crossref: 2][Cited by in RCA: 2][Article Influence: 0.3][Reference Citation Analysis (2)]
Fu Y, Lei Y, Wang T, Zhou J, Curran WJ, Patel P, Liu T, Yang X.
Deformable MRI-CT liver image registration using convolutional neural network with modality independent neighborhood descriptors. In: Mazurowski MA, Drukker K (eds). Medical Imaging 2021: Computer-Aided Diagnosis 2021; 11597: 102-107.
[PubMed] [DOI] [Full Text]
FDA.
Proposed Regulatory Framework for Modifications to Artificial Intelligence/Machine Learning (AI/ML)-Based Software as a Medical Device (SaMD)-Discussion Paper and Request for Feedback. 2019: 1-20.
[PubMed] [DOI]