Copyright
©The Author(s) 2019.
World J Gastroenterol. Feb 28, 2019; 25(8): 955-966
Published online Feb 28, 2019. doi: 10.3748/wjg.v25.i8.955
Published online Feb 28, 2019. doi: 10.3748/wjg.v25.i8.955
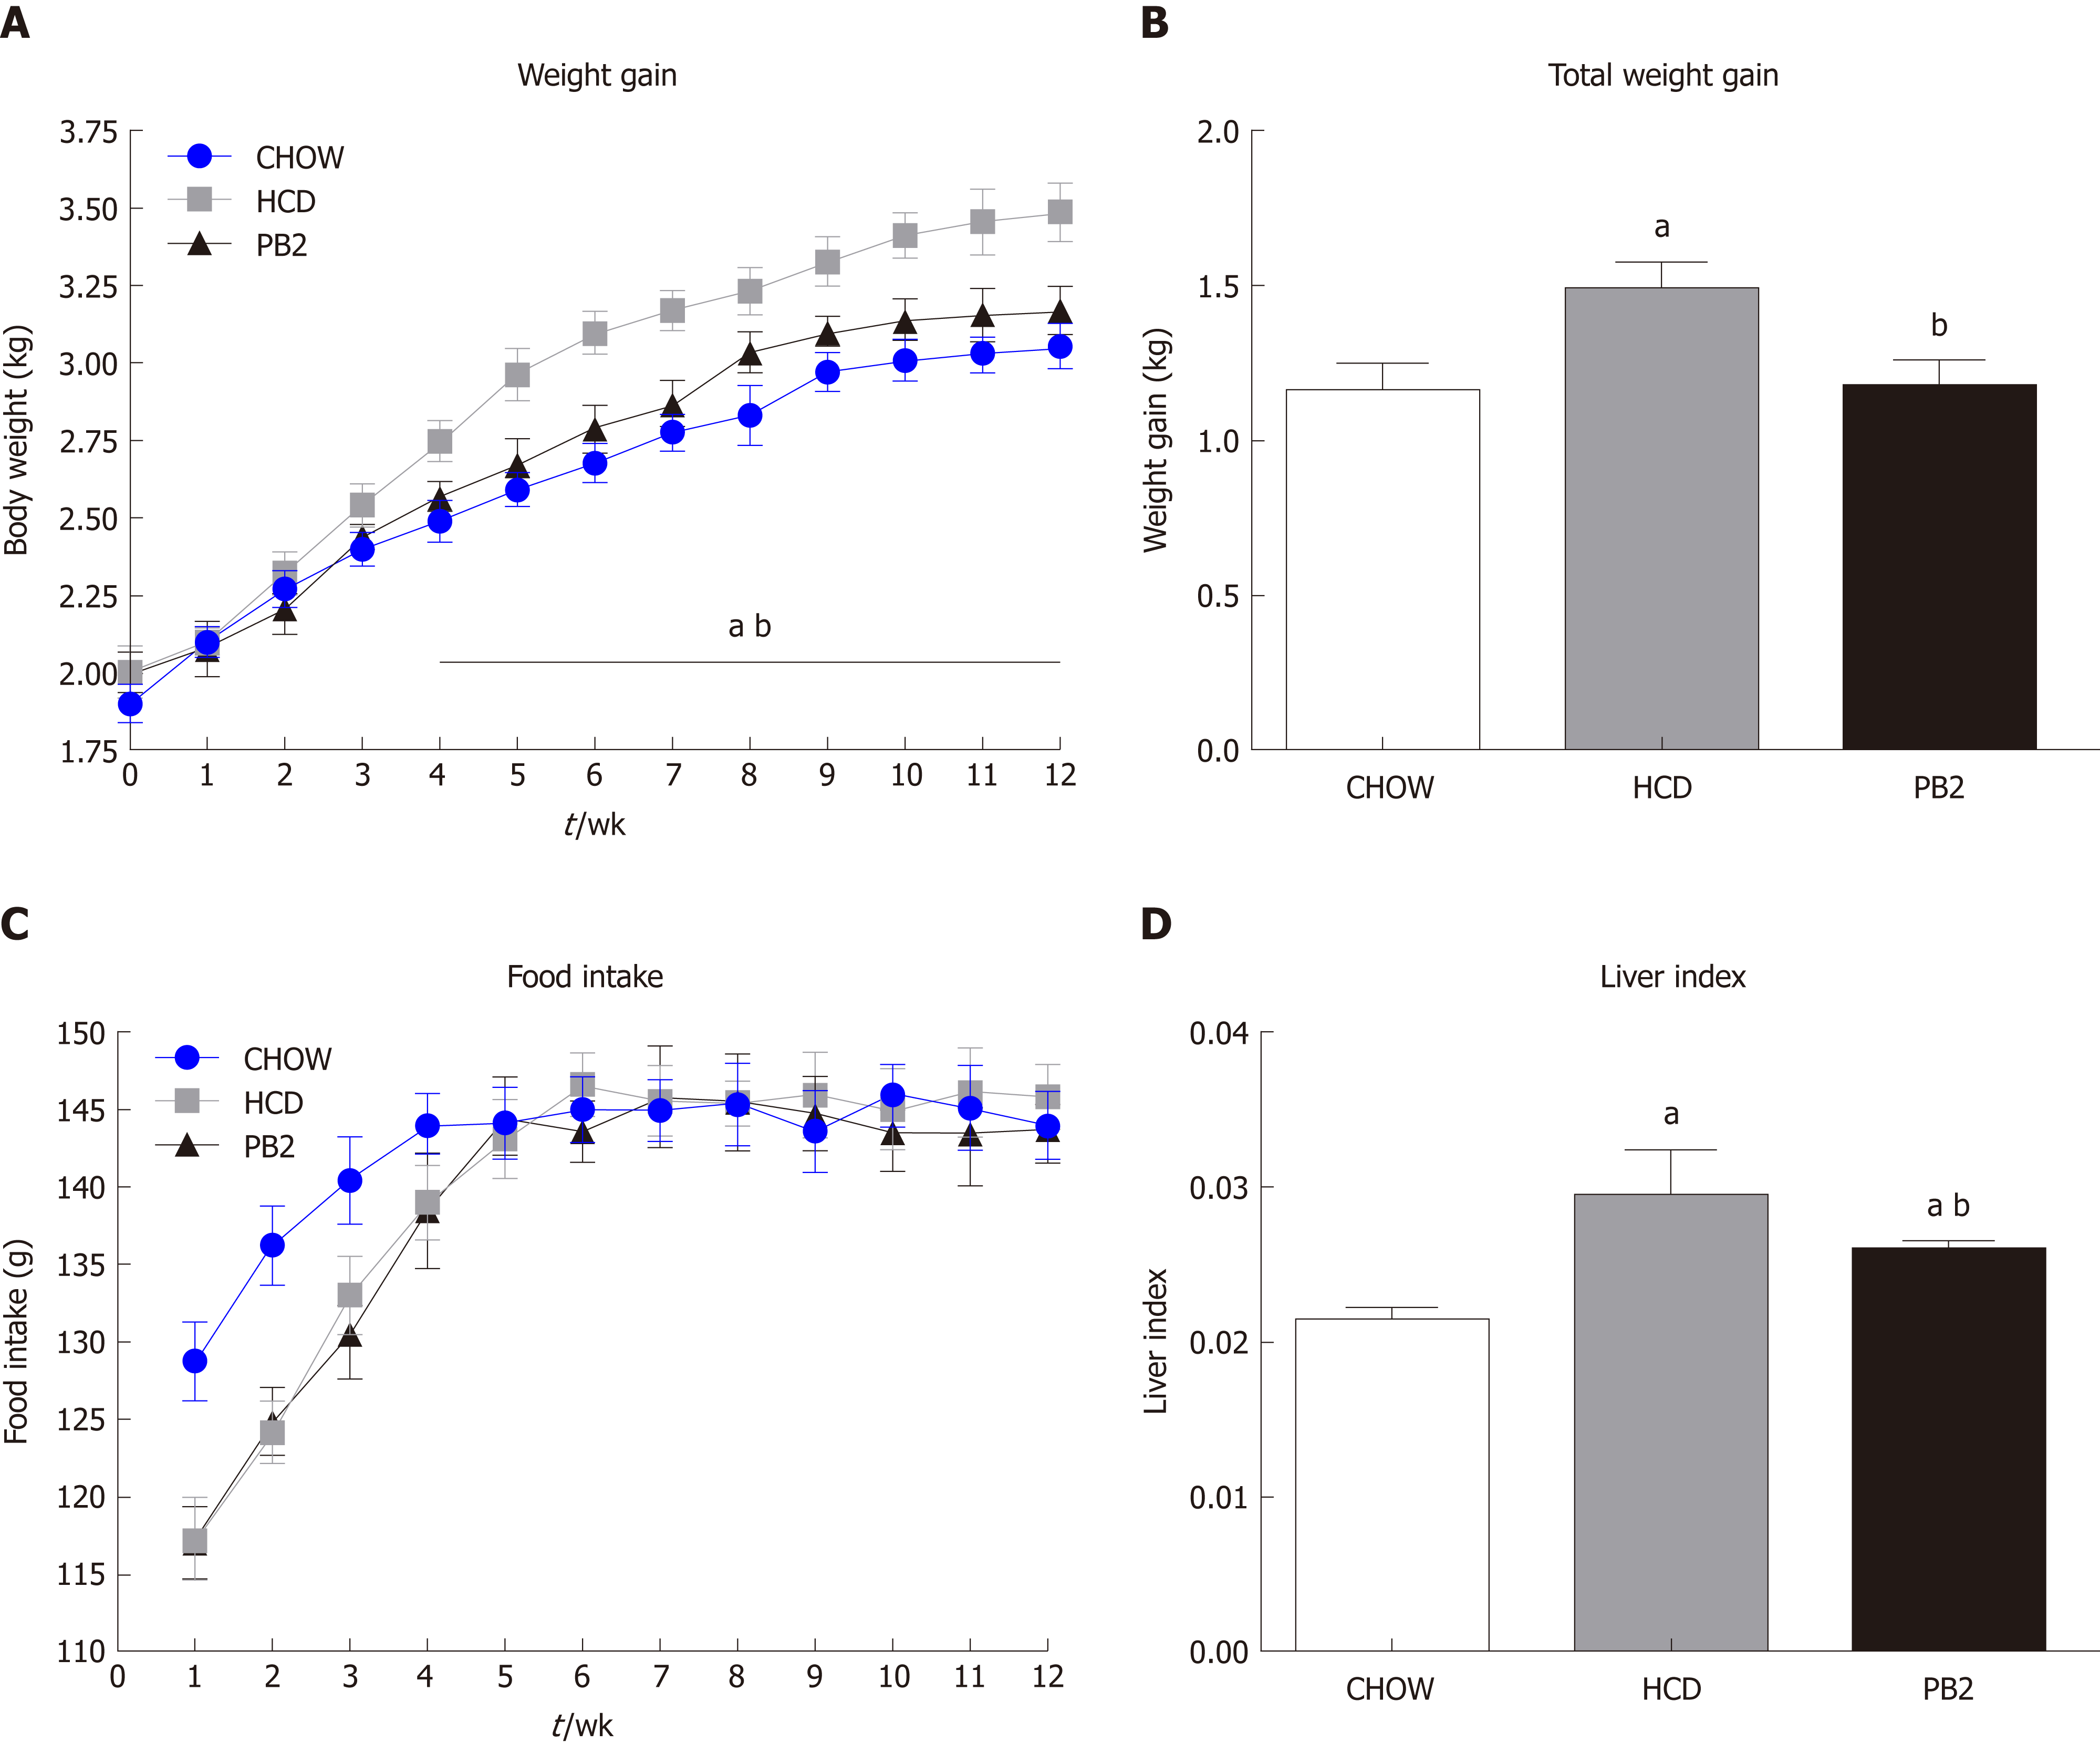
Figure 1 Effects of procyanidin B2 on body composition.
A: Weight gain curves; B: Total weight gain; C: Food intake curves; D: Liver index. The data are expressed as means ± SD. aP < 0.05 vs CHOW group; bP < 0.05 vs high-fat-cholesterol diet group. HCD: High-fat-cholesterol diet; PB2: Procyanidin B2; SD: Standard deviation.
- Citation: Xing YW, Lei GT, Wu QH, Jiang Y, Huang MX. Procyanidin B2 protects against diet-induced obesity and non-alcoholic fatty liver disease via the modulation of the gut microbiota in rabbits. World J Gastroenterol 2019; 25(8): 955-966
- URL: https://www.wjgnet.com/1007-9327/full/v25/i8/955.htm
- DOI: https://dx.doi.org/10.3748/wjg.v25.i8.955


