Published online Apr 28, 2018. doi: 10.3748/wjg.v24.i16.1748
Peer-review started: January 17, 2018
First decision: February 11, 2018
Revised: February 22, 2018
Accepted: February 26, 2018
Article in press: February 25, 2018
Published online: April 28, 2018
Processing time: 100 Days and 6 Hours
To comprehensively evaluate mitochondrial (dys) function in preclinical models of nonalcoholic steatohepatitis (NASH).
We utilized two readily available mouse models of nonalcoholic fatty liver disease (NAFLD) with or without progressive fibrosis: Lepob/Lepob (ob/ob) and FATZO mice on high trans-fat, high fructose and high cholesterol (AMLN) diet. Presence of NASH was assessed using immunohistochemical and pathological techniques, and gene expression profiling. Morphological features of mitochondria were assessed via transmission electron microscopy and immunofluorescence, and function was assessed by measuring oxidative capacity in primary hepatocytes, and respiratory control and proton leak in isolated mitochondria. Oxidative stress was measured by assessing activity and/or expression levels of Nrf1, Sod1, Sod2, catalase and 8-OHdG.
When challenged with AMLN diet for 12 wk, ob/ob and FATZO mice developed steatohepatitis in the presence of obesity and hyperinsulinemia. NASH development was associated with hepatic mitochondrial abnormalities, similar to those previously observed in humans, including mitochondrial accumulation and increased proton leak. AMLN diet also resulted in increased numbers of fragmented mitochondria in both strains of mice. Despite similar mitochondrial phenotypes, we found that ob/ob mice developed more advanced hepatic fibrosis. Activity of superoxide dismutase (SOD) was increased in ob/ob AMLN mice, whereas FATZO mice displayed increased catalase activity, irrespective of diet. Furthermore, 8-OHdG, a marker of oxidative DNA damage, was significantly increased in ob/ob AMLN mice compared to FATZO AMLN mice. Therefore, antioxidant capacity reflected as the ratio of catalase:SOD activity was similar between FATZO and C57BL6J control mice, but significantly perturbed in ob/ob mice.
Oxidative stress, and/or the capacity to compensate for increased oxidative stress, in the setting of mitochondrial dysfunction, is a key factor for development of hepatic injury and fibrosis in these mouse models.
Core tip:ob/ob and FATZO mice developed nonalcoholic fatty liver disease/nonalcoholic steatohepatitis (NASH) when fed a high trans-fat, high fructose and high cholesterol diet, in the context of obesity and insulin resistance, but showed differences in liver disease severity including collagen deposition and monocyte/macrophage infiltration. Mitochondrial dysfunction and increased numbers of mitochondria were observed in both models, similar to that reported in human NASH. Oxidative damage and antioxidant capacity were associated with disease severity. FATZO mice displayed increased catalase activity and reduced oxidative DNA damage compared to ob/ob mice, which may explain their lower disease burden.
- Citation: Boland ML, Oldham S, Boland BB, Will S, Lapointe JM, Guionaud S, Rhodes CJ, Trevaskis JL. Nonalcoholic steatohepatitis severity is defined by a failure in compensatory antioxidant capacity in the setting of mitochondrial dysfunction. World J Gastroenterol 2018; 24(16): 1748-1765
- URL: https://www.wjgnet.com/1007-9327/full/v24/i16/1748.htm
- DOI: https://dx.doi.org/10.3748/wjg.v24.i16.1748
Non-alcoholic fatty liver disease (NAFLD), now the most common liver disease, encompasses a spectrum of disorders from benign simple fatty liver to the more severe non-alcoholic steatohepatitis (NASH) that can progress to liver cirrhosis and hepatocellular carcinoma. Given the strong association of NAFLD with obesity, type II diabetes and other aspects of the metabolic syndrome, the current estimated NAFLD prevalence of 20%-40% worldwide is expected to increase[1-3]. While no FDA-approved pharmacotherapies for NAFLD/NASH currently exist, more than 100 clinical trials are now targeting this highly significant unmet medical need.
Insulin resistance is a major pathophysiological factor that underlies the strong association between obesity/type II diabetes and NAFLD. Increased circulating free fatty acids and de novo lipogenesis lead to excess lipid storage in the hepatocyte, and accumulation of intrahepatic lipid is linked to pathogenic insulin resistance and subsequent onset of type 2 diabetes. This lipid overload also places a unique burden on the mitochondria and promotes mitochondrial dysfunction in vitro and in animal models. Data from multiple studies suggest that while TCA cycle activity is increased in NAFLD, mitochondrial respiratory chain inefficiencies lead to increased generation of reactive oxygen species (ROS) and lipotoxic intermediates that further promote oxidative damage and inflammation[4-7]. Importantly, while increased hepatic mitochondrial respiration was observed in obese patients with and without fatty liver, this increase was lost in obese patients with NASH and was associated with increased mitochondrial content, proton leakage and oxidative stress[8].
While dysregulated mitochondrial metabolism has been implicated in NALFD pathogenesis and progression, the specific contribution to disease etiology remains an active area of investigation[9,10]. Multiple lines of evidence suggest that therapeutically targeting the mechanisms leading to mitochondrial dysfunction may improve liver disease[10,11]. The use of pre-clinical models that mimic human pathology in the context of known risk factors, including obesity and insulin resistance, are necessary to understand the clinical translatability of pharmacological interventions given the difficulty of studying humans with a slow progressing disease that cannot be confirmed non-invasively[12].
Hepatic mitochondrial function and oxidative stress in metabolically-relevant, pre-clinical models of simple fatty liver vs NASH have not been fully assessed. Here, two pre-clinical mouse models of simple steatosis and NASH were investigated: ob/ob mice on NASH-inducing AMLN diet[13], and the recently described polygenic FATZO mouse which develops high-fat diet-induced obesity and impaired glucose tolerance and which retains an intact leptin axis[14,15]. Importantly, these models are readily available and rapidly and consistently develop clinically relevant disease. We characterized the contribution of mitochondria and oxidative stress to disease phenotype and demonstrate that a reduced ability to combat oxidative stress in the setting of mitochondrial dysfunction is associated with the progression to NASH with advanced fibrosis. These data highlight the utility of these models to dissect the underlying pathobiology of NAFLD disease progression and to predict pharmacological efficacy.
Animal studies were conducted in accordance with protocols approved by the Institutional Animal Care and Use Committee (IACUC) at MedImmune and in compliance with the applicable national laws and regulations concerning use of laboratory animals and the AstraZeneca Animal Welfare and Bioethics policies. Eight-week old male C57BL6J or Lepob/Lepob (ob/ob) mice (Jackson labs, Bar Harbor, ME, United States) and 8-week-old male FATZO mice (Crown Bioscience, Indianapolis, IN, United States) were housed in standard caging at 22 °C in a 12-h light: 12-h dark cycle at standard temperature and humidity conditions with ad libitum access to water and food. Mice were maintained on test diets for 12 wk. The following test diets were used: 2018 Tekland rodent diet (Envigo, United States), low-fat diet (LFD; 10% kcal/fat; D09100304, Research Diets, New Brunswick, NJ, United States) and the Amylin Liver NASH (AMLN) diet high in fat (40% kcal), fructose (22% by weight), and cholesterol (2% by weight) (D09100301 Research Diets). Study groups comprised C57BL6J chow fed (lean) mice (n = 6), ob/ob mice on LFD (n = 8) and ob/ob mice on AMLN diet (n = 10), or C57BL6J lean mice, FATZO mice on LFD, or FATZO mice on AMLN diet (all n = 5 per group).
Terminal blood was collected in EDTA-coated tubes and centrifuged at 10000 × g for 10 min. The plasma was collected and analyzed for ALT levels using a biochemistry analyzer (Cobas c-111, Roche Diagnostics, Indianapolis, IN, United States).
Total lipids were measured in liver samples using a Bruker LF-90 minispec system (Bruker Biospin Corporation, Billerica, MA, United States). The data are expressed as the percent lipid relative to the total tissue mass.
To isolate pancreatic insulin, the tissue was incubated in a 1.5% HCl/70% EtOH solution overnight at -20 °C. The tissue was homogenized and frozen again overnight at -20 °C. Following centrifugation at 2000 rpm for 15 min, the aqueous layer was transferred to a new tube and neutralized upon the addition of 1 mol/L Tris, pH 7.5 at a 1:1 ratio. Plasma and pancreatic insulin levels were measured via immunoassay (K152BZC, MesoScale Diagnostics, Rockville, MD, United States).
Livers were fixed in 10% neutral buffered formalin for 24 h. Paraffin-embedded tissue sections were stained with hematoxylin and eosin using standard procedures. Histological assessments were conducted by a pathologist under blinded conditions. A modified scoring system, based on the Brunt and Kleiner NAFLD activity score, previously developed and validated to enable a more reproducible and semi-quantitative assessment of murine liver was used to quantify various parameters of liver phenotype[16]. The following parameters were graded to generate the overall NASH score: macrovesicular steatosis (0: < 5%, 1: 5%-33%, 2: 34%-66%, 3: > 66%); ballooning degeneration (0 = absent, 1 = present); lobular inflammation (0 = no foci, 1 = rare foci, 2 = occasional foci, 3 = frequent foci); biliary hyperplasia (0 = none, 1 = mild, 2 = prominent); CD68 immunoreactivity (0 = normal, 1 = minimal increased, 2 = more than minimal increase).
Customized algorithms (Definiens, Munich, Germany) were applied to the liver sections to quantify macrosteatosis per liver area, total collagen area and number of CD68-positive cells. White spaces, non-native liver tissues, large blood vessels and bile ducts were excluded from the analyses.
Immunohistochemistry was performed using a Ventana Discovery ULTRA Staining Module (Ventana Medical Systems, Tucson, AZ, United States). Formalin-fixed, paraffin embedded liver sections were stained with anti-CD68 (ab125212 Abcam, Cambridge, MA, United States), anti-collagen type 1 A1 (1310-01 Southern Biotech, Birmingham, AL, United States), or anti-catalase (PA5-29183, ThermoFisher).
Freshly isolated liver was chemically fixed in 0.1 mol/L cacodylate buffer containing 4% paraformaldehyde and 2% glutaraldehyde. Samples were resin-embedded, sectioned, and stained as previously described[17]. Samples were imaged using the FEI Tecnai G2 SPIRIT electron microscope equipped with a CCD camera (Pleasanton, CA, United States) at 120000 V. Images were acquired using GATAN digital micrograph software (Warrendale, PA, United States). Electron micrographs were viewed in a blinded fashion using 3Dmod software[18] on a Wacom Cintiq 22HD art tablet (Vancouver, WA, United States). Mitochondrial area and number were quantified per total cytoplasmic area from ≥ 10 electron micrographs per group via manual tracing using the art tablet as previously described (N ≥ 3 biological replicates, ≥ 1.5 mm2 total cytoplasmic area)[19].
FFPE liver sections were deparaffinized followed by blocking of endogenous peroxidases. Antigen retrieval was carried out by heating samples at 119 C for 6.5 min in citrate buffer solution (Dako Target Retrieval Solution, Agilent Technologies, Santa Clara, CA, United States). After blocking with 1.5% horse serum, slides were incubated overnight in anti-HSP60 (D6F1, Cell Signaling Technology, Danvers, MA, United States) in Dako antibody diluent (S3022, Agilent Technologies). Secondary antibody incubation with goat anti-rabbit Alexa 488 (ThermoFisher) was carried out at room temperature for 1 h. Slides were mounted using Prolong Gold plus DAPI (ThermoFisher). Slides were imaged using a Leica TCS SP5 X confocal microscope. Confocal images were viewed in a blinded fashion using 3Dmod software on a Wacom Cintiq 22HD art tablet (Vancouver, WA, United States). Mitochondrial length and number per total cytoplasmic area were quantified from ≥ 15 images per group (n ≥ 3 biological replicates) via manual tracing of cell boundaries, nuclei, lipid droplets and mitochondria. Total cytoplasmic area was calculated as area within the cell boundary minus the nuclei and lipid droplet areas.
Murine primary hepatocytes were isolated using a modified two-step non-recirculating perfusion method as previously described[20]. All assays were carried out within 18-24 h post-plating.
Mitochondrial oxygen consumption was measured using the Seahorse Xfe96 analyzer (Agilent Technologies). Primary hepatocytes were plated at a density of 7500 cells per well and allowed to recover overnight. The medium was exchanged (DMEM containing 5 mmol/L glucose, 4 mmol/L L-glutamine, 2 mmol/L sodium pyruvate, pH 7.4) and the plate was placed in a CO2-free incubator for 30 min prior to being placed in the analyzer. The following compounds were used in the mitochondrial stress test: 1 μmol/L oligomycin (Sigma, St Louis, MO, United States), 0.5 μmol/L FCCP (Sigma), and 5 μmol/L antimycin A (Sigma). The data represent the average of three independent experiments each with a minimum of 8 replicates per group.
The respiratory control ratio (RCR) and leak control ratio (LCR) were quantified using freshly isolated hepatic mitochondria as an index of mitochondrial coupling and proton leak, respectively[8]. Briefly, 5 μg of mitochondria were loaded per well of the seahorse plate in assay medium (70 mmol/L sucrose, 220 mmol/L mannitol, 10 mmol/L KH2PO4, 5 mmol/L MgCl2, 2 mmol/L HEPES, 1 mmol/L EGTA, 0.2% (w/v) fatty acid-free BSA, pH 7.2 supplemented with complex II substrate succinate at 10 mmol/L). The following injections were performed: 4 mmol/L ADP (state 3), 1 μmol/L oligomycin (state 3o), 1 μmol/L FCCP (state 3U) and 4 μmol/L antimycin A/ 2 μmol/L rotenone. RCR is represented by the ratio of ADP-stimulated respiration (state 3) to respiration in the presence of oligomycin (state 3o), and LCR is represented by the ratio of respiration in the presence of oligomycin (State 3o) to FCCP-stimulated respiration (state 3U).
Mitochondrial content was quantified by citrate synthase activity (CSA) of freshly isolated primary hepatocytes or liver mitochondria using the Citrate Synthase Activity Colorimetric Assay Kit (BioVision, Milpitas, CA, United States) according to the manufacturer’s instructions and normalized to total protein assessed by the Pierce BCA protein assay kit (ThermoFisher).
Excised liver was rinsed in several changes of PBS and homogenized in ice cold isolation buffer (70 mmol/L sucrose, 210 mmol/L mannitol, 5 mmol/L HEPES, 1 mmol/L EGTA, 0.5% w/v fatty acid-free BSA, pH 7.2) using a Wheaton™ Dounce Tissue Grinder (Fisher Scientific). After centrifugation at 800 x g for 10 min at 4 °C, the supernatants were collected and centrifuged at 8000 × g for 10 min at 4 °C. The resulting mitochondrial pellet was washed two times and resuspended in a minimal volume of isolation buffer. The isolated mitochondria were kept on ice until use. Protein concentration was determined using the Pierce BCA Protein Assay Kit (ThermoFisher).
Total liver RNA and genomic DNA were isolated using standard procedures. Qiagen RNeasy® columns (Qiagen, United States) were used for RNA purification according to the manufacturer’s protocol, including an on-column DNA digestion using DNaseI. Equal amounts of RNA were reverse transcribed to cDNA using SuperScript III First Strand cDNA synthesis kit (Invitrogen, Carlsbad, CA, United States) according to the manufacturer’s instructions. Real-Time PCR was performed on a QuantStudio-7 Flex System (Applied Biosystems, Foster City, CA, United States) using Applied Biosystems TaqMan Fast Universal PCR Master Mix and TaqMan probes. Each sample was assayed in triplicate and quantified using the ΔΔCT method normalized to endogenous control Ppia (mRNA) or nuclear encoded gene β-globin (gDNA). The following Taqman probes were used in qPCR assays: collagen type 1 alpha 1 (Col1a1, Mm00801666_g1), collagen type 1 alpha 2 (Col1a2, Mm00483888_m1), TIMP metallopeptidase inhibitor 1 (Timp1, Mm01341361_m1), interleukin 1 beta (Il1b, Mm00434228_m1), cluster of differentiation 68 (Cd68, Mm03047343_m1), tumor necrosis factor alpha (Tnf, Mm00443258_m1), PPARG coactivator 1 alpha (Ppargc1a, Mm01208835_m1), nuclear respiratory factor 1 (Nrf1, Mm01135606_m1), transcription factor A, mitochondrial (Tfam, Mm00447485_m1), superoxide dismutase 1, soluble (Sod1, Mm1344233_g1), superoxide dismutase 2, mitochondrial (Sod2, Mm01313000_m1), catalase (Cat, Mm00437992_m1), glutathione peroxidase (Gpx1, Mm00656767_g1), and peptidylprolyl isomerase A (Ppia, Mm02342430_g1).
Superoxide dismutase activity (7501-500-K, Trevigen, Gaithersburg, MD, United States) and catalase activity (707002, Cayman Chemical, Ann Arbor, MI, United States) were measured in freshly prepared liver homogenates according to the manufacturer’s protocols. The levels of 8-hydroxydeoxyguanosine (8-OHdG) were measured via ELISA using approximately 20 μg of total hepatic genomic DNA (4380-096-K, Trevigen).
All statistical analyses were carried out using GraphPad Prism 7 (GraphPad Software, San Diego, CA, United States). The data were analyzed via one-way or two-way ANOVA and Tukey’s post-test. Data are shown as the mean ± SE. Values of P ≤ 0.05 were considered significant.
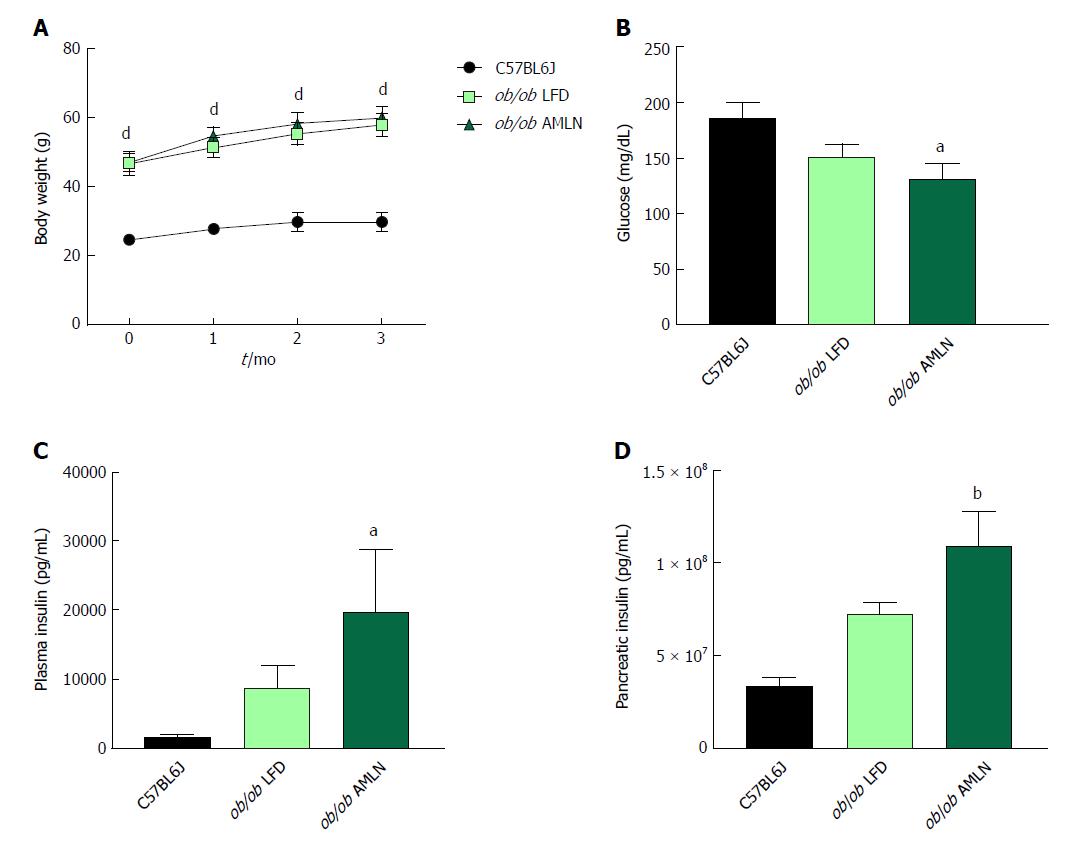
NASH induction was assessed in ob/ob mice, a proposed NASH model when challenged with AMLN diet. C57BL6J mice served as healthy age-matched controls (lean) and were compared to ob/ob mice maintained on LFD (ob/ob LFD) or AMLN diet (ob/ob AMLN) for 12 wk. After the 12-wk disease induction period, ob/ob LFD and ob/ob AMLN mice weighed significantly more than lean controls (P < 0.0001), but did not significantly differ from one another (Figure 1A). While non-fasting blood glucose was slightly reduced in ob/ob AMLN animals compared to lean controls (132 mg/dL vs 186 mg/dL, P < 0.05; Figure 1B), plasma insulin levels (P < 0.05; Figure 1C) and pancreatic insulin content (P < 0.01; Figure 1D) were concomitantly increased.
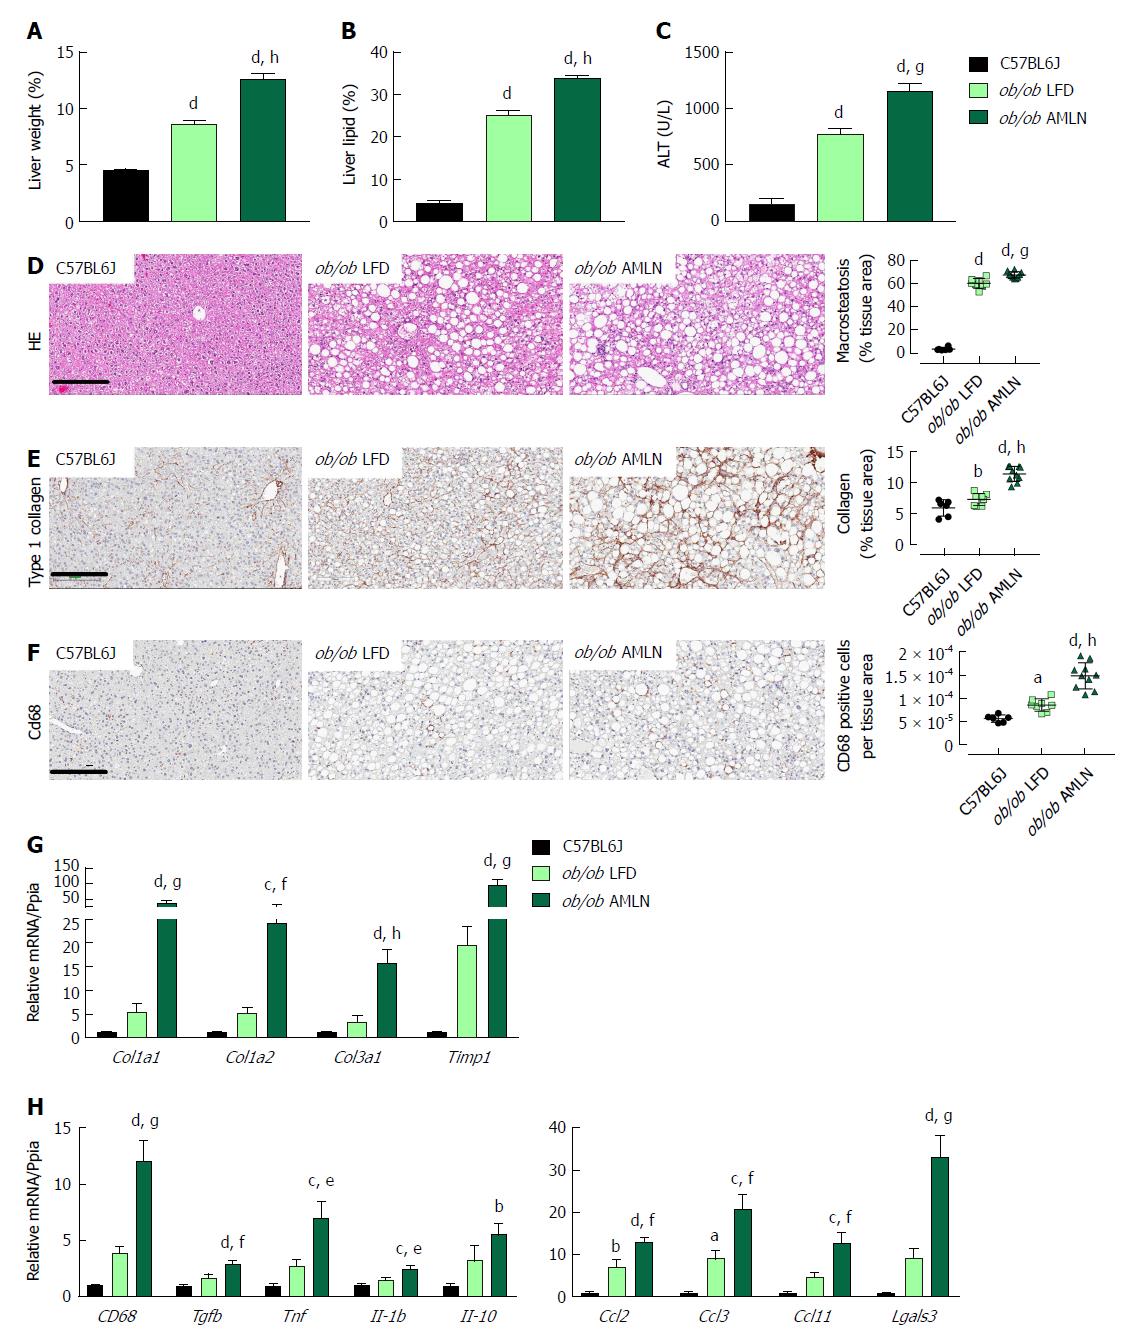
We measured markers associated with NAFLD including liver weight, liver lipid, and plasma alanine aminotransferase (ALT). Liver weight was significantly greater in ob/ob LFD vs lean animals (8.6% vs 4.5%, P < 0.0001), and was further increased in ob/ob AMLN animals (12.7%, P < 0.0001; Figure 2A). Similarly, ob/ob AMLN livers contained approxiately 34% intrahepatic lipid, which was significantly greater than livers from ob/ob LFD (25% lipid, P < 0.0001) and lean animals (5% lipid, P < 0.0001; Figure 2B). Plasma ALT was also significantly increased in ob/ob LFD vs lean animals (771 U/L vs 160 U/L, P < 0.0001) and was further elevated in ob/ob AMLN animals (1160 U/L, P < 0.001 vs ob/ob LFD; Figure 2C).
Macrovesicular steatosis was prominent in both ob/ob LFD (60%) and ob/ob AMLN animals (67%, P < 0.001 vs ob/ob LFD; Figure 2D). Hepatic fibrosis assessed by quantification of type 1 collagen stained area was significantly greater in ob/ob LFD vs lean livers (P < 0.01) and even greater in ob/ob AMLN liver (P < 0.0001 vs ob/ob LFD) (Figure 2E). Immunolabeling with the monocyte/macrophage marker CD68 was also markedly elevated in ob/ob AMLN livers compared to ob/ob LFD and lean controls (P < 0.0001 vs ob/ob LFD; Figure 2F).
We analyzed hepatic transcript levels of genes involved in fibrosis and inflammation that differentiate the more benign disease observed in ob/ob LFD liver histopathology from the steatohepatitis observed in ob/ob AMLN livers. Transcripts encoding the most abundant form of liver collagen, type 1 (Col1a1 and Col1a2), in addition to type 3 collagen (Col3a1) were significantly elevated in ob/ob AMLN livers vs lean and ob/ob LFD livers (P < 0.001, P < 0.01, P < 0.0001, respectively, vs ob/ob LFD; Figure 2G). Timp1, another gene associated with increased extracellular matrix turnover, was significantly elevated in ob/ob AMLN compared to ob/ob LFD and lean livers (P < 0.001 vs ob/ob LFD; Figure 2G). The expression of cytokines including Tgfb, Tnf, Il1b, and Il10, and chemokines including Ccl2, Ccl3, and Ccl11 were similarly upregulated in ob/ob AMLN livers compared to ob/ob LFD and lean controls (P < 0.01, P < 0.05, P < 0.05, P = 0.2; P < 0.01, P < 0.001, P < 0.01, respectively, vs ob/ob LFD; Figure 2H). Additionally, Lgals3, a marker associated with multiple inflammatory cell types and thought to contribute to fibrogenesis, was highly expressed in the livers of ob/ob AMLN but not lean or ob/ob LFD mice (30-fold induction vs lean controls, P < 0.001 vs ob/ob LFD; Figure 2H).
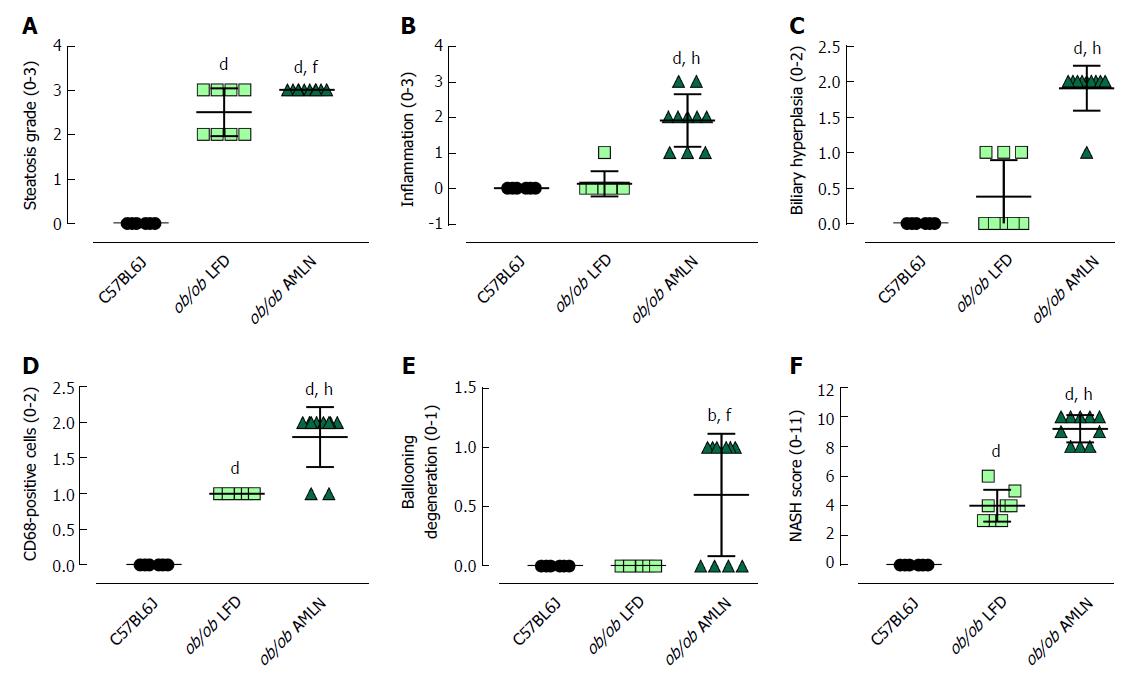
The steatosis grade was significantly higher in ob/ob LFD (grade 2.5, P < 0.0001) and ob/ob AMLN (grade 3, P < 0.0001) compared to lean livers (grade 0; Figure 3A). A significant increase in the number of inflammatory foci (Figure 3B), biliary hyperplasia (Figure 3C) and CD68-positive cells (Figure 3D) was observed in ob/ob AMLN vs lean (P < 0.0001) and ob/ob LFD livers (P < 0.0001). Ballooned hepatocytes were only observed in ob/ob AMLN livers (Figure 3E). An integrated NASH score was generated by combining the grades of steatosis, inflammation, biliary hyperplasia, CD68 positive cells, and ballooning degeneration (Figure 3F), which reflected the clear distinction between ob/ob LFD and ob/ob AMLN liver histopathology.
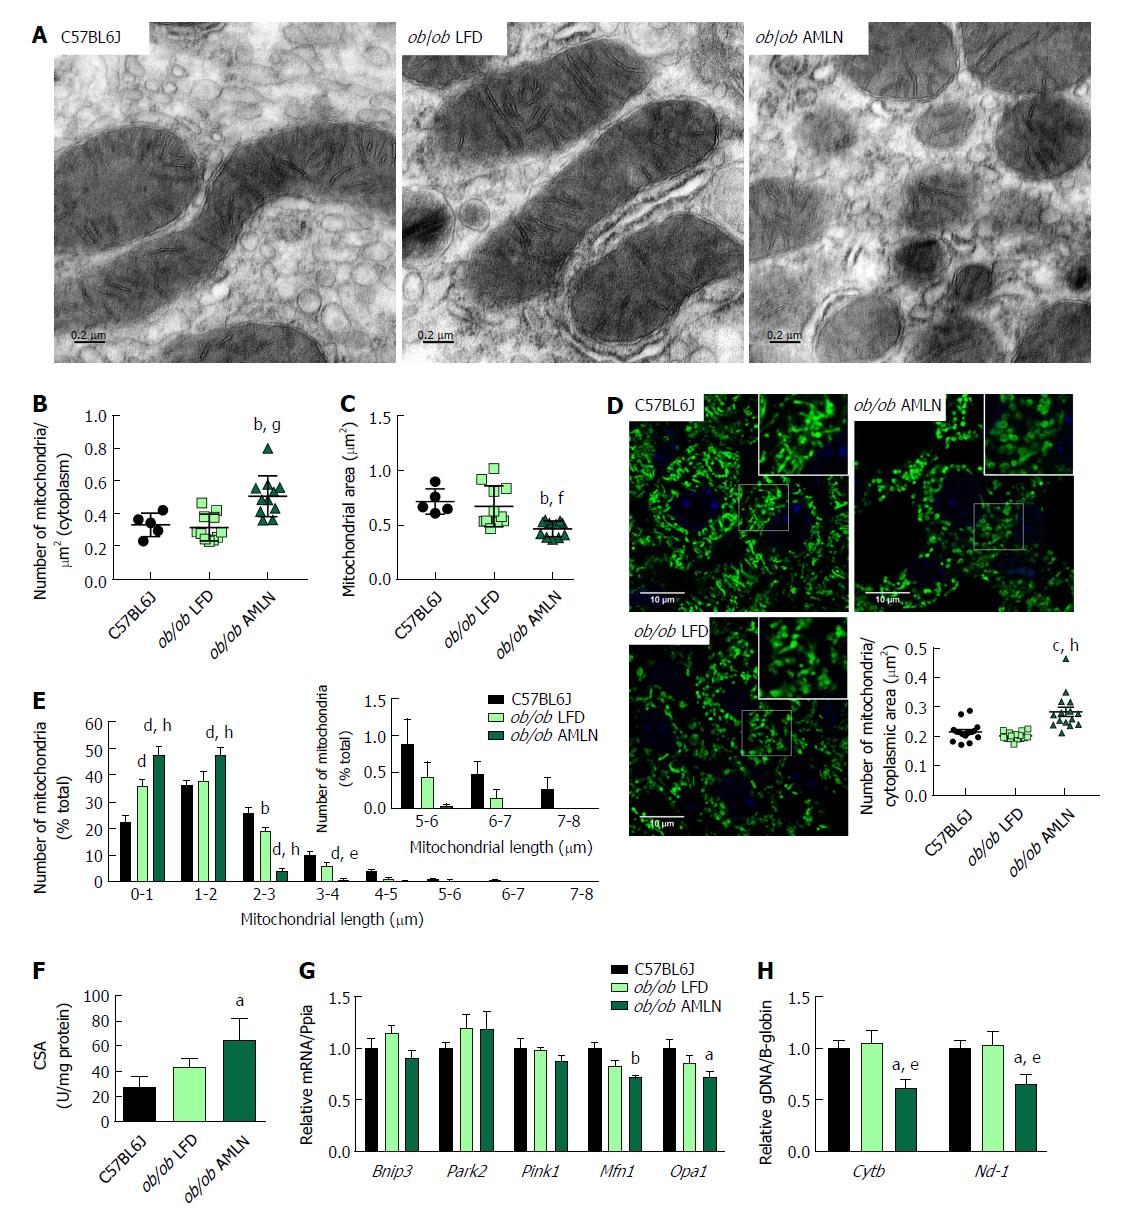
We examined mitochondrial ultrastructure in livers from lean, ob/ob LFD and ob/ob AMLN mice by transmission electron micrography (TEM; Figure 4A). Quantitative assessment of TEM images showed ob/ob AMLN hepatocytes had increased numbers of mitochondria (approximately 1.5-fold, P < 0.001 vs ob/ob LFD; Figure 4B). While lean and ob/ob LFD hepatocytes contained a mixture of elongated and fragmented mitochondria, ob/ob AMLN hepatocytes contained smaller, more fragmented mitochondria (average area = 70 μm2 for lean controls vs 45 μm2 for ob/ob AMLN, P < 0.01; Figure 4C); however, no overt defects in outer membrane integrity or cristae formation were observed. Similarly, quantification of mitochondrial length and number from HSP60 immunostained liver sections revealed increased numbers of mitochondria overall in ob/ob AMLN livers (P < 0.005 vs lean controls; Figure 4D) and a significant increase in shorter, more fragmented mitochondria (Figure 4E). Citrate synthase activity (CSA), another measure of mitochondrial content, was increased over 2-fold in primary hepatocytes isolated from ob/ob AMLN mice vs lean controls (P < 0.05; Figure 4F). In line with smaller mitochondria in ob/ob AMLN hepatocytes, the expression of proteins required for mitochondrial fusion, mitofusin 1 (Mfn1) and dynamin-like 120 kDa protein, mitochondrial (Opa1), was significantly decreased in ob/ob AMLN livers compared to lean controls (P < 0.01 and P < 0.05, respectively; Supplementary Figure 4G).
To assess whether this increase in mitochondrial number was due to increased biogenesis, we quantified the expression of transcription factors required for mitochondrial biogenesis and components of the electron transport chain (ETC). While the expression of PPARγ-coactivator 1a (Ppargc1a) was slightly increased in ob/ob LFD livers (1.4-fold, P = 0.06 vs lean controls), it was unchanged in ob/ob AMLN vs lean livers (data not shown). Similarly, nuclear respiratory factor 1 (Nrf1) and mitochondrial transcription factor A (Tfam) mRNA levels were unchanged in ob/ob AMLN vs lean and ob/ob LFD livers (data not shown). Additionally, expression of mitochondrial autophagy genes Bnip3, Park2 and Pink1 was not different between groups (Figure 4G). Although ob/ob AMLN hepatocytes displayed increased mitochondrial number, they contained significantly less mitochondrial DNA (mtDNA) as assessed by the expression of mitochondrially-encoded genes Cytb and Nd-1 relative to the expression of nuclear encoded β-globin (approximately 30% reduction, P < 0.05 vs lean controls; Supplementary Figure 4H).
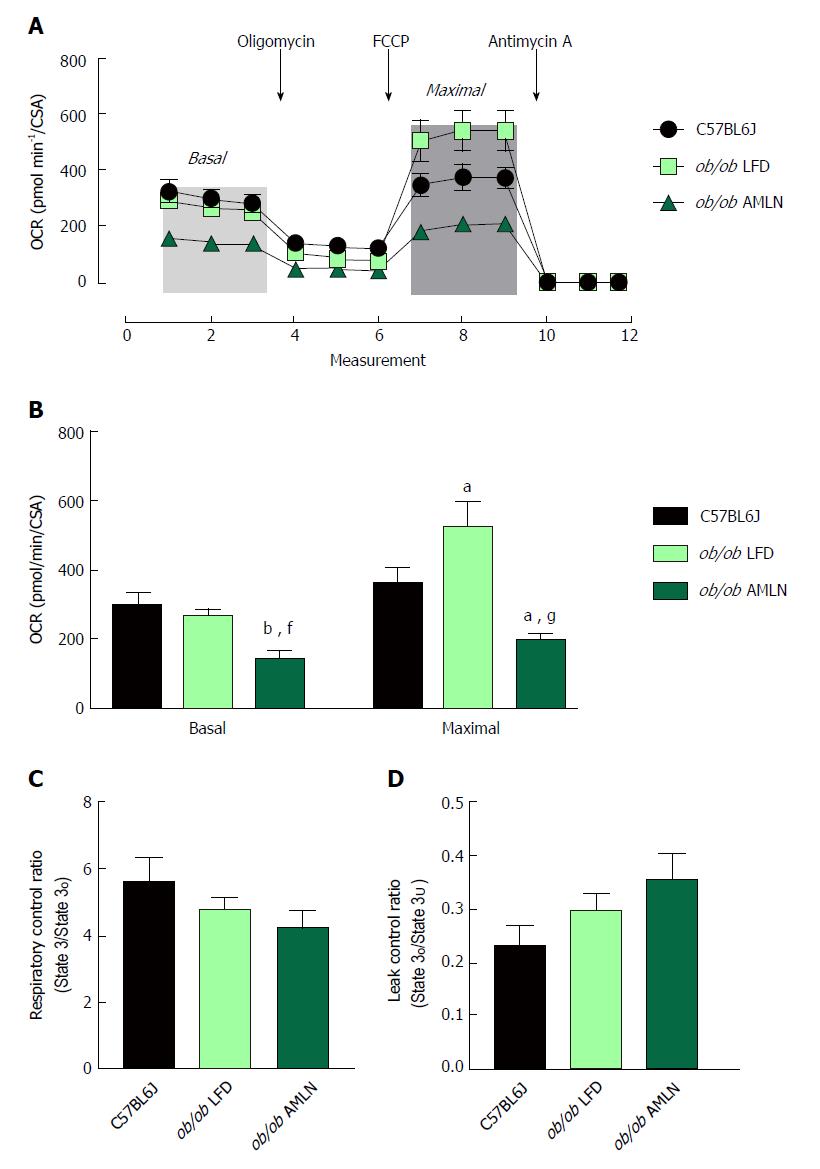
To assess mitochondrial function, oxygen consumption of intact primary hepatocytes from lean, ob/ob LFD and ob/ob AMLN animals was measured (Figure 5A). ob/ob AMLN hepatocytes displayed significantly reduced basal respiration that was approximately 50% lower compared to lean (P < 0.01) and ob/ob LFD hepatocytes (P < 0.05) (Figure 5B). Maximal mitochondrial respiratory capacity was significantly increased in ob/ob LFD compared to lean hepatocytes (+45%, P < 0.05; Figure 5B). In contrast, ob/ob AMLN hepatocytes displayed significantly reduced maximal respiration compared to lean (-45%, P < 0.05) and ob/ob LFD hepatocytes (-60%, P < 0.001; Figure 5B).
We also assessed mitochondrial coupling and proton leak. The mitochondrial respiratory control ratio (RCR) and leak control ratio (LCR) were quantified using isolated mitochondria from lean, ob/ob LFD and ob/ob AMLN livers. Mitochondria from ob/ob mouse liver displayed slightly increased proton leak without a significant decrease in respiratory control[21], and AMLN diet further increased proton leak and reduced RCR. Mitochondrial coupling was decreased in ob/ob AMLN mice compared to mitochondria from lean mice (4.2 vs 5.6; Figure 5C), although this difference did not reach statistical significance. ob/ob AMLN mitochondria also displayed a higher LCR compared to lean controls (0.35 vs 0.23, P = 0.06; Figure 5D), indicating increased proton leak.
While the ob/ob mouse exhibits key aspects of human metabolic disease and, importantly, develops diet-induced NASH with consistent grade 2-3 fibrosis, most humans with NAFLD/NASH are likely hyperleptinemic as opposed to leptin-deficient. We therefore investigated the FATZO mouse, an inbred polygenic cross of AKR/J and C57BL6J strains with a predisposition to obesity and insulin resistance, but intact leptin axis[14,15].
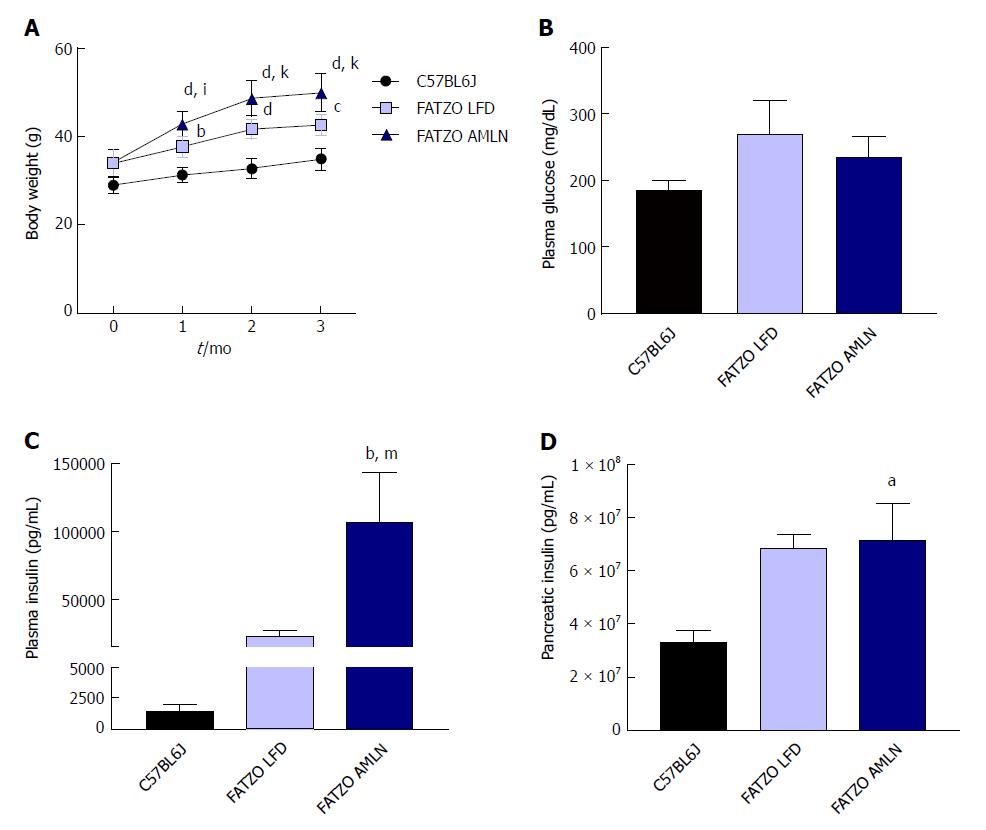
After 12 wk on diet, FATZO mice fed LFD (FATZO LFD) weighed significantly more than lean (C57BL6J) controls (43 g vs 35 g, P < 0.0001), while FATZO mice fed AMLN diet (FATZO AMLN) weighed significantly more than both FATZO LFD and lean controls (50 g, P < 0.001 vs FATZO LFD; Figure 6A). Plasma glucose was slightly elevated in FATZO LFD (271 mg/dL) and FATZO AMLN mice (236 mg/dL) compared to lean controls (186 mg/dL; Figure 6B). FATZO AMLN mice displayed severe hyperinsulinemia with average plasma insulin levels that were significantly greater compared to FATZO LFD and lean controls (P < 0.01 for ob/ob AMLN vs lean controls; Figure 6C). Both FATZO LFD and FATZO AMLN mice had increased pancreatic insulin content, which was significantly greater in FATZO AMLN mice compared to lean controls (+50%, P < 0.05; Figure 6D).
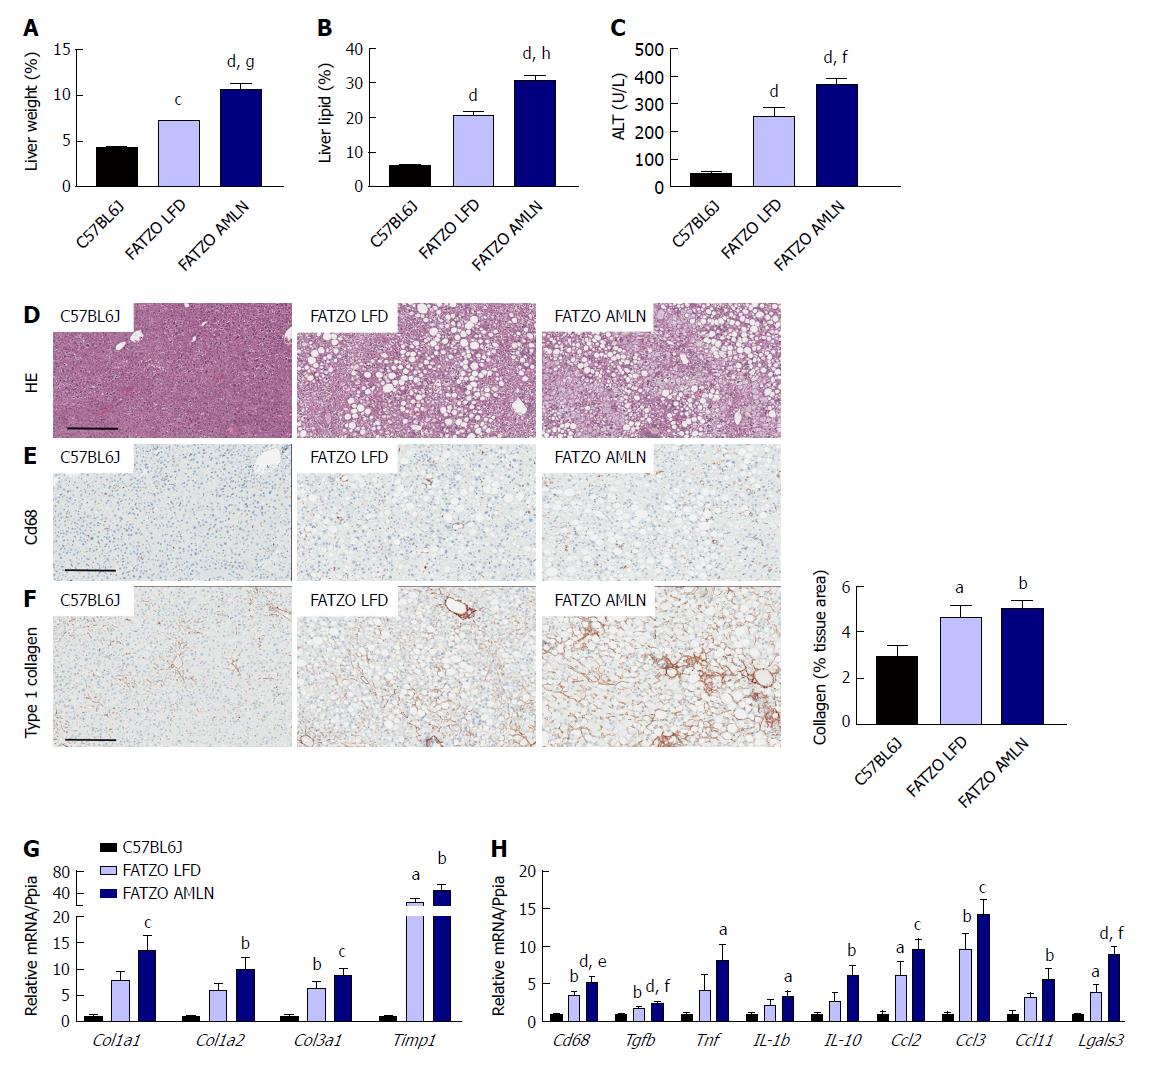
Markers of liver disease including hepatomegaly, hepatic steatosis and elevated plasma ALT levels were present in both FATZO LFD and FATZO AMLN mice. Relative liver weight was significantly increased in FATZO LFD vs lean animals (7.3% vs 4.4%, P < 0.0001), and was further increased in FATZO AMLN animals (10.6%, P < 0.001 vs FATZO LFD) (Figure 7A). Similarly, hepatic lipid content was significantly greater in FATZO LFD compared to lean controls (20% vs 6%) and was greatest in FATZO AMLN mice (30%, P < 0.0001 vs FATZO LFD; Figure 7B). Plasma ALT was also significantly increased in FATZO LFD vs lean animals (260 U/L vs 50 U/L, P < 0.0001) and was further elevated in FATZO AMLN animals (370 U/L, P < 0.01 vs FATZO LFD; Figure 7C), but was nonetheless still much lower than levels observed in ob/ob AMLN mice (> 1100 U/L, Figure 1C).
Assessment of HE-stained liver samples revealed the presence of prominent steatosis, both micro- and macrovesicular, in both FATZO LFD and FATZO AMLN animals (Figure 7D). Increased macrophage/monocyte infiltration was also observed in FATZO LFD and FATZO AMLN mice (Figure 7E), paralleled by increased expression of hepatic Cd68 (3.5-fold in FATZO LFD and 5.2-fold in FATZO AMLN; P < 0.05 FATZO LFD vs FATZO AMLN; Figure 7H). Mild collagen deposition was also apparent in FATZO animals but did not worsen upon AMLN diet feeding (Figure 7F).
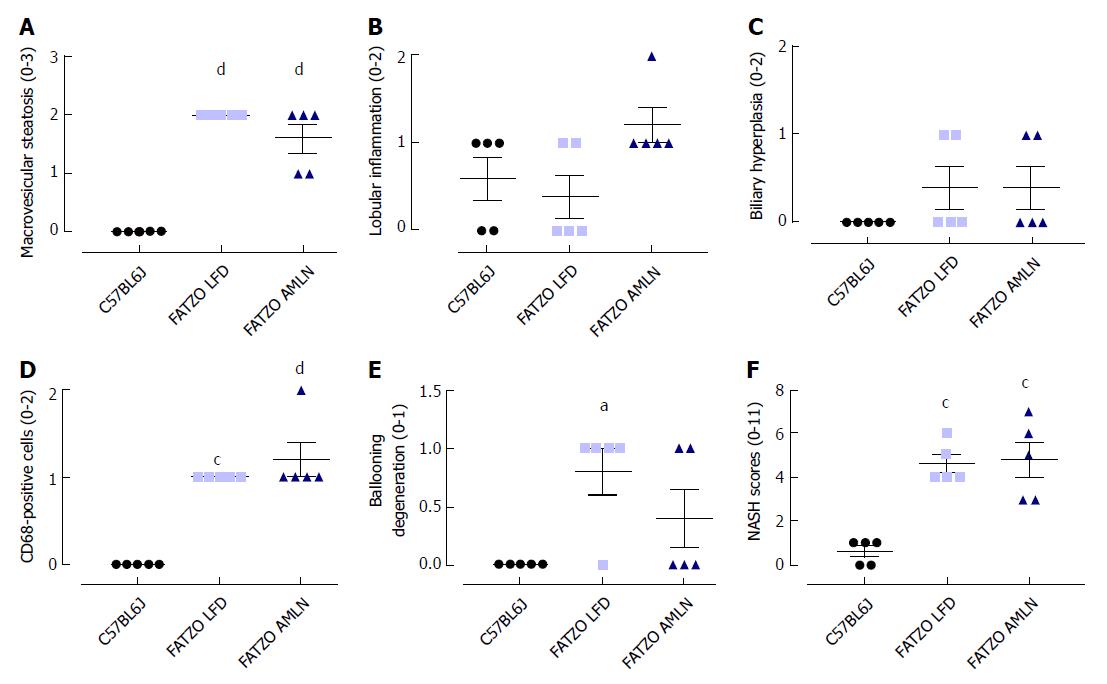
Transcriptional profiling of genes involved in hepatic fibrosis and inflammation revealed additional evidence of active liver disease in FATZO mice. Collagens including Col1a1, Col1a2 and Col3a1 were increased in FATZO LFD livers compared to lean controls (approximately 6-8-fold for each), and were further induced in FATZO AMLN livers (Figure 7G). All cytokines assayed including Tgfb, Tnf, Il1b, and Il10, and chemokines including Ccl2, Ccl3, and Ccl11 were similarly upregulated in FATZO LFD livers compared to lean controls and even further induced in FATZO AMLN livers (Figure 7H). Additional fibrosis related genes Timp1 and Lgals3 were significantly elevated in FATZO LFD livers compared to lean controls, with even further induction observed in FATZO AMLN livers (Figure 7G, H). Integrated NASH scores generated from combining grades of steatosis (Figure 8A), inflammation (Figure 8B), biliary hyperplasia (Figure 8C), CD68-positive cells (Figure 8D) and hepatocyte ballooning (Figure 8E) were significantly greater for FATZO LFD and FATZO AMLN mice compared to lean controls, but did not significantly differ from one another (Figure 8F).
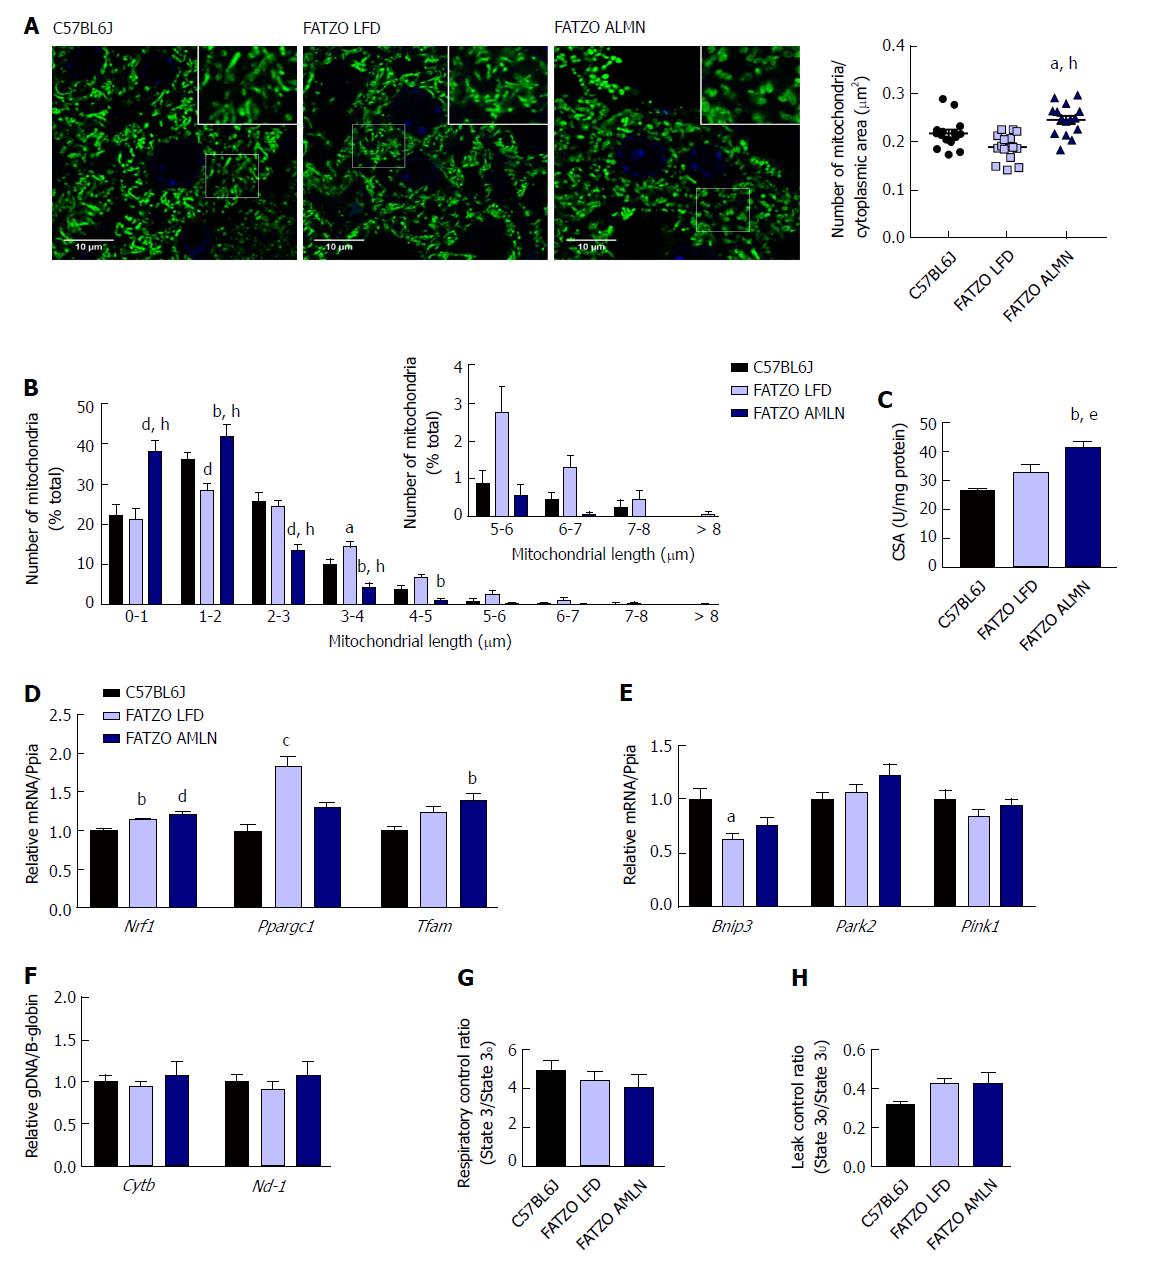
Similar to ob/ob mice, FATZO AMLN mice displayed significantly increased numbers of fragmented mitochondria (Figure 9A, B) and hepatic CSA (Figure 9C) compared to FATZO LFD and lean controls. In contrast, this increase was associated with a significant induction of mitochondrial biogenesis genes in FATZO mice. Nrf1 was consistently induced in both FATZO LFD and FATZO AMLN livers compared to lean controls (P < 0.01 for FATZO LFD, P < 0.0001 for FATZO AMLN vs lean), Ppargc1a was significantly induced in FATZO LFD livers compared to lean controls (1.75-fold, P < 0.001) and Tfam was significantly induced in FATZO AMLN livers vs lean controls 1.4-fold, P < 0.01; Figure 9D). Additionally, decreased mitophagy may contribute to increased mitochondrial content, although only Bnip3 expression was significantly reduced in FATZO LFD and FATZO AMLN livers compared to lean controls (-40%, P < 0.05 for FATZO LFD, -25%, P = 0.08 for FATZO AMLN vs lean) with no changes observed in Park2 or Pink1 expression (Supplementary Figure 9E). No differences in the mitochondrial:nuclear DNA ratio were observed (Figure 9F), suggesting that mtDNA replication is occurring normally in contrast to that observed in the ob/ob AMLN model.
To assess hepatic mitochondrial function in the FATZO mice we measured mitochondrial coupling and proton leak in isolated mitochondria. While there was a trend for reduced RCR in FATZO AMLN mitochondria compared to lean controls, this reduction was small and did not reach statistical significance (4.1 vs 4.9, P = 0.5; Figure 9G). Similar to the ob/ob models, both FATZO LFD and FATZO AMLN mitochondria displayed a trend for increased proton leak compared to lean controls (0.43 for both FATZO LFD and AMLN vs 0.32 for lean controls; P = 0.08 and P = 0.07, respectively; Figure 9H).
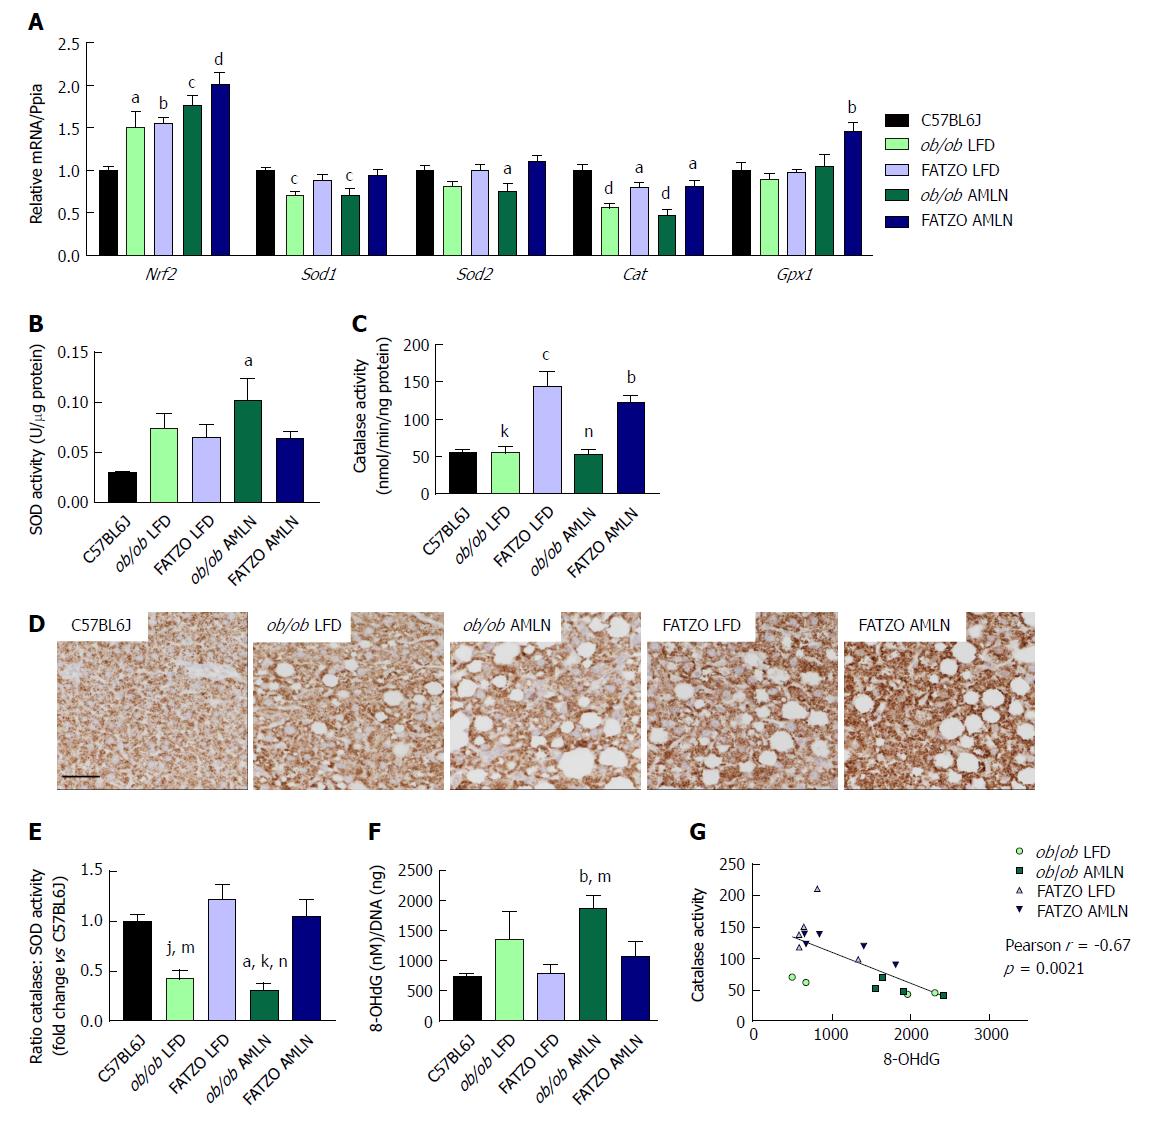
The oxidative stress responsive transcription factor Nrf2 was significantly induced in both ob/ob and FATZO mice on LFD and further induced by AMLN diet, indicating that the antioxidant response system was induced. Interestingly, when we quantified the expression levels of antioxidant enzymes that are collectively required for ROS detoxification, including superoxide dismustase 1 (Sod1), superoxide dismutase 2 (Sod2) and catalase (Cat), we detected unchanged or reduced hepatic expression in all diseased livers. Sod1 mRNA was significantly reduced in both ob/ob LFD and ob/ob AMLN livers compared to lean controls (-25%, P < 0.001 for both; Figure 6A), while Sod2 expression was significantly reduced in ob/ob AMLN livers compared to lean controls (-25%, P < 0.05; Figure 10A). All diseased livers displayed significantly reduced Cat expression compared to lean controls (-50%, P < 0.0001 for ob/ob LFD and AMLN vs lean controls; -20%, P < 0.05 for FATZO LFD and AMLN vs lean controls; Figure 10A). FATZO AMLN livers, however, did display significantly increased glutathione peroxidase (Gpx1) mRNA levels (+50%, P < 0.01 vs C57BL6J, Figure 10A).
Despite reduced (ob/ob mice) or unchanged (FATZO mice) Sod1 and Sod2 mRNA, there was a trend for increased hepatic superoxide dismutase activity for ob/ob and FATZO mice compared to lean controls (P < 0.05 ob/ob AMLN vs lean; Figure 10B). Catalase activity was increased approximately 2-fold in both FATZO LFD (P < 0.001) and FATZO AMLN livers (P < 0.01), but unchanged in ob/ob LFD and ob/ob AMLN livers compared to lean controls (Figure 10C). We also detected increased catalase expression in liver sections from FATZO LFD and FATZO AMLN mice compared to lean controls (Figure 10D). Further, the ratio of hepatic catalase:SOD activity was reduced in ob/ob LFD mice and worsened by AMLN diet, but unchanged in FATZO animals compared to lean controls (Figure 10E). Hepatic 8-hydroxydeoxyguanosine (8-OHdG), a marker of oxidative DNA damage, tended to be higher in ob/ob LFD animals compared to both lean controls and FATZO LFD mice (Figure 10F). In ob/ob AMLN mice, hepatic 8-OHdG levels were significantly higher than both FATZO mice and lean controls (2.5-fold, P < 0.01 vs lean; Figure 10E). Additionally, we observed a negative correlation between catalase activity and hepatic 8-OHdG levels (Figure 10G). Taken together these data suggest that a reduced ability to manage ROS may be a key mechanism underlying the more severe liver phenotype observed in ob/ob AMLN mice.
The increasing health and economic burden and lack of FDA-approved therapies underscore the importance of appropriate pre-clinical models for NAFLD/NASH[22]. Surprisingly, only a handful of animal models are available that reflect human disease with respect to metabolic status and liver pathology[23,24]. These models are similar in that their genetic background predisposes to diet-induced NASH, and include the DIAMOND model[25], the ob/ob mouse[13,26], and the LDLR knockout mouse[27]. To a lesser extent, C57BL6J mice fed a high-fat (AMLN) diet will also develop NASH when given enough time (> 24 wk), but this model does not develop as advanced fibrosis[28,29]. Other reported models of liver disease do not develop liver inflammation, such as the APOE2 knock-in mouse[27], or lack metabolic context, such as the CCl4 and MCDD models.
We report herein that both the leptin-deficient ob/ob mouse and hyperleptinemic FATZO mouse develop steatohepatitis within 12 wk of AMLN diet feeding. Despite similar levels of liver lipid and less severe hyperinsulinemia, ob/ob AMLN mice displayed a worse liver phenotype with increased inflammation and more advanced fibrosis relative to FATZO mice. Notably, hepatic expression of macrophage markers and related inflammatory chemokines were more prominently upregulated in ob/ob AMLN compared to FATZO AMLN mice, but were similar in ob/ob LFD and FATZO LFD animals, suggesting that the baseline inflammatory status and matrix deposition of the livers is similar in these models and that leptin deficiency per se does not predispose the liver to inflammation and fibrosis, but nonetheless may contribute to a proinflammatory, profibrotic phenotype upon dietary challenge.
While the precise pathophysiology of NASH remains to be fully determined, one aspect that has emerged in recent years is the role of mitochondrial (dys)function in hepatocytes associated with NAFLD/NASH. Evidence from human studies has recently emerged[8,30], however similar analyses in mouse models of NASH has not been reported. Multiple interconnected facets of mitochondrial biology including morphology, overall content (numbers and size), and respiratory capacity influence mitochondrial function. Our data show that ob/ob AMLN mice developed NASH associated with increased numbers of fragmented mitochondria with reduced respiratory capacity but without overt defects in mitochondrial membrane integrity or cristae structure. Similarly, FATZO AMLN mice displayed fragmented mitochondria with a trend for reduced respiratory control, but nonetheless better responded to oxidative damage and presented less overall fibrosis.
Mitochondrial morphology is appreciated to play an active role in regulating energy metabolism and cell death and can therefore influence NASH development at numerous stages[31,32]. Leptin has previously been shown to alter mitochondrial morphology and function. In primary mouse hepatocytes, leptin treatment induced mitochondrial fusion through induction of Ppargc1a and Mfn1 and was associated with protection from high-glucose induced fatty acid accumulation[33]. Complementary work demonstrated that inhibition of mitochondrial fission reduced steatosis and development of NAFLD[34]. Mfn1 and Opa1 expression were significantly reduced in ob/ob mice when fed AMLN diet. Consistent with transcript levels, we observed smaller but more numerous mitochondria in both ob/ob AMLN and FATZO AMLN hepatocytes. Increased mitochondrial fragmentation and uncoupling have been proposed as adaptive mechanisms to reduce ROS levels and maintain energy balance by limiting ATP production in states of excess substrate supply which may explain the more fragmented, leaky mitochondria in ob/ob AMLN and FATZO AMLN livers.
Reduced mitochondrial function assessed by coupling efficiency and proton leak was also observed in both models; however, only ob/ob AMLN livers displayed significantly reduced mtDNA levels, similar to patients with NAFLD[35,36], which may affect other aspects of mitochondrial function including ATP generation and ROS production. Moreover, ROS itself may promote mtDNA mutation and degradation[37], leading to a feed-forward loop of continuous oxidative damage that leads to hepatocyte cell death, inflammation and fibrosis development. As such, targeting hepatic oxidative stress driven by chronic overnutrition could be an important therapeutic target for NASH prevention.
The capacity to manage oxidative stress was dissimilar between ob/ob and FATZO mice. Multiple antioxidant molecules within the cell are regulated by the transcription factor NRF2. While hepatic Nrf2 expression was significantly upregulated in both ob/ob and FATZO livers, indicative of increased oxidative stress, oxidative DNA damage was only detected in ob/ob livers. Increased hepatic superoxide dismutase activity was detected in both ob/ob and FATZO animals, suggestive of elevated hydrogen peroxide in these livers, but concomitantly increased catalase activity and Gpx1 expression was detected only in FATZO liver. Increased hepatic hydrogen peroxide levels have been reported for humans with NASH and correlated with catalase activity and oxidative DNA damage[8]. In line with these human studies, hepatic catalase activity was indeed negatively correlated with 8-OHdG levels.
In the clinic, single antioxidant therapy has shown mixed efficacy. Among these agents, vitamin E (despite its limited antioxidant efficacy) is the most investigated[38,39]. While the majority of studies showed improvements in select features, including steatosis, serum ALT and histopathology, none have demonstrated improvement in fibrosis, the key feature linked to disease progression[40]. Strategies to enhance antioxidant defenses are also being actively explored. One such target is NRF2, which can be activated by numerous natural products, including resveratrol and synthetic compounds[41]. Combination strategies that include the oxidant scavenging effects with an anti-fibrotic molecule such as the anti-galectin 3 drug GR-MD-02, currently in Phase 2 trials[42] may be informative.
In summary, we have described convenient mouse models of NAFLD/NASH that accurately reflect human disease context (obesity and insulin resistance) and liver pathology (steatosis, ballooning degeneration, inflammation and fibrosis). Additionally, both models appear to mimic reported aspects of mitochondrial phenotype in human NASH, including elevated mitochondrial numbers and increased proton leak. The unanticipated differences in disease severity may in part be due to an increased ability to manage oxidative stress in the FATZO mouse. These models may better predict therapeutic efficacy of putative NASH treatments in the clinic, particularly for agents targeting mitochondrial/oxidative pathways.
Non-alcoholic steatohepatitis (NASH) is an unmet medical need with no approved therapies. Studies here characterize the hepatic phenotype of two different diet-induced mouse models of NASH with a focus on mitochondrial function and ability to regulate oxidative damage.
Emerging evidence from cross-sectional human studies suggests a role for mitochondrial function in the development of NASH. As the pathogenesis of NASH remains largely unknown it is imperative to characterize potential therapeutic agents in a relevant preclinical model.
The primary objective was to characterize NASH histopathology (e.g., NASH activity score for steatosis, inflammation, ballooning and fibrosis) and function with a focus on mitochondrial biology and capacity to respond to oxidative stress. We contrast these endpoints in two distinct mouse strains (genetically obese Lepob/Lepob (ob/ob) and polygenic obesity-prone FATZO mice) on a previously validated NASH-inducing diet that is high in trans-fat, fructose and cholesterol (AMLN diet).
Development of NASH was assessed using blinded qualitative (HE stained sections) and quantitative (% collagen-stained area) methods. Mitochondria were assessed via transmission electron micrography and immunofluorescent detection of HSP60. Mitochondrial function was assessed in primary hepatocytes using Seahorse. Activity of superoxide dismutase and catalase were measured from whole liver tissue homogenates. Candidate genes from total liver RNA were measured using quantitative PCR.
Both ob/ob and FATZO mice developed NASH with concomitant obesity and hyperinsulinemia when challenged with AMLN diet for 12 wk, and was associated with mitochondrial accumulation and reduced function. The degree of hepatic fibrosis, however, was markedly greater in ob/ob mice and was associated with increased activity of superoxide dismutase (SOD), whereas FATZO mice displayed increased catalase activity. Antioxidant capacity, reflected as the ratio of catalase: SOD activity, was significantly perturbed in ob/ob mice with diet-induced NASH.
Both of these commonly available mouse models develop AMLN diet-induced NASH after 12 wk, associated with reduced mitochondrial function and perturbed morphology. The intrinsic capacity of the FATZO mice to increase antioxidant capacity in the face of impaired mitochondrial function/increased oxidative damage due to diet may be contributory towards the reduced level of fibrosis in that model.
The AMLN mouse model of NASH is gaining widespread academic and industry acceptance as a translatable model of NASH. These studies extend previous observations in the model to highlight mitochondrial dysfunction thus confirming the model as relevant for prosecution of therapeutic agents targeting improvement in mitochondrial function for NASH. Furthermore, the contrasting fibrosis between ob/ob and FATZO mice implicates the capacity to adapt to oxidative damage as a key regulator of liver fibrosis in diet-induced NASH.
We gratefully acknowledge the assistance of Sally Lee, Holly Koelkebeck, Wanda King, Kenesha Riley and Charles Brown (MedImmune, Gaithersburg, MD, United States) for expert technical assistance with tissue processing and immunohistochemistry. We thank Lorenz Rognoni and Farzad Sekhavati (Definiens, Germany) for tissue image analysis. We also thank Donna Goldsteen, Krystal Nacel and the Laboratory Animal Resource staff (MedImmune, Gaithersburg, MD) for their assistance with animal husbandry and care.
Manuscript source: Unsolicited manuscript
Specialty type: Gastroenterology and hepatology
Country of origin: United States
Peer-review report classification
Grade A (Excellent): A
Grade B (Very good): B
Grade C (Good): C
Grade D (Fair): 0
Grade E (Poor): 0
P- Reviewer: Garcia-Fernandez MI, Novo E, Streba LAM S- Editor: Ma YJ L- Editor: A E- Editor: Huang Y
| 1. | Younossi ZM, Blissett D, Blissett R, Henry L, Stepanova M, Younossi Y, Racila A, Hunt S, Beckerman R. The economic and clinical burden of nonalcoholic fatty liver disease in the United States and Europe. Hepatology. 2016;64:1577-1586. [RCA] [PubMed] [DOI] [Full Text] [Cited by in Crossref: 694] [Cited by in RCA: 915] [Article Influence: 101.7] [Reference Citation Analysis (0)] |
| 2. | Younossi ZM, Koenig AB, Abdelatif D, Fazel Y, Henry L, Wymer M. Global epidemiology of nonalcoholic fatty liver disease-Meta-analytic assessment of prevalence, incidence, and outcomes. Hepatology. 2016;64:73-84. [RCA] [PubMed] [DOI] [Full Text] [Cited by in Crossref: 5322] [Cited by in RCA: 7536] [Article Influence: 837.3] [Reference Citation Analysis (0)] |
| 3. | Kabbany MN, Conjeevaram Selvakumar PK, Watt K, Lopez R, Akras Z, Zein N, Carey W, Alkhouri N. Prevalence of Nonalcoholic Steatohepatitis-Associated Cirrhosis in the United States: An Analysis of National Health and Nutrition Examination Survey Data. Am J Gastroenterol. 2017;112:581-587. [RCA] [PubMed] [DOI] [Full Text] [Cited by in Crossref: 129] [Cited by in RCA: 177] [Article Influence: 22.1] [Reference Citation Analysis (0)] |
| 4. | Patterson RE, Kalavalapalli S, Williams CM, Nautiyal M, Mathew JT, Martinez J, Reinhard MK, McDougall DJ, Rocca JR, Yost RA. Lipotoxicity in steatohepatitis occurs despite an increase in tricarboxylic acid cycle activity. Am J Physiol Endocrinol Metab. 2016;310:E484-E494. [RCA] [PubMed] [DOI] [Full Text] [Cited by in Crossref: 114] [Cited by in RCA: 125] [Article Influence: 13.9] [Reference Citation Analysis (0)] |
| 5. | Satapati S, Kucejova B, Duarte JA, Fletcher JA, Reynolds L, Sunny NE, He T, Nair LA, Livingston KA, Fu X. Mitochondrial metabolism mediates oxidative stress and inflammation in fatty liver. J Clin Invest. 2016;126:1605. [RCA] [PubMed] [DOI] [Full Text] [Cited by in Crossref: 31] [Cited by in RCA: 37] [Article Influence: 4.1] [Reference Citation Analysis (0)] |
| 6. | Begriche K, Massart J, Robin MA, Bonnet F, Fromenty B. Mitochondrial adaptations and dysfunctions in nonalcoholic fatty liver disease. Hepatology. 2013;58:1497-1507. [RCA] [PubMed] [DOI] [Full Text] [Cited by in Crossref: 375] [Cited by in RCA: 461] [Article Influence: 38.4] [Reference Citation Analysis (0)] |
| 7. | Satapati S, Sunny NE, Kucejova B, Fu X, He TT, Méndez-Lucas A, Shelton JM, Perales JC, Browning JD, Burgess SC. Elevated TCA cycle function in the pathology of diet-induced hepatic insulin resistance and fatty liver. J Lipid Res. 2012;53:1080-1092. [RCA] [PubMed] [DOI] [Full Text] [Cited by in Crossref: 287] [Cited by in RCA: 321] [Article Influence: 24.7] [Reference Citation Analysis (0)] |
| 8. | Koliaki C, Szendroedi J, Kaul K, Jelenik T, Nowotny P, Jankowiak F, Herder C, Carstensen M, Krausch M, Knoefel WT. Adaptation of hepatic mitochondrial function in humans with non-alcoholic fatty liver is lost in steatohepatitis. Cell Metab. 2015;21:739-746. [RCA] [PubMed] [DOI] [Full Text] [Cited by in Crossref: 567] [Cited by in RCA: 766] [Article Influence: 76.6] [Reference Citation Analysis (0)] |
| 9. | Auger C, Alhasawi A, Contavadoo M, Appanna VD. Dysfunctional mitochondrial bioenergetics and the pathogenesis of hepatic disorders. Front Cell Dev Biol. 2015;3:40. [RCA] [PubMed] [DOI] [Full Text] [Full Text (PDF)] [Cited by in Crossref: 69] [Cited by in RCA: 86] [Article Influence: 8.6] [Reference Citation Analysis (0)] |
| 10. | Sunny NE, Bril F, Cusi K. Mitochondrial Adaptation in Nonalcoholic Fatty Liver Disease: Novel Mechanisms and Treatment Strategies. Trends Endocrinol Metab. 2017;28:250-260. [RCA] [PubMed] [DOI] [Full Text] [Cited by in Crossref: 192] [Cited by in RCA: 237] [Article Influence: 29.6] [Reference Citation Analysis (0)] |
| 11. | Gusdon AM, Song KX, Qu S. Nonalcoholic Fatty liver disease: pathogenesis and therapeutics from a mitochondria-centric perspective. Oxid Med Cell Longev. 2014;2014:637027. [RCA] [PubMed] [DOI] [Full Text] [Full Text (PDF)] [Cited by in Crossref: 101] [Cited by in RCA: 126] [Article Influence: 11.5] [Reference Citation Analysis (0)] |
| 12. | Machado MV, Michelotti GA, Xie G, Almeida Pereira T, Boursier J, Bohnic B, Guy CD, Diehl AM. Mouse models of diet-induced nonalcoholic steatohepatitis reproduce the heterogeneity of the human disease. PLoS One. 2015;10:e0127991. [RCA] [PubMed] [DOI] [Full Text] [Full Text (PDF)] [Cited by in Crossref: 212] [Cited by in RCA: 246] [Article Influence: 24.6] [Reference Citation Analysis (0)] |
| 13. | Trevaskis JL, Griffin PS, Wittmer C, Neuschwander-Tetri BA, Brunt EM, Dolman CS, Erickson MR, Napora J, Parkes DG, Roth JD. Glucagon-like peptide-1 receptor agonism improves metabolic, biochemical, and histopathological indices of nonalcoholic steatohepatitis in mice. Am J Physiol Gastrointest Liver Physiol. 2012;302:G762-G772. [RCA] [PubMed] [DOI] [Full Text] [Cited by in Crossref: 175] [Cited by in RCA: 207] [Article Influence: 15.9] [Reference Citation Analysis (1)] |
| 14. | Droz BA, Sneed BL, Jackson CV, Zimmerman KM, Michael MD, Emmerson PJ, Coskun T, Peterson RG. Correlation of disease severity with body weight and high fat diet in the FATZO/Pco mouse. PLoS One. 2017;12:e0179808. [RCA] [PubMed] [DOI] [Full Text] [Full Text (PDF)] [Cited by in Crossref: 8] [Cited by in RCA: 11] [Article Influence: 1.4] [Reference Citation Analysis (0)] |
| 15. | Peterson RG, Jackson CV, Zimmerman KM, Alsina-Fernandez J, Michael MD, Emmerson PJ, Coskun T. Glucose dysregulation and response to common anti-diabetic agents in the FATZO/Pco mouse. PLoS One. 2017;12:e0179856. [RCA] [PubMed] [DOI] [Full Text] [Full Text (PDF)] [Cited by in Crossref: 15] [Cited by in RCA: 25] [Article Influence: 3.1] [Reference Citation Analysis (0)] |
| 16. | Kleiner DE, Brunt EM, Van Natta M, Behling C, Contos MJ, Cummings OW, Ferrell LD, Liu YC, Torbenson MS, Unalp-Arida A. Design and validation of a histological scoring system for nonalcoholic fatty liver disease. Hepatology. 2005;41:1313-1321. [RCA] [PubMed] [DOI] [Full Text] [Cited by in Crossref: 6807] [Cited by in RCA: 8235] [Article Influence: 411.8] [Reference Citation Analysis (5)] |
| 17. | Alarcon C, Boland BB, Uchizono Y, Moore PC, Peterson B, Rajan S, Rhodes OS, Noske AB, Haataja L, Arvan P. Pancreatic β-Cell Adaptive Plasticity in Obesity Increases Insulin Production but Adversely Affects Secretory Function. Diabetes. 2016;65:438-450. [RCA] [PubMed] [DOI] [Full Text] [Cited by in Crossref: 78] [Cited by in RCA: 90] [Article Influence: 10.0] [Reference Citation Analysis (0)] |
| 18. | Kremer JR, Mastronarde DN, McIntosh JR. Computer visualization of three-dimensional image data using IMOD. Journal of Structural Biology. 1996;71-76. [RCA] [PubMed] [DOI] [Full Text] [Cited by in Crossref: 4053] [Cited by in RCA: 4019] [Article Influence: 138.6] [Reference Citation Analysis (0)] |
| 19. | Boland BB, Brown C Jr. Alarcon C, Demozay D, Grimsby JS, Rhodes CJ. β-Cell Control of Insulin Production During Starvation-Refeeding in Male Rats. Endocrinology. 2018;159:895-906. [RCA] [PubMed] [DOI] [Full Text] [Cited by in Crossref: 17] [Cited by in RCA: 25] [Article Influence: 3.6] [Reference Citation Analysis (0)] |
| 20. | Glick D, Zhang W, Beaton M, Marsboom G, Gruber M, Simon MC, Hart J, Dorn GW 2nd, Brady MJ, Macleod KF. BNip3 regulates mitochondrial function and lipid metabolism in the liver. Mol Cell Biol. 2012;32:2570-2584. [RCA] [PubMed] [DOI] [Full Text] [Cited by in Crossref: 157] [Cited by in RCA: 195] [Article Influence: 15.0] [Reference Citation Analysis (0)] |
| 21. | Chavin KD, Yang S, Lin HZ, Chatham J, Chacko VP, Hoek JB, Walajtys-Rode E, Rashid A, Chen CH, Huang CC. Obesity induces expression of uncoupling protein-2 in hepatocytes and promotes liver ATP depletion. J Biol Chem. 1999;274:5692-5700. [PubMed] |
| 22. | Abdelmalek MF. NAFLD: The clinical and economic burden of NAFLD: time to turn the tide. Nat Rev Gastroenterol Hepatol. 2016;13:685-686. [RCA] [PubMed] [DOI] [Full Text] [Cited by in Crossref: 14] [Cited by in RCA: 15] [Article Influence: 1.7] [Reference Citation Analysis (0)] |
| 23. | Hansen HH, Feigh M, Veidal SS, Rigbolt KT, Vrang N, Fosgerau K. Mouse models of nonalcoholic steatohepatitis in preclinical drug development. Drug Discov Today. 2017;22:1707-1718. [RCA] [PubMed] [DOI] [Full Text] [Cited by in Crossref: 126] [Cited by in RCA: 176] [Article Influence: 22.0] [Reference Citation Analysis (0)] |
| 24. | Larter CZ, Yeh MM. Animal models of NASH: getting both pathology and metabolic context right. J Gastroenterol Hepatol. 2008;23:1635-1648. [RCA] [PubMed] [DOI] [Full Text] [Cited by in Crossref: 249] [Cited by in RCA: 258] [Article Influence: 15.2] [Reference Citation Analysis (0)] |
| 25. | Asgharpour A, Cazanave SC, Pacana T, Seneshaw M, Vincent R, Banini BA, Kumar DP, Daita K, Min HK, Mirshahi F. A diet-induced animal model of non-alcoholic fatty liver disease and hepatocellular cancer. J Hepatol. 2016;65:579-588. [RCA] [PubMed] [DOI] [Full Text] [Full Text (PDF)] [Cited by in Crossref: 365] [Cited by in RCA: 392] [Article Influence: 43.6] [Reference Citation Analysis (0)] |
| 26. | Clapper JR, Hendricks MD, Gu G, Wittmer C, Dolman CS, Herich J, Athanacio J, Villescaz C, Ghosh SS, Heilig JS. Diet-induced mouse model of fatty liver disease and nonalcoholic steatohepatitis reflecting clinical disease progression and methods of assessment. Am J Physiol Gastrointest Liver Physiol. 2013;305:G483-G495. [RCA] [PubMed] [DOI] [Full Text] [Cited by in Crossref: 181] [Cited by in RCA: 225] [Article Influence: 18.8] [Reference Citation Analysis (0)] |
| 27. | Bieghs V, Van Gorp PJ, Wouters K, Hendrikx T, Gijbels MJ, van Bilsen M, Bakker J, Binder CJ, Lütjohann D, Staels B. LDL receptor knock-out mice are a physiological model particularly vulnerable to study the onset of inflammation in non-alcoholic fatty liver disease. PLoS One. 2012;7:e30668. [RCA] [PubMed] [DOI] [Full Text] [Full Text (PDF)] [Cited by in Crossref: 113] [Cited by in RCA: 128] [Article Influence: 9.8] [Reference Citation Analysis (0)] |
| 28. | Liedtke C, Luedde T, Sauerbruch T, Scholten D, Streetz K, Tacke F, Tolba R, Trautwein C, Trebicka J, Weiskirchen R. Experimental liver fibrosis research: update on animal models, legal issues and translational aspects. Fibrogenesis Tissue Repair. 2013;6:19. [RCA] [PubMed] [DOI] [Full Text] [Full Text (PDF)] [Cited by in Crossref: 211] [Cited by in RCA: 251] [Article Influence: 20.9] [Reference Citation Analysis (0)] |
| 29. | Kristiansen MN, Veidal SS, Rigbolt KT, Tølbøl KS, Roth JD, Jelsing J, Vrang N, Feigh M. Obese diet-induced mouse models of nonalcoholic steatohepatitis-tracking disease by liver biopsy. World J Hepatol. 2016;8:673-684. [RCA] [PubMed] [DOI] [Full Text] [Full Text (PDF)] [Cited by in Crossref: 87] [Cited by in RCA: 99] [Article Influence: 11.0] [Reference Citation Analysis (4)] |
| 30. | Hyötyläinen T, Jerby L, Petäjä EM, Mattila I, Jäntti S, Auvinen P, Gastaldelli A, Yki-Järvinen H, Ruppin E, Orešič M. Genome-scale study reveals reduced metabolic adaptability in patients with non-alcoholic fatty liver disease. Nat Commun. 2016;7:8994. [RCA] [PubMed] [DOI] [Full Text] [Cited by in Crossref: 94] [Cited by in RCA: 89] [Article Influence: 9.9] [Reference Citation Analysis (0)] |
| 31. | Westermann B. Mitochondrial fusion and fission in cell life and death. Nat Rev Mol Cell Biol. 2010;11:872-884. [RCA] [PubMed] [DOI] [Full Text] [Cited by in Crossref: 1278] [Cited by in RCA: 1519] [Article Influence: 101.3] [Reference Citation Analysis (0)] |
| 32. | Wai T, Langer T. Mitochondrial Dynamics and Metabolic Regulation. Trends Endocrinol Metab. 2016;27:105-117. [RCA] [PubMed] [DOI] [Full Text] [Cited by in Crossref: 729] [Cited by in RCA: 965] [Article Influence: 107.2] [Reference Citation Analysis (0)] |
| 33. | Hsu WH, Lee BH, Pan TM. Leptin-induced mitochondrial fusion mediates hepatic lipid accumulation. Int J Obes (Lond). 2015;39:1750-1756. [RCA] [PubMed] [DOI] [Full Text] [Cited by in Crossref: 26] [Cited by in RCA: 32] [Article Influence: 3.2] [Reference Citation Analysis (0)] |
| 34. | Galloway CA, Lee H, Brookes PS, Yoon Y. Decreasing mitochondrial fission alleviates hepatic steatosis in a murine model of nonalcoholic fatty liver disease. Am J Physiol Gastrointest Liver Physiol. 2014;307:G632-G641. [RCA] [PubMed] [DOI] [Full Text] [Cited by in Crossref: 64] [Cited by in RCA: 91] [Article Influence: 8.3] [Reference Citation Analysis (0)] |
| 35. | Sookoian S, Rosselli MS, Gemma C, Burgueño AL, Fernández Gianotti T, Castaño GO, Pirola CJ. Epigenetic regulation of insulin resistance in nonalcoholic fatty liver disease: impact of liver methylation of the peroxisome proliferator-activated receptor γ coactivator 1α promoter. Hepatology. 2010;52:1992-2000. [RCA] [PubMed] [DOI] [Full Text] [Cited by in Crossref: 248] [Cited by in RCA: 251] [Article Influence: 16.7] [Reference Citation Analysis (0)] |
| 36. | Sookoian S, Flichman D, Scian R, Rohr C, Dopazo H, Gianotti TF, Martino JS, Castaño GO, Pirola CJ. Mitochondrial genome architecture in non-alcoholic fatty liver disease. J Pathol. 2016;240:437-449. [RCA] [PubMed] [DOI] [Full Text] [Cited by in Crossref: 43] [Cited by in RCA: 64] [Article Influence: 7.1] [Reference Citation Analysis (0)] |
| 37. | Shokolenko I, Venediktova N, Bochkareva A, Wilson GL, Alexeyev MF. Oxidative stress induces degradation of mitochondrial DNA. Nucleic Acids Res. 2009;37:2539-2548. [RCA] [PubMed] [DOI] [Full Text] [Full Text (PDF)] [Cited by in Crossref: 326] [Cited by in RCA: 397] [Article Influence: 24.8] [Reference Citation Analysis (0)] |
| 38. | Al-Busafi SA, Bhat M, Wong P, Ghali P, Deschenes M. Antioxidant therapy in nonalcoholic steatohepatitis. Hepat Res Treat. 2012;2012:947575. [RCA] [PubMed] [DOI] [Full Text] [Full Text (PDF)] [Cited by in Crossref: 22] [Cited by in RCA: 28] [Article Influence: 2.2] [Reference Citation Analysis (0)] |
| 39. | Sanyal AJ, Chalasani N, Kowdley KV, McCullough A, Diehl AM, Bass NM, Neuschwander-Tetri BA, Lavine JE, Tonascia J, Unalp A. Pioglitazone, vitamin E, or placebo for nonalcoholic steatohepatitis. N Engl J Med. 2010;362:1675-1685. [RCA] [PubMed] [DOI] [Full Text] [Full Text (PDF)] [Cited by in Crossref: 2642] [Cited by in RCA: 2469] [Article Influence: 164.6] [Reference Citation Analysis (2)] |
| 40. | Hagström H, Nasr P, Ekstedt M, Hammar U, Stål P, Hultcrantz R, Kechagias S. Fibrosis stage but not NASH predicts mortality and time to development of severe liver disease in biopsy-proven NAFLD. J Hepatol. 2017;67:1265-1273. [RCA] [PubMed] [DOI] [Full Text] [Cited by in Crossref: 540] [Cited by in RCA: 776] [Article Influence: 97.0] [Reference Citation Analysis (0)] |
| 41. | Musso G, Cassader M, Gambino R. Non-alcoholic steatohepatitis: emerging molecular targets and therapeutic strategies. Nat Rev Drug Discov. 2016;15:249-274. [RCA] [PubMed] [DOI] [Full Text] [Cited by in Crossref: 278] [Cited by in RCA: 342] [Article Influence: 38.0] [Reference Citation Analysis (0)] |
| 42. | Harrison SA, Marri SR, Chalasani N, Kohli R, Aronstein W, Thompson GA, Irish W, Miles MV, Xanthakos SA, Lawitz E. Randomised clinical study: GR-MD-02, a galectin-3 inhibitor, vs. placebo in patients having non-alcoholic steatohepatitis with advanced fibrosis. Aliment Pharmacol Ther. 2016;44:1183-1198. [RCA] [PubMed] [DOI] [Full Text] [Cited by in Crossref: 107] [Cited by in RCA: 135] [Article Influence: 15.0] [Reference Citation Analysis (0)] |


