Published online Sep 14, 2017. doi: 10.3748/wjg.v23.i34.6231
Peer-review started: March 9, 2017
First decision: April 21, 2017
Revised: May 2, 2017
Accepted: June 1, 2017
Article in press: June 1, 2017
Published online: September 14, 2017
Processing time: 190 Days and 14.2 Hours
To examine the changes of the ghrelin/ghrelin O-acyltransferase (GOAT) axis and the mammalian target of rapamycin (mTOR) pathway in the hypothalamus after sleeve gastrectomy.
A total of 30 obese type-2 diabetes Sprague-Dawley (SD) rats, 6 wk of age, fed with high-sugar and high-fat fodder for 2 mo plus intraperitoneal injection of streptozotocin were randomly divided into three groups: non-operation group (S0 group, n = 10), sham operation group (Sh group, n = 10) and sleeve gastrectomy group (SG group, n = 10). Data of body mass, food intake, oral glucose tolerance test (OGTT), acylated ghrelin (AG) and total ghrelin (TG) were collected and measured at the first day (when the rats were 6 wk old), preoperative day 3 and postoperative week 8. The mRNA expression of preproghrelin, GOAT and neuropeptide Y (NPY), and protein expression of ghrelin, GOAT, GHSR and the mTOR pathway (p-Akt, p-mTOR and p-S6) were measured in the hypothalamus.
SG can significantly improve metabolic symptoms by reducing body mass and food intake. The obese rats showed lower serum TG levels and no change in AG, but the ratio of AG/TG was increased. When compared with the S0 and Sh groups, the SG group showed decreased TG (1482.03 ± 26.55, 1481.49 ± 23.30 and 1206.63 ± 52.02 ng/L, respectively, P < 0.05), but unchanged AG (153.06 ± 13.74, 155.37 ± 19.30 and 144.44 ± 16.689 ng/L, respectively, P > 0.05). As a result, the ratio of AG/TG further increased in the SG group (0.103 ± 0.009, 0.105 ± 0.013 and 0.12 ± 0.016, respectively, P < 0.05). When compared with the S0 group, SG suppressed mRNA and protein levels of preproghrelin (0.63 ± 0.12 vs 0.5 ± 0.11, P < 0.05) and GOAT (0.96 ± 0.09 vs 0.87 ± 0.08, P < 0.05), but did not change NPY mRNA expression (0.61 ± 0.04 vs 0.65 ± 0.07, P > 0.05) in the hypothalamus. The protein levels of p-Akt, p-mTOR and p-S6 were higher in the SG group, which indicated that the hypothalamic mTOR pathway was activated after SG at the postoperative week 8.
The reduction of ghrelin expression and activation of the mTOR pathway might have opposite effects on food intake, as SG improves obesity and T2DM.
Core tip: Recent studies have demonstrated a complex relationship between ghrelin, ghrelin O-acyltransferase (GOAT) and the mammalian target of rapamycin (mTOR) pathway. In our study, we examined the changes of the ghrelin/GOAT axis and the mTOR pathway in the hypothalamus after sleeve gastrectomy (SG). The mRNA and protein levels of ghrelin and GOAT decreased after SG, while NPY mRNA expression did not change. We also found that SG increased the protein levels of p-Akt, p-mTOR and p-S6. The reduction of ghrelin expression and activation of the mTOR pathway might have opposite effects on food intake. These findings might explain the weight, glucose and food intake regain after SG.
- Citation: Wang Q, Tang W, Rao WS, Song X, Shan CX, Zhang W. Changes of Ghrelin/GOAT axis and mTOR pathway in the hypothalamus after sleeve gastrectomy in obese type-2 diabetes rats. World J Gastroenterol 2017; 23(34): 6231-6241
- URL: https://www.wjgnet.com/1007-9327/full/v23/i34/6231.htm
- DOI: https://dx.doi.org/10.3748/wjg.v23.i34.6231
Obesity and type-2 diabetes mellitus (T2DM) are closely related epidemic diseases with increasing incidence rates worldwide. Lifestyle factors such as high-fat diet, lack of physical activity, genetic and environmental factors are important causes of diabetes. As one of the most commonly used bariatric surgeries, sleeve gastrectomy (SG) can effectively reduce obesity and improve metabolic symptoms by weight loss and hormonal change. Recent studies have found that weight loss and T2DM remission may be related to ghrelin, bile acids and microbiota changes after SG[1].
Ghrelin, mainly found in the stomach, is an endogenous ligand for the growth hormone secretagogue receptor type 1a (GHS-R1a) and has two major molecular forms, acylated ghrelin (AG) and unacylated ghrelin (UAG)[2-4]. As the activated form of ghrelin, AG is best known for its effect on growth hormone-releasing neurons. For instance, AG was shown to increase neuropeptide Y (NPY) mRNA expression levels by the mammalian target of rapamycin (mTOR) in the hypothalamus[5,6]. The enzyme responsible for transforming UAG to AG was identified in 2008 and named ghrelin O-acyltransferase (GOAT)[7]. A recent study found that AG could regulate GOAT expression in the stomach[8] and that the widespread expression of GOAT corresponded to the widespread distribution of ghrelin expression, e.g., in the pancreas, stomach and hypothalamus[8,9]. Multiple studies have demonstrated that both ghrelin and GOAT play important roles in the regulation of obesity, blood glucose and insulin[5,10,11]. However, it is not clear whether the ghrelin/GOAT axis in the hypothalamus (via autocrine/paracrine signaling) is involved in the maintenance of blood glucose concentrations and energy homeostasis by restricting food intake after SG.
Recent studies suggested that the mTOR pathway may play an important role and have complex impact on several cellular functions, such as cell growth, weight loss, food intake and even insulin resistance[12-16]. It was also demonstrated that both energy deprivation and AG can activate the mTOR pathway to affect food intake[6,17]. Meanwhile, insulin inhibits GOAT expression via the mTOR pathway in islet cells[3] and SG can suppress the mRNA levels of preproghrelin and GOAT in a remnant stomach[18]. However, changes of the Ghrelin/GOAT axis and the mTOR pathway in the hypothalamus after SG have not yet been investigated. The aim of this study was to evaluate these changes to explain the mechanism of SG from a central point of view.
Seventy-seven male Sprague-Dawley rats (6 wk of age, weight: 150-180 g) were obtained from the Laboratory Animal Center of the Second Military Medical University. Equipment and reagents were obtained from the following sources: electronic analytical balance (Libror AEL-200 type, Japan); Roche glucometer (ACCU-CHEK® Performa, Roche Diagnostics); streptozotocin (Sigma-Aldrich, China); rat total ghrelin, AG and Insulin ELISA assay kit (R&D system, United States); ghrelin, GHSR, GOAT, p-AKT(s473), mTOR, p-mTOR(s2448), P70s6k, GAPDH antibody (Abcam, United States); and p-S6 (s235/236) antibody (Sigma-Aldrich, United States). All procedures conformed to the institutional standards of The Second Military Medical University Animal Care and Use Committee (approval no. SCXK(H) 2013-0016).
Rats had a mean body mass of 173.82 ± 14.32 g and were randomly divided into NF (fed normal fodder, n = 20) or HF groups (fed high-sugar and high-fat fodder, n = 57). During the 2-mo experiment, all rats were housed at 20-25 °C and 40%-60% relative humidity. Rats with a 20% higher body mass than the average weight of the NF group[19] were defined as obese rats. Noninsulin-dependent diabetes mellitus was induced in overnight-fasted rats by a single intraperitoneal injection of 45 mg/kg streptozotocin. Blood glucose was measured from the tail vein once daily within 3 d after injecting streptozotocin. Only the rats with an average blood glucose concentration > 16.7 mmol/L were included as successful T2DM models. Of all rats, 32 models were successfully established, with a success rate of 56.14%.
Of the 32 T2DM model rats, two rats died after SG. The remaining 30 rats were randomly divided into three groups: non-operation (S0 group, n = 10), sham operation (Sh group, n = 10) or sleeve gastrectomy group (SG group, n = 10).
All rats of the operation groups (both Sh and SG) were food- and water-deprived for 12 h before surgery. The rats were anesthetized by an i.p. injection of 0.3% sodium pentobarbital (50 mg/kg) and observed until corneal and pain reflexes were absent. A hypodermic injection of 0.9% sodium chloride solution (20 mL) and an intramuscular injection of penicillin sodium (800000 IU) were given to prevent dehydration and infection before the surgery began.
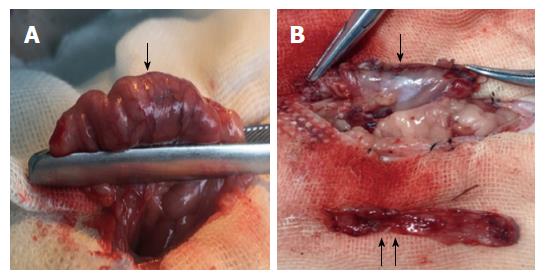
A 3-cm incision was made 1 cm below the xiphoid process. After opening the abdominal cavity and exposing the stomach, the ligaments surrounding the stomach and gastroepiploic tissues were broken. A 3-5-mm transverse incision was made along the greater curvature to empty the stomach contents. This step could avoid the contents outflowing quickly to prevent abdominal infection. After empting the stomach, the gastric fundus and a large portion of the gastric body (70% of the total stomach) were resected (Figure 1A). The residual stomach was then closed by a single-layer continuous suture using 6-0 absorbable lines (Figure 1B). Before closure of the skin, the abdominal cavity was rinsed with a warm 0.9% sodium chloride solution (20-30 mL).
Sham-operated rats underwent a similar procedure as the SG group, including anesthesia, a 3-5-mm transverse incision was made along the greater curvature near the pylorus to empty stomach contents. After empting the stomach, the incision was extended to 2 cm, with a waiting time that corresponded to the resection time in SG rats, followed by stomach closure. Rats that were operated on were allowed access to water 2 h after surgery, but were fasted for 24 h after operation. After 2-3 d, they were fed a non-residue diet; and after recovery, they consumed their preoperative diet.
Body mass was measured once every 5 d preoperatively and once a day postoperatively for 8 wk. Food intake was measured by recording the total amount of fodder consumed per week. To perform the oral glucose tolerance test (OGTT), all rats were fasted overnight and received a 50% glucose solution (1 g/kg) by oral gavage[20]. Blood was collected from the orbital vein to measure the glucose and insulin concentrations at 0, 15, 30, 60, 90 and 120 min after glucose infusion at the first day (rats were 6 wk old), preoperative day 3 and postoperative week 8. The area under the glucose curve (AUC-glucose), AUC-insulin and HOMA-IR (fasting insulin × fasting glucose/22.5) were calculated. The blood collected from the OGTT at 0 min was also used to measure AG and TG.
Hypothalamic tissue was collected for Western blotting and real-time polymerase chain reaction (PCR). All rats were sacrificed by an overdose of anesthesia. Sections containing the hypothalamus were cut according to the rat brain atlas of Paxinos and Watson and immediately frozen in liquid nitrogen[21].
The hypothalamus was crushed in PMSF lysate (50 mmol/L Tris-HCl, pH 8.0, 150 mmol/L NaCl, 1% Triton X-100, 100 μg/mL PMSF) for 30 min and then centrifuged at 12000 rpm for 5 min. Protein concentration was measured by the BCA protein assay reagent. A total of 40 μg protein was separated by a 10% SDS-PAGE and transferred to polyvinylidene fluoride membranes. All membranes were incubated overnight at 4 °C with primary antibodies. They were then incubated with secondary antibodies at room temperature for 1 h and visualized using the GChemiDoc MP imaging system and image lab software (Bio-Rad, United States). All results were expressed as target protein/GAPDH ratio.
Total RNA was extracted with Trizol Reagent (Invitrogen, United States). Then, 2 μg total RNA was reversely transcribed with Oligo (dT) primer and M-MLV Reverse Transcriptase (Promega, United States), according to the manufacturer’s instructions. The complementary DNA was used for real-time PCR, and a final volume of 20 μL was made as follows: 10 μL 2 × SYBR premix exTaq (TaKaRa, China), 0.8 μL forward and reverse primers (2.5 μmol/L, 5 μL cDNA, 4.2 μL ddH2O). PCR and data collection were performed on a CFX Connect™ Real-Time PCR Detection System (Takara), and data analysis was operated with the 2-ΔΔCt method normalized to the endogenous control β-actin. Primers used in real-time PCR were as follows: Rat preproghrelin: 5′-AAGCCCAGCAGAGAAAGGAATC-3′ (forward); 5′-CAACATCGAAGGGAGCATTGAAC-3′ (reverse). Rat GOAT: 5′-ATTTGTGAAGGGAAGGTGGAG-3′ (forward); 5′-CAGGAGAGCAGGGAAAAAGAG-3′ (reverse). Rat NPY: 5′-GGCCAGATACTACTCCGCTC-3′ (forward); 5′-GTCTTCAAGCCTTGTTCTGGG-3′ (reverse). Rat β-actin: 5′-GAGACCTTCAACACCCCAGCC-3′ (forward); 5′-TCGGGGCATCGGAACCGCTCA-3′ (reverse).
Data are presented as the mean ± SD. SPSS 20.0 (IBM, New York, United States) was used for statistical analyses, and GraphPad Prism 6.0c (GraphPad Software, San Diego, CA, United States) was used to edit images. Statistical indicators between the three groups (S0, Sh and SG) were determined by one-way ANOVA, followed by least significance difference (LSD) post hoc comparison. The statistical indicator between two time points in one group was determined by a paired t test, whereas Student’s t test was used to compare the means of two independent groups at the same time point.
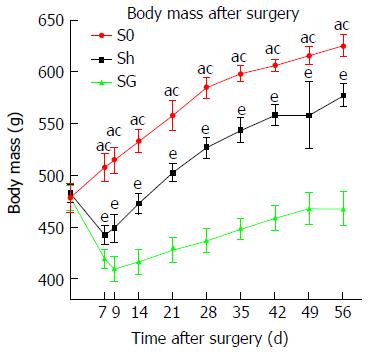
Baseline body mass before surgery did not differ between groups (P > 0.05). Rats in the Sh group and SG group weighed significantly less in the first postoperative week, which gradually normalized and increased in the second week after surgery when rats continued with their preoperative diet. The minimum weight was 442.17 ± 9.57 g in Sh rats at postoperative day 7 and 409.25 ± 12.7 g in SG rats at postoperative day 9. The weight in the sham group was restored to preoperative levels at postoperative day 17. The weight of SG rats remained low and did not reach baseline levels (Figure 2).
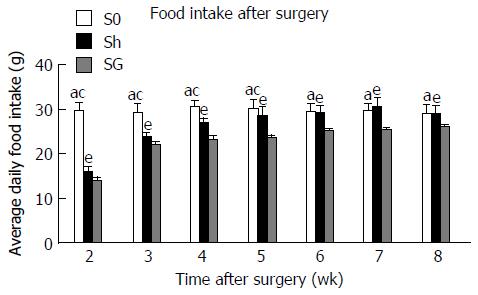
Food intake was significantly decreased in the Sh group and the SG group but was consistently higher in the Sh group compared to the SG group (Figure 3).
Fasting blood glucose: Fasting blood glucose did not differ between treatment groups at the first day (P > 0.05) and significantly increased in obese model rats (P < 0.05). Eight weeks after surgery, the fasting blood glucose levels in the SG group were significantly lower than in the S0 and Sh groups (P < 0.05; Table 1)
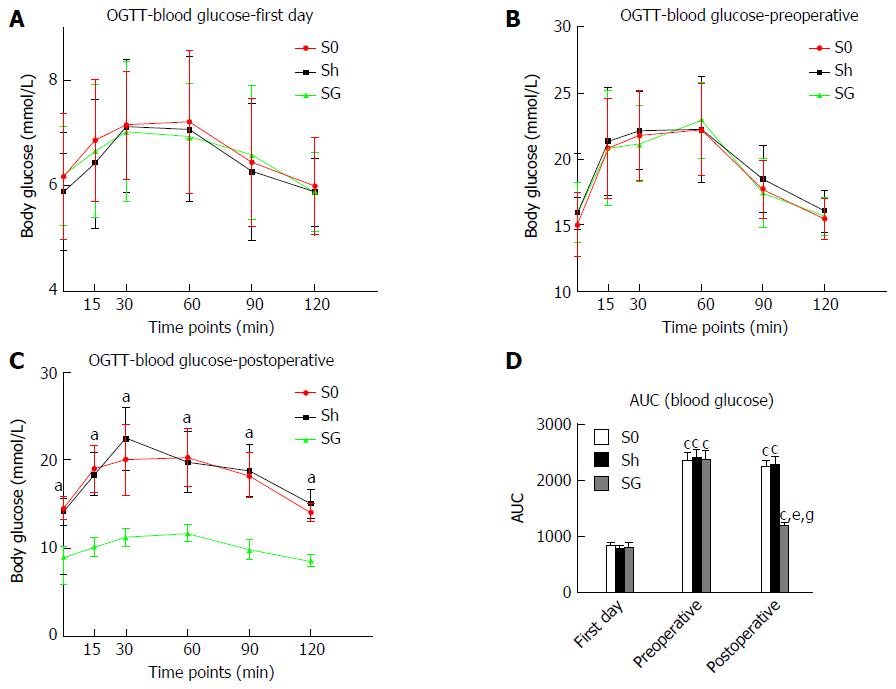
Blood glucose and AUC-glucose: Blood glucose levels of the S0, Sh and SG groups did not differ among all the time points at the first day but significantly increased as rats became obese. Blood glucose levels and AUC-glucose in the SG group significantly decreased after surgery and were significantly lower than in the S0 and Sh groups (Figure 4 and Table 2).
| Time points (min) | Blood glucose (mmol/L) | ||||||||
| First day | Preoperative | Postoperative | |||||||
| S0 | Sh | SG | S0 | Sh | SG | S0 | Sh | SG | |
| 0 | 6.18 ± 1.19 | 5.89 ± 1.12 | 6.19 ± 0.94 | 15.03 ± 2.40a | 15.90 ± 1.20a | 15.88 ± 2.32a | 14.55 ± 1.29 | 14.29 ± 1.69 | 9.00 ± 1.17ce |
| 15 | 6.18 ± 1.17 | 6.42 ± 1.22 | 6.66 ± 1.27 | 20.82 ± 3.80a | 21.35 ± 4.13a | 20.84 ± 4.41a | 19.06 ± 2.68 | 18.39 ± 2.42 | 10.12 ± 1.07ce |
| 30 | 7.15 ± 1.03 | 7.13 ± 1.27 | 7.03 ± 1.32 | 21.76 ± 3.45a | 22.13 ± 2.96a | 21.15 ± 2.86a | 20.09 ± 4.02 | 22.47 ± 3.63 | 11.21 ± 1.02ce |
| 60 | 7.22 ± 1.36 | 7.07 ± 1.38 | 6.93 ± 1.02 | 22.23 ± 3.47a | 22.23 ± 4.03a | 22.96 ± 2.78a | 20.32 ± 3.26 | 19.80 ± 3.49 | 11.75 ± 0.95ce |
| 90 | 6.45 ± 1.21 | 6.27 ± 1.31 | 6.58 ± 1.31 | 17.72 ± 2.19a | 18.48 ± 2.54a | 17.43 ± 2.61a | 18.30 ± 2.50 | 18.81 ± 2.90 | 8.76 ± 1.01ce |
| 120 | 6.00 ± 0.92 | 5.89 ± 0.65 | 5.58 ± 0.75 | 15.47 ± 1.55a | 15.04 ± 1.58a | 15.67 ± 1.44a | 14.08 ± 1.00 | 15.07 ± 1.63 | 6.98 ± 1.13ce |
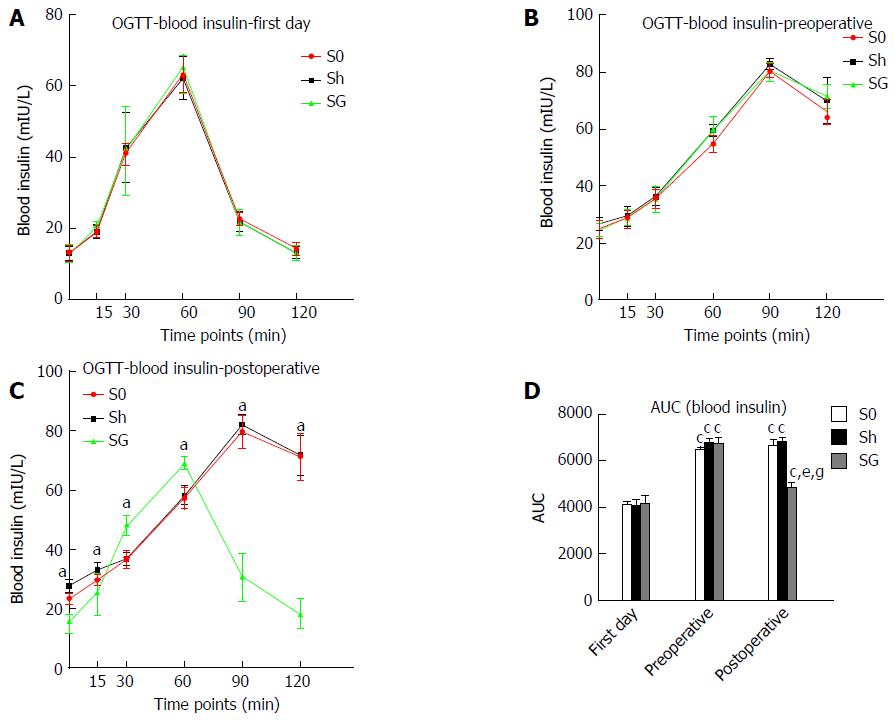
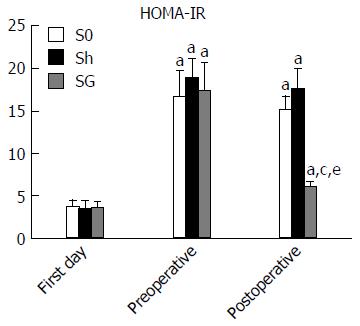
Blood insulin and AUC-insulin: Fasting insulin and maximal insulin were significantly increased, and the maximal insulin excretion time was at the 90th min in all groups after glucose loading at preoperative day 3, while the maximal insulin excretion time was at the 60th min after glucose loading on the first day. Compared with the S0 and Sh groups, the SG group had lower fasting insulin and maximal insulin concentrations. The maximal insulin excretion time in SG rats was at the 60th min again. AUC-glucose and AUC-insulin were increased in all obese model groups and were significantly reduced in the SG group at 8 weeks after surgery. HOMA-IR, which reflects insulin resistance, was also significantly reduced in the SG group (Table 3, Figures 5 and 6).
| Time points (min) | Blood insulin (mU/L) | ||||||||
| First day | Preoperative | Postoperative | |||||||
| S0 | Sh | SG | S0 | Sh | SG | S0 | Sh | SG | |
| 0 | 13.06 ± 2.21 | 13.03 ± 2.01 | 12.97 ± 2.63 | 24.79 ± 3.06a | 26.48 ± 2.19a | 24.37 ± 2.51a | 23.33 ± 1.81 | 27.58 ± 2.24 | 15.21 ± 2.87ce |
| 15 | 19.16 ± 1.57 | 19.04 ± 1.83 | 20.63 ± 1.17 | 28.66 ± 3.20a | 29.38 ± 3.33a | 28.72 ± 2.39a | 29.78 ± 2.86 | 32.95 ± 2.65 | 25.71 ± 7.73ce |
| 30 | 40.90 ± 3.15 | 42.65 ± 9.89 | 41.64 ± 12.51 | 35.47 ± 3.36a | 36.27 ± 3.21a | 35.33 ± 4.68a | 36.49 ± 3.25 | 36.78 ± 2.05 | 47.93 ± 3.31ce |
| 60 | 63.46 ± 5.30 | 62.43 ± 6.01 | 65.38 ± 3.45 | 54.76 ± 2.85a | 59.37 ± 2.12 | 59.81 ± 4.63a | 57.36 ± 3.51 | 58.08 ± 2.77 | 69.05 ± 1.74ce |
| 90 | 22.55 ± 1.80 | 21.81 ± 2.65 | 21.68 ± 3.23 | 80.35 ± 2.42a | 82.68 ± 2.02a | 80.68 ± 4.13a | 79.79 ± 5.66 | 82.14 ± 3.46 | 30.55 ± 7.66ce |
| 120 | 14.30 ± 1.82 | 13.25 ± 1.67 | 13.14 ± 2.02 | 66.15 ± 4.38a | 70.11 ± 8.05a | 71.52 ± 4.20a | 71.26 ± 7.88 | 71.76 ± 6.63 | 18.23 ± 4.95ce |
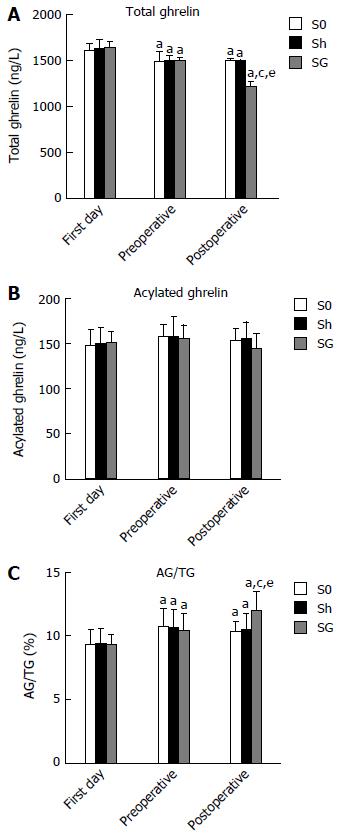
The obese rats showed a lower serum TG level and no change in AG, but the ratio of AG/TG was increased. When compared with the S0 and Sh groups, the SG group showed decreased TG (1482.03 ± 26.55, 1481.49 ± 23.30 and 1206.63 ± 52.02 ng/L, respectively, P < 0.05) but unchanged AG (153.06 ± 13.74, 155.37 ± 19.30 and 144.44 ± 16.689 ng/L, respectively, P > 0.05). As a result, the ratio of AG/TG was further increased in the SG group (0.103 ± 0.009, 0.105 ± 0.013 and 0.12 ± 0.016, respectively, P < 0.05) (Figure 7).
The mRNA expression levels of preproghrelin and GOAT were lower in the SG group than in the S0 group, while NPY mRNA expression did not differ between groups (Table 4).
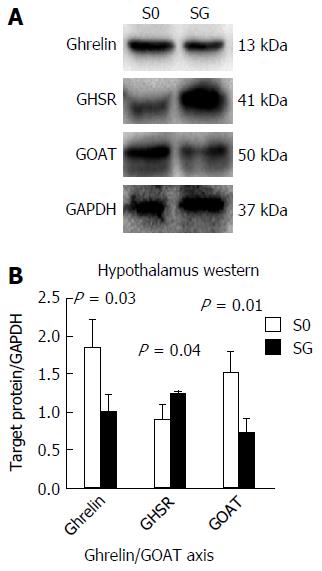
Ghrelin and GOAT protein expression was significantly reduced in SG rats, while the level of GHSR protein expression was increased (Figure 8).
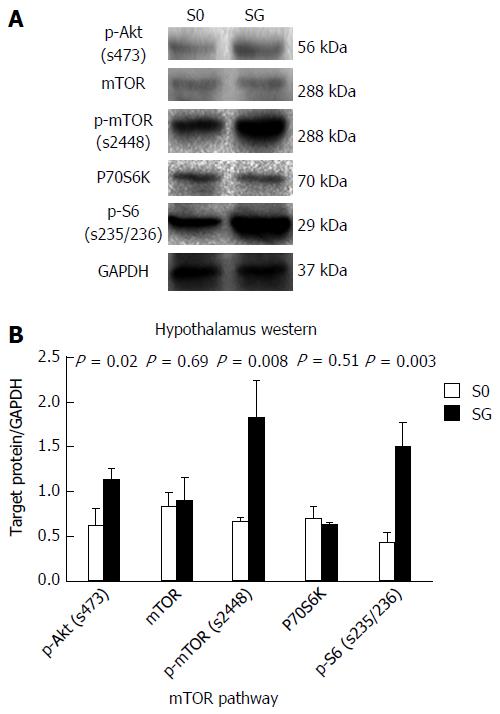
The levels of p-Akt, p-mTOR and p-S6 protein expression were higher in the SG group, while the protein expression levels of mTOR and P70S6K did not differ between the Sh and SG groups (Figure 9).
As a bariatric surgery, SG can not only significantly reduce body weight but also effectively improve T2DM and obesity-induced metabolic complications[1]. More and more surgeons worldwide choose SG, especially in Asia, because of the less difficulty and complications of SG when compared with other bariatric surgeries. As the number of SGs is increasing, the surgeons’ viewpoint of SG changes from bariatric surgery to metabolic surgery. However, when compared with Roux-en-Y gastric bypass (RYGB), which is regarded as the “gold standard” in metabolic surgery, the effect of SG on improving metabolic symptoms and weight loss is seemingly imperfect[22-24]. Weight and blood glucose regain is still the most disputed problem after SG. Our data showed that body mass, food intake, fasting blood glucose, postprandial blood glucose, AUC-glucose, AUC-insulin and HOMA-IR were significantly reduced after SG. However, the body mass levels at postoperative week 8 were comparable to the preoperative level. Remarkably, hyperglycemia and insulin resistance were significantly improved. The mechanism of SG is still unclear; the most important mechanisms are believed to be the restriction of calories and the complex hormonal changes. One of these hormonal changes include the markedly reduced ghrelin levels after removal of the gastric fundus.
Previous studies demonstrated that low plasma ghrelin levels are beneficial in elevating fasting insulin levels and improving hyperglycemia, insulin resistance and obesity, while higher levels of ghrelin inhibit insulin release in the pancreas and enhance the food intake signals in the hypothalamus[25,26]. Furthermore, ghrelin gene knock-out mice had lower blood glucose and higher blood insulin levels[5]. As one of the two existing forms of ghrelin in the body, AG is commonly considered the active form due to its “negative” effect on blood glucose metabolism and positive effect on food intake signals in the hypothalamus[27,28], whereas UAG can antagonize AG’s effects[29-31]. Recent studies found that obese individuals have lower blood ghrelin levels but no change in serum AG levels or the ratio of AG/UAG. SG can further reduce serum UAG but not AG levels and increase the ratio of AG/UAG[32]. Our data demonstrated that the level of TG was significantly decreased in obese rats; however, AG levels were unchanged and the ratio of AG/TG was increased. As shown in Figure 7, SG can further reduce the serum TG levels after SG-induced resection of the gastric fundus. However, AG was still not changed, but the ratio of AG/TG was further increased. Since SG can only reduce the levels of serum TG or UAG, it is unclear how SG can improve obesity and T2DM with increasing ratios of AG/TG or AG/UAG. Previous studies mentioned that ghrelin secretion depends on a specific secretion cue related to fasting and feeding[33], which should be abolished by SG. However, ours and other studies did not confirm whether SG really abolished ghrelin’s special cyclic secretion. We propose that altered ghrelin secretion cues might be more important than plasma TG, AG or UAG in SG-induced improvement of obesity and metabolic symptoms.
AS is required for active ghrelin to bind with and activate its receptor; GOAT is essential for octanoylation of ghrelin[34]. A number of studies demonstrated that GOAT mainly exists in tissues that play an important role in the regulation of food intake, blood glucose metabolism and energy homeostasis, such as the stomach, hypothalamus and pancreas[8]. However, the relationship between GOAT expression and energy homeostasis is inconsistent. Gonzalez[35] found that a 30% food reduction for 21 d increased GOAT expression in the gastric mucosa, while a 48-h fasting period had no effect on GOAT expression in rats. On the contrary, other studies reported that GOAT expression was decreased after food restriction[36,37]. Body energy level is not the only factor determining GOAT expression. Gahete et al[8] found that AG could increase GOAT expression in the stomach, whereas insulin inhibited the expression of GOAT mRNA via the mTOR pathway[3]. In our study, both mRNA and protein expression levels of ghrelin and GOAT significantly decreased after SG, while GHSR protein expression significantly increased. As mentioned above, this phenomenon may be related to the abolishment of ghrelin’s special cyclic secretion. The “override inhibition” theory[38] describes a phenomenon in which hormones, normally secreted in response to an episodic stimulus, are paradoxically inhibited when that stimulus occurs continuously. Therefore, SG may eliminate the periodic effect of cyclic ghrelin on the hypothalamus, resulting in a reduced expression level of preproghrelin mRNA and ghrelin protein, as well as a GHSR compensatory increase. The reduction of GOAT mRNA and protein may be due to a local ghrelin decrease and energy deprivation after SG. Although ghrelin was significantly decreased, the level of NPY mRNA expression in SG rats did not change, which may be related to the activation of the mTOR pathway in the negative energy balance of the hypothalamus after SG.
Several studies have shown that the hypothalamic mTOR pathway plays a major role in the regulation of energy homeostasis and food intake[6]. A recent study demonstrated that energy deprivation and administration of ghrelin into the 4th ventricle led to increased levels of p-mTOR and increased NPY mRNA expression and promoted feeding through the activation of the hypothalamic mTOR pathway. Moreover, rapamycin could significantly inhibit mTOR activity and reduce food intake[6,17]. Our data suggest that SG can significantly increase the protein levels of p-Akt, p-mTOR and p-S6 in the hypothalamus. As a classic restrictive metabolic surgery, it is possible that SG first reduces the calorie intake, which then activates the mTOR pathway. Therefore, the activation of the mTOR pathway may be the reason for the increased NPY level after SG.
One of the limitations of our study is that we did not compare SG with other restrictive metabolic surgeries. Kawasaki et al[21] found no difference in hypothalamic mRNA expression of NPY between normally fed rats and SG rats. However, when compared with gastric banding rats, the NPY mRNA expression in SG rats was significantly lower. The reduction of ghrelin expression and activation of the mTOR pathway might have an opposite effect on food intake after SG.
Overall, altered glucose metabolism and food intake changes following SG should be divided into peripheral and central changes. In the periphery, SG can significantly reduce food intake by decreasing gastric volume and changing blood ghrelin levels. Further studies should focus on how SG changes ghrelin’s special cyclic secretion, especially AG’s. In the center, as mentioned above, we found two opposite factors for the regulation of food intake. A recent study has shown that a residual stomach expansion occurred in more than 50% of the SG patients over a short-term period[39,40]. Increased food intake may be the most important factor for the residual stomach expansion. The results of our study provide a clue for further studies on SG and its regulation of food intake from a central point of view.
Sleeve gastrectomy (SG), which is a classic restrictive metabolic surgery, becomes more and more popular worldwide because of its less difficulty and complications. However, weight and blood glucose regain is still the most disputed problems after SG. Increasing food intake might be the most important reason for these problems.
This study aimed to examine the changes of the ghrelin/ghrelin O-acyltransferase (GOAT) axis and the mammalian target of rapamycin (mTOR) pathway in the hypothalamus after SG. These changes provide a clue for further studies on SG and its regulation of food intake from a central point of view.
The authors compared between SG rats and non-operation rats in ghrelin/GOAT axis and the mTOR pathway in the hypothalamus, and found that SG could suppress mRNA and protein levels of preproghrelin and GOAT but did not change neuropeptide Y mRNA expression. The protein levels of p-Akt, p-mTOR and p-S6 were higher in the SG group, which indicates that the hypothalamic mTOR pathway was activated after SG on the postoperative week 8.
The findings in this study suggest that patients who underwent SG still need to control food intake for better improvement of obesity and glucose metabolism.
SG is a novel procedure of metabolic surgery to remove at least 70% of stomach from the greater curvature. Ghrelin, mainly found in the stomach, could increase food intake and should be inhibited after SG. GOAT is essential for transforming unacylated ghrelin to acylated ghrelin. The mTOR pathway has an important and complex impact on several cellular functions, such as cell growth, weight loss, food intake and even insulin resistance
The authors examined changes of the ghrelin/GOAT axis and the mTor pathway in the hypothalamus after SG. This is a carefully done study and the findings are of considerable interest.
Manuscript source: Unsolicited manuscript
Specialty type: Gastroenterology and hepatology
Country of origin: China
Peer-review report classification
Grade A (Excellent): 0
Grade B (Very good): B
Grade C (Good): 0
Grade D (Fair): 0
Grade E (Poor): 0
P- Reviewer: Kimura A S- Editor: Ma YJ L- Editor: Ma JY E- Editor: Zhang FF
| 1. | Lee WJ, Almulaifi A. Recent advances in bariatric/metabolic surgery: appraisal of clinical evidence. J Biomed Res. 2015;29:98-104. [RCA] [PubMed] [DOI] [Full Text] [Full Text (PDF)] [Cited by in Crossref: 18] [Cited by in RCA: 10] [Article Influence: 1.0] [Reference Citation Analysis (0)] |
| 2. | Granata R, Baragli A, Settanni F, Scarlatti F, Ghigo E. Unraveling the role of the ghrelin gene peptides in the endocrine pancreas. J Mol Endocrinol. 2010;45:107-118. [RCA] [PubMed] [DOI] [Full Text] [Cited by in Crossref: 69] [Cited by in RCA: 67] [Article Influence: 4.5] [Reference Citation Analysis (0)] |
| 3. | An W, Li Y, Xu G, Zhao J, Xiang X, Ding L, Li J, Guan Y, Wang X, Tang C. Modulation of ghrelin O-acyltransferase expression in pancreatic islets. Cell Physiol Biochem. 2010;26:707-716. [RCA] [PubMed] [DOI] [Full Text] [Cited by in Crossref: 36] [Cited by in RCA: 39] [Article Influence: 2.6] [Reference Citation Analysis (0)] |
| 4. | Folgueira C, Seoane LM, Casanueva FF. The brain-stomach connection. Front Horm Res. 2014;42:83-92. [RCA] [PubMed] [DOI] [Full Text] [Cited by in Crossref: 18] [Cited by in RCA: 25] [Article Influence: 2.3] [Reference Citation Analysis (0)] |
| 5. | Sun Y, Asnicar M, Smith RG. Central and peripheral roles of ghrelin on glucose homeostasis. Neuroendocrinology. 2007;86:215-228. [RCA] [PubMed] [DOI] [Full Text] [Cited by in Crossref: 72] [Cited by in RCA: 75] [Article Influence: 4.2] [Reference Citation Analysis (0)] |
| 6. | Martins L, Fernández-Mallo D, Novelle MG, Vázquez MJ, Tena-Sempere M, Nogueiras R, López M, Diéguez C. Hypothalamic mTOR signaling mediates the orexigenic action of ghrelin. PLoS One. 2012;7:e46923. [RCA] [PubMed] [DOI] [Full Text] [Full Text (PDF)] [Cited by in Crossref: 83] [Cited by in RCA: 91] [Article Influence: 7.0] [Reference Citation Analysis (0)] |
| 7. | Gualillo O, Lago F, Dieguez C. Introducing GOAT: a target for obesity and anti-diabetic drugs? Trends Pharmacol Sci. 2008;29:398-401. [RCA] [PubMed] [DOI] [Full Text] [Cited by in Crossref: 45] [Cited by in RCA: 50] [Article Influence: 2.9] [Reference Citation Analysis (0)] |
| 8. | Gahete MD, Córdoba-Chacón J, Salvatori R, Castaño JP, Kineman RD, Luque RM. Metabolic regulation of ghrelin O-acyl transferase (GOAT) expression in the mouse hypothalamus, pituitary, and stomach. Mol Cell Endocrinol. 2010;317:154-160. [RCA] [PubMed] [DOI] [Full Text] [Cited by in Crossref: 89] [Cited by in RCA: 98] [Article Influence: 6.5] [Reference Citation Analysis (0)] |
| 9. | Lim CT, Kola B, Grossman A, Korbonits M. The expression of ghrelin O-acyltransferase (GOAT) in human tissues. Endocr J. 2011;58:707-710. [RCA] [PubMed] [DOI] [Full Text] [Cited by in Crossref: 62] [Cited by in RCA: 71] [Article Influence: 5.1] [Reference Citation Analysis (0)] |
| 10. | Kouno T, Akiyama N, Ito T, Okuda T, Nanchi I, Notoya M, Oka S, Yukioka H. Ghrelin O-acyltransferase knockout mice show resistance to obesity when fed high-sucrose diet. J Endocrinol. 2016;228:115-125. [RCA] [PubMed] [DOI] [Full Text] [Cited by in Crossref: 22] [Cited by in RCA: 21] [Article Influence: 2.3] [Reference Citation Analysis (0)] |
| 11. | Trivedi A, Babic S, Heiman M, Gibson WT, Chanoine JP. Ghrelin, Ghrelin O-Acyltransferase, and Carbohydrate Metabolism During Pregnancy in Calorie-Restricted Mice. Horm Metab Res. 2017;49:64-72. [RCA] [PubMed] [DOI] [Full Text] [Cited by in Crossref: 2] [Cited by in RCA: 5] [Article Influence: 0.6] [Reference Citation Analysis (0)] |
| 12. | Cota D, Matter EK, Woods SC, Seeley RJ. The role of hypothalamic mammalian target of rapamycin complex 1 signaling in diet-induced obesity. J Neurosci. 2008;28:7202-7208. [RCA] [PubMed] [DOI] [Full Text] [Full Text (PDF)] [Cited by in Crossref: 160] [Cited by in RCA: 150] [Article Influence: 8.8] [Reference Citation Analysis (0)] |
| 13. | Haissaguerre M, Saucisse N, Cota D. Influence of mTOR in energy and metabolic homeostasis. Mol Cell Endocrinol. 2014;397:67-77. [RCA] [PubMed] [DOI] [Full Text] [Cited by in Crossref: 78] [Cited by in RCA: 85] [Article Influence: 7.7] [Reference Citation Analysis (0)] |
| 14. | Yoon MS, Choi CS. The role of amino acid-induced mammalian target of rapamycin complex 1(mTORC1) signaling in insulin resistance. Exp Mol Med. 2016;48:e201. [RCA] [PubMed] [DOI] [Full Text] [Full Text (PDF)] [Cited by in Crossref: 26] [Cited by in RCA: 36] [Article Influence: 4.0] [Reference Citation Analysis (0)] |
| 15. | Cota D, Proulx K, Smith KA, Kozma SC, Thomas G, Woods SC, Seeley RJ. Hypothalamic mTOR signaling regulates food intake. Science. 2006;312:927-930. [RCA] [PubMed] [DOI] [Full Text] [Cited by in Crossref: 914] [Cited by in RCA: 946] [Article Influence: 49.8] [Reference Citation Analysis (0)] |
| 16. | Takei N, Furukawa K, Hanyu O, Sone H, Nawa H. A possible link between BDNF and mTOR in control of food intake. Front Psychol. 2014;5:1093. [RCA] [PubMed] [DOI] [Full Text] [Full Text (PDF)] [Cited by in Crossref: 40] [Cited by in RCA: 47] [Article Influence: 4.3] [Reference Citation Analysis (0)] |
| 17. | Zhang W, Zhang C, Fritze D, Chai B, Li J, Mulholland MW. Modulation of food intake by mTOR signalling in the dorsal motor nucleus of the vagus in male rats: focus on ghrelin and nesfatin-1. Exp Physiol. 2013;98:1696-1704. [RCA] [PubMed] [DOI] [Full Text] [Cited by in Crossref: 27] [Cited by in RCA: 27] [Article Influence: 2.3] [Reference Citation Analysis (0)] |
| 18. | Fedonidis C, Alexakis N, Koliou X, Asimaki O, Tsirimonaki E, Mangoura D. Long-term changes in the ghrelin-CB1R axis associated with the maintenance of lower body weight after sleeve gastrectomy. Nutr Diabetes. 2014;4:e127. [RCA] [PubMed] [DOI] [Full Text] [Full Text (PDF)] [Cited by in Crossref: 13] [Cited by in RCA: 13] [Article Influence: 1.2] [Reference Citation Analysis (0)] |
| 19. | Qiu NC, Zhang Q, Song X, Liu ME, Li XK, Shan CX, Qiu M. Impact of the hepatic branch of the vagus and Roux-en-Y gastric bypass on the hypoglycemic effect and glucagon-like peptide-1 in rats with type 2 diabetes mellitus. J Surg Res. 2014;191:123-129. [RCA] [PubMed] [DOI] [Full Text] [Cited by in Crossref: 11] [Cited by in RCA: 11] [Article Influence: 1.0] [Reference Citation Analysis (0)] |
| 20. | Zhong MW, Liu SZ, Zhang GY, Zhang X, Hu SY. Effects of sleeve gastrectomy with jejuno-jejunal or jejuno-ileal loop on glycolipid metabolism in diabetic rats. World J Gastroenterol. 2016;22:7332-7341. [RCA] [PubMed] [DOI] [Full Text] [Full Text (PDF)] [Cited by in CrossRef: 6] [Cited by in RCA: 6] [Article Influence: 0.7] [Reference Citation Analysis (0)] |
| 21. | Kawasaki T, Ohta M, Kawano Y, Masuda T, Gotoh K, Inomata M, Kitano S. Effects of sleeve gastrectomy and gastric banding on the hypothalamic feeding center in an obese rat model. Surg Today. 2015;45:1560-1566. [RCA] [PubMed] [DOI] [Full Text] [Cited by in Crossref: 21] [Cited by in RCA: 17] [Article Influence: 1.7] [Reference Citation Analysis (0)] |
| 22. | Rosenthal RJ; International Sleeve Gastrectomy Expert Panel, Diaz AA, Arvidsson D, Baker RS, Basso N, Bellanger D, Boza C, El Mourad H, France M, Gagner M, Galvao-Neto M, Higa KD, Himpens J, Hutchinson CM, Jacobs M, Jorgensen JO, Jossart G, Lakdawala M, Nguyen NT, Nocca D, Prager G, Pomp A, Ramos AC, Rosenthal RJ, Shah S, Vix M, Wittgrove A, Zundel N. International Sleeve Gastrectomy Expert Panel Consensus Statement: best practice guidelines based on experience of &gt;12,000 cases. Surg Obes Relat Dis. 2012;8:8-19. [RCA] [PubMed] [DOI] [Full Text] [Cited by in Crossref: 713] [Cited by in RCA: 713] [Article Influence: 50.9] [Reference Citation Analysis (0)] |
| 23. | Quan Y, Huang A, Ye M, Xu M, Zhuang B, Zhang P, Yu B, Min Z. Efficacy of Laparoscopic Mini Gastric Bypass for Obesity and Type 2 Diabetes Mellitus: A Systematic Review and Meta-Analysis. Gastroenterol Res Pract. 2015;2015:152852. [RCA] [PubMed] [DOI] [Full Text] [Full Text (PDF)] [Cited by in Crossref: 56] [Cited by in RCA: 53] [Article Influence: 5.3] [Reference Citation Analysis (0)] |
| 24. | Zhang Y, Wang J, Sun X, Cao Z, Xu X, Liu D, Xin X, Qin M. Laparoscopic sleeve gastrectomy versus laparoscopic Roux-en-Y gastric bypass for morbid obesity and related comorbidities: a meta-analysis of 21 studies. Obes Surg. 2015;25:19-26. [RCA] [PubMed] [DOI] [Full Text] [Cited by in Crossref: 105] [Cited by in RCA: 100] [Article Influence: 10.0] [Reference Citation Analysis (0)] |
| 25. | Yada T, Dezaki K, Sone H, Koizumi M, Damdindorj B, Nakata M, Kakei M. Ghrelin regulates insulin release and glycemia: physiological role and therapeutic potential. Curr Diabetes Rev. 2008;4:18-23. [RCA] [PubMed] [DOI] [Full Text] [Cited by in Crossref: 65] [Cited by in RCA: 64] [Article Influence: 3.8] [Reference Citation Analysis (0)] |
| 26. | Dezaki K, Sone H, Yada T. Ghrelin is a physiological regulator of insulin release in pancreatic islets and glucose homeostasis. Pharmacol Ther. 2008;118:239-249. [RCA] [PubMed] [DOI] [Full Text] [Cited by in Crossref: 104] [Cited by in RCA: 111] [Article Influence: 6.5] [Reference Citation Analysis (0)] |
| 27. | Khatib N, Gaidhane S, Gaidhane AM, Khatib M, Simkhada P, Gode D, Zahiruddin QS. Ghrelin: ghrelin as a regulatory Peptide in growth hormone secretion. J Clin Diagn Res. 2014;8:MC13-MC17. [RCA] [PubMed] [DOI] [Full Text] [Cited by in Crossref: 18] [Cited by in RCA: 36] [Article Influence: 3.3] [Reference Citation Analysis (0)] |
| 28. | Chen CY, Asakawa A, Fujimiya M, Lee SD, Inui A. Ghrelin gene products and the regulation of food intake and gut motility. Pharmacol Rev. 2009;61:430-481. [RCA] [PubMed] [DOI] [Full Text] [Cited by in Crossref: 181] [Cited by in RCA: 170] [Article Influence: 10.6] [Reference Citation Analysis (0)] |
| 29. | Chen CY, Inui A, Asakawa A, Fujino K, Kato I, Chen CC, Ueno N, Fujimiya M. Des-acyl ghrelin acts by CRF type 2 receptors to disrupt fasted stomach motility in conscious rats. Gastroenterology. 2005;129:8-25. [RCA] [PubMed] [DOI] [Full Text] [Cited by in Crossref: 175] [Cited by in RCA: 181] [Article Influence: 9.1] [Reference Citation Analysis (0)] |
| 30. | Pacifico L, Poggiogalle E, Costantino F, Anania C, Ferraro F, Chiarelli F, Chiesa C. Acylated and nonacylated ghrelin levels and their associations with insulin resistance in obese and normal weight children with metabolic syndrome. Eur J Endocrinol. 2009;161:861-870. [RCA] [PubMed] [DOI] [Full Text] [Cited by in Crossref: 70] [Cited by in RCA: 75] [Article Influence: 4.7] [Reference Citation Analysis (0)] |
| 31. | Kumar R, Salehi A, Rehfeld JF, Höglund P, Lindström E, Håkanson R. Proghrelin peptides: Desacyl ghrelin is a powerful inhibitor of acylated ghrelin, likely to impair physiological effects of acyl ghrelin but not of obestatin A study of pancreatic polypeptide secretion from mouse islets. Regul Pept. 2010;164:65-70. [RCA] [PubMed] [DOI] [Full Text] [Cited by in Crossref: 28] [Cited by in RCA: 32] [Article Influence: 2.1] [Reference Citation Analysis (0)] |
| 32. | Ezquerro S, Méndez-Giménez L, Becerril S, Moncada R, Valentí V, Catalán V, Gómez-Ambrosi J, Frühbeck G, Rodríguez A. Acylated and desacyl ghrelin are associated with hepatic lipogenesis, β-oxidation and autophagy: role in NAFLD amelioration after sleeve gastrectomy in obese rats. Sci Rep. 2016;6:39942. [RCA] [PubMed] [DOI] [Full Text] [Full Text (PDF)] [Cited by in Crossref: 37] [Cited by in RCA: 49] [Article Influence: 5.4] [Reference Citation Analysis (0)] |
| 33. | Spiegel K, Tasali E, Leproult R, Scherberg N, Van Cauter E. Twenty-four-hour profiles of acylated and total ghrelin: relationship with glucose levels and impact of time of day and sleep. J Clin Endocrinol Metab. 2011;96:486-493. [RCA] [PubMed] [DOI] [Full Text] [Cited by in Crossref: 83] [Cited by in RCA: 76] [Article Influence: 5.4] [Reference Citation Analysis (0)] |
| 34. | Li Z, Mulholland M, Zhang W. Ghrelin O-acyltransferase (GOAT) and energy metabolism. Sci China Life Sci. 2016;59:281-291. [RCA] [PubMed] [DOI] [Full Text] [Cited by in Crossref: 8] [Cited by in RCA: 12] [Article Influence: 1.3] [Reference Citation Analysis (0)] |
| 35. | González CR, Vázquez MJ, López M, Diéguez C. Influence of chronic undernutrition and leptin on GOAT mRNA levels in rat stomach mucosa. J Mol Endocrinol. 2008;41:415-421. [RCA] [PubMed] [DOI] [Full Text] [Cited by in Crossref: 61] [Cited by in RCA: 67] [Article Influence: 3.9] [Reference Citation Analysis (0)] |
| 36. | Reimer RA, Maurer AD, Lau DC, Auer RN. Long-term dietary restriction influences plasma ghrelin and GOAT mRNA level in rats. Physiol Behav. 2010;99:605-610. [RCA] [PubMed] [DOI] [Full Text] [Full Text (PDF)] [Cited by in Crossref: 24] [Cited by in RCA: 24] [Article Influence: 1.6] [Reference Citation Analysis (0)] |
| 37. | Kirchner H, Gutierrez JA, Solenberg PJ, Pfluger PT, Czyzyk TA, Willency JA, Schürmann A, Joost HG, Jandacek RJ, Hale JE. GOAT links dietary lipids with the endocrine control of energy balance. Nat Med. 2009;15:741-745. [RCA] [PubMed] [DOI] [Full Text] [Full Text (PDF)] [Cited by in Crossref: 315] [Cited by in RCA: 306] [Article Influence: 19.1] [Reference Citation Analysis (0)] |
| 38. | Cummings DE, Overduin J, Shannon MH, Foster-Schubert KE; 2004 ABS Consensus Conference. Hormonal mechanisms of weight loss and diabetes resolution after bariatric surgery. Surg Obes Relat Dis. 2005;1:358-368. [RCA] [PubMed] [DOI] [Full Text] [Cited by in Crossref: 74] [Cited by in RCA: 68] [Article Influence: 3.6] [Reference Citation Analysis (0)] |
| 39. | Disse E, Pasquer A, Pelascini E, Valette PJ, Betry C, Laville M, Gouillat C, Robert M. Dilatation of Sleeve Gastrectomy: Myth or Reality? Obes Surg. 2017;27:30-37. [RCA] [PubMed] [DOI] [Full Text] [Cited by in Crossref: 25] [Cited by in RCA: 29] [Article Influence: 3.6] [Reference Citation Analysis (0)] |
| 40. | Ferrer-Márquez M, García-Díaz JJ, Moreno-Serrano A, García-Díez JM, Ferrer-Ayza M, Alarcón-Rodríguez R, Artero EG, Soriano-Maldonado A. Changes in Gastric Volume and Their Implications for Weight Loss after Laparoscopic Sleeve Gastrectomy. Obes Surg. 2017;27:303-309. [RCA] [PubMed] [DOI] [Full Text] [Cited by in Crossref: 17] [Cited by in RCA: 21] [Article Influence: 2.6] [Reference Citation Analysis (0)] |


