Published online Aug 7, 2016. doi: 10.3748/wjg.v22.i29.6690
Peer-review started: May 12, 2015
First decision: September 9, 2015
Revised: April 1, 2016
Accepted: May 4, 2016
Article in press: May 4, 2016
Published online: August 7, 2016
Processing time: 445 Days and 12.6 Hours
AIM: To explore the feasibility of using hypericin as an optical imaging probe with affinity for cholesterol for differential fluorescent detection of human gallstones.
METHODS: Cholesterol, mixed and pigment stones from cholecystectomy patients were incubated with hypericin or solvent. After 72 h, the stones were analysed for fluorescence (365 nm) and treated with 2-propanol/dimethyl sulfoxide for high performance liquid chromatography (HPLC) analysis. Rats with virtual gallbladder containing human cholesterol, mixed or pigment gallstones (VGHG) received 5 mg/kg hypericin or solvent and VGHG rats with cholesterol stones were given different hypericin doses (5-15 mg/kg). Twelve hours later, the stones were analysed at 365 nm. Biliary excretion and metabolites of hypericin were assessed in common bile duct (CBD) cannulated rats for 9 h using fluorospectrometry, HPLC and matrix-assisted laser desorption/ionization-time-of-flight mass spectrometry (MALDI-TOF MS).
RESULTS: Homogeneous high fluorescence was seen on cholesterol stones either pre-incubated with hypericin or extracted from VGHG rats receiving hypericin. Mixed stones showed a dotted fluorescent pattern, whereas pigment and solvent-treated ones lacked fluorescence. HPLC showed 7.68, 6.65 and 0.08 × 10⁻³ M of cholesterol in extracts from cholesterol, mixed, and pigment gallstones, respectively. Hypericin accounted for 2.0, 0.5 and 0.2 × 10⁻⁶ M in that order. On cholesterol stones from VGHG rats receiving different hypericin doses, a positive correlation was observed between dose and fluorescence. In the bile from CBD-cannulated rats, fluorescence represented 20% of the injected dose with two peaks in 9 h. HPLC analysis revealed that hypericin conjugates reached 60% of the peak area. By MALDI-TOF MS, hypericin-glucuronide was detected.
CONCLUSION: This study proves the potential use of hypericin for differential fluorescent detection of human gallstones regarding their chemical composition.
Core tip: Cholelithiasis refers to cholesterol, mixed and pigment gallstones in the gallbladder. Although the current diagnostic methods may detect their presence in the biliary system, none of them may offer an in situ differential diagnosis of gallstones regarding their chemical composition. Hypericin is a fluorophore plant pigment tending to bind membrane lipids and is excreted via bile. Because cholesterol is likely the target that hypericin binds, hypericin could become a potential optical imaging agent for differential fluorescent detection of gallstones. Such imaging procedures would allow identifying the origin, composition and formation of gallstones in patients and permit adopting strategies to minimize cholelithiasis recurrence.
- Citation: Miranda Cona M, Liu YW, Hubert A, Yin T, Feng YB, de Witte P, Waelkens E, Jiang YS, Zhang J, Mulier S, Xia Q, Huang G, Oyen R, Ni YC. Differential diagnosis of gallstones by using hypericin as a fluorescent optical imaging agent. World J Gastroenterol 2016; 22(29): 6690-6705
- URL: https://www.wjgnet.com/1007-9327/full/v22/i29/6690.htm
- DOI: https://dx.doi.org/10.3748/wjg.v22.i29.6690
Hypericin is a pigment originated from the Hypericum perforatum (St. John’s Wort) plant and has been used as an herbal medicine due to its biological properties[1-3]. Recently, hypericin has been identified as a potent necrosis avid agent with numerous medical applications[4,5]. Several mechanisms underlying its necrosis avidity have been proposed. Exposed sites of degraded life molecules present in necrotic cell remnants[6], albumins[7] and low-density lipoproteins (LDL)[8] have been suggested as the targets of hypericin. Its affinity for lipid components such as cholesterol, phosphatidylethanolamine (PE) and phosphatidylserine (PS) from cell membrane bilayer has been reported[9,10].
Cholelithiasis is a common abdominal disorder worldwide[11-13] and refers to the presence of gallstones in the gallbladder. Cholelithiasis can cause acute gallbladder inflammation and infection by intestinal bacteria with symptoms of pain, jaundice and fever[14,15]. Gallstones are bile concretions that can differ in size, pathogenesis and composition, and are caused by the precipitation of cholesterol, bilirubin and cholates (or bile salts)[11]. According to the published classification system based on their compositions[16], gallstones can be divided into cholesterol stones (having ≥ 70% of cholesterol); mixed stones comprising palmitate phosphate, calcium carbonate, bilirubin and other bile compounds (30%-69% of cholesterol); and pigment stones consisting of bilirubin and calcium salts (< 30% of cholesterol)[17,18].
Among diagnostic methods for gallbladder diseases including cholelithiasis are interventional approaches such as duodenal drainage, endoscopic ultrasonography and endoscopic retrograde cholangiopancreatography (ERCP) as well as noninvasive sonography, cholescintigraphy, oral cholecystogram, intravenous cholangiogram (IVC), computed tomography (CT), magnetic resonance cholangiopancreatography (MRCP) and blood tests[18-20]. Although these techniques may help to find the presence of gallstones, thickening of the gallbladder wall, pericholecystic fluid and occurrence of ductal obstruction, none of them can offer a differential diagnosis of gallstones regarding their chemical composition[18]. However, if available, such imaging procedures would be of added value for identifying the origin of gallstone formation in a given patient and consequently allow adopting preventive strategies for minimizing cholelithiasis recurrence.
It was during the mechanism studies of hypericin affinity that this new imaging procedure for differential diagnosis of gallstones has been explored. Hypericin is known to bind to membrane lipids[9,21], be strongly fluorescent, and be mainly excreted into the bile[22]. We therefore hypothesized that: (1) cholesterol is most likely the target lipid that hypericin binds; and (2) hypericin could be a potential optical imaging agent for differential fluorescent detection of gallstones in clinic. Indeed, hypericin is a polycyclic aromatic naphthodianthrone with excellent fluorophore properties including high brightness and photostability. When it absorbs external energy from an electromagnetic radiation in the range from 300 to 400 nm, it fluoresces in the orange-red region between 600 and 650 nm[23,24], making it a good candidate for optical imaging.
To test these hypotheses, we evaluated the interaction of hypericin with gallstones derived from patients subjected to cholecystectomy. In vitro studies were done by testing the affinity of hypericin with cholesterol, mixed and pigment gallstones. To quantify the amount of cholesterol and hypericin in the stones, two chromatographic methods were developed and validated. For the suitability of hypericin in differential detection of gallstones, in vivo experiments were conducted in an animal model of cholelithiasis[25]. To better understand in which form hypericin is present in the bile for interacting with the gallstones, the hepatobiliary pathway of hypericin and its metabolites in the bile were studied in rats with common bile duct (CBD) drainage.
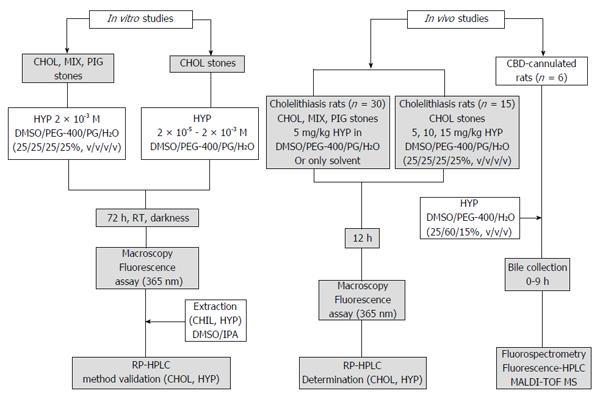
The experimental procedures included in this paper are shown in Figure 1.
Cholesterol, 3β-hydroxy-5-cholestene (purity ≥ 99%) was purchased from Sigma-Aldrich (United States). Hypericin (1,3,4,6,8,13-hexahydroxy-10,11-dimethylphenanthro [1,10,9,8-opqra]perylene-7,14-dione, purity ≥ 98%) was obtained from Planta Natural Products (Austria; http://www.planta.at/hyper/hyper.htm). The solvents were Ph. Eur reagent grade and acquired from commercial sources. For solubilization, hypericin was dissolved in dimethyl sulfoxide (DMSO)/polyethylene glycol-400 (PEG-400)/propylene glycol (PG)/water (H2O) (25%:25%:25%:25%, v/v/v/v).
The experiments were performed using cholesterol, mixed and pigment stones from the gallbladder of cholecystectomy patients (n = 3) at the Department of Abdominal Surgery, Leopold Park Clinic, CHIREC Cancer Institute, Brussels, Belgium.
Preparation of standard solutions: Calibration curves of hypericin and cholesterol were built. From a stock solution of 5.2 × 10⁻² M cholesterol in DMSO/2-propanol (IPA) (50%:50%, v/v), sequential dilutions were performed to obtain standard solutions including 2.6, 5.2, 7.8, 10.3 and 12.9 × 10⁻³ M. For hypericin, a stock solution at 4.0 × 10⁻⁵ M in DMSO/IPA (50%:50%, v/v) was prepared and diluted at the concentrations of 0.6, 1.3, 2.5, 5 and 10 × 10-6 M. A blank of DMSO/IPA (50%:50%, v/v) was included for both compounds. The solutions were assessed by reverse phase (RP)-high performance liquid chromatography (HPLC).
Chromatographic conditions: The chromatographic analysis was done with a Hitachi Elite LaChrom HPLC system (Auckland, New Zealand) equipped with an L-2130 pump and an XTerra C18 reverse-phase analytical column (5.0 μm 4.6 × 150 mm; Waters, United States). The sample injection was made through a Rheodyne Model 7725 injector. The column was eluted with a 30 min-gradient of 10% to 90% acetonitrile in 5.0 mM ammonium acetate pH 7.0 at 1.0 mL/min. For cholesterol, an L-2450 diode array detector at 204 nm was used. With hypericin, an L-2480 fluorescent detector was set with excitation and emission wavelengths of 470 and 600 nm, respectively. Data acquisition and processing were performed with EZChrom Elite version 3.1.6 developed by Scientific Software Inc. The peak areas (PAs) and retention times (RTs) were recorded.
Validation of the chromatographic methods: Two RP-HPLC methods for cholesterol and hypericin were validated, as described in the ICH harmonized tripartite guidelines[26,27]. For assessment of column efficiency, peak symmetry and precision, four replicates of the blank and the five standard solutions of cholesterol and hypericin were used. Column efficiency was reported as the number of theoretical plates (N > 2000)[28]. Peak symmetry was represented as peak asymmetry (As) and tailing factor (TF < 2.0)[28]. Precision was reported as the percentages of the relative standard deviation (%RSD < 1.0) of the PAs and RTs[28]. Accuracy was evaluated by recovery measurements of 2.6 × 10⁻³ M cholesterol and 5.0 × 10⁻⁶ M hypericin at 80%, 100% and 120% levels in triplicate. The recovery percentages and %RSD values were determined[29].
Calibration curve preparation: To build the standard curves of cholesterol and hypericin, the RP-HPLC-peak areas on Y-axis and the concentration of the blank and the five standard solutions on X-axis were plotted and fit to a straight line, using linear regression analysis[27]. The slope, Y-intercept, regression equation and regression coefficient (R2) of the calibration curves were determined. The limits of detection (LOD) and the limits of quantification (LOQ) were calculated based on the slope of the corresponding calibration curves and the standard deviations of their responses[28,29].
Analysis of cholesterol, mixed and pigment stones pre-incubated with hypericin: Cholesterol, mixed and pigment stones were incubated with 2 × 10⁻³ M hypericin or only with the solvent. Hypericin non-treated gallstones were set as controls. After 72 h of incubation, the stones were rinsed with distilled water and dried using paper towels. They were photographed (Canon Digital IXUS 860 IS, Japan) in a CN-15 darkroom cabinet (Vilber Lourmat Deutschland GmbH, Eberhardzell, Germany) under white light and at an excitation wavelength of 365 nm for assessment of physical and fluorescent properties, respectively.
For cholesterol and hypericin quantification, the stones were separately crushed with an agate mortar. Ten mg of each type of powdered stone was treated with 3.0 mL of DMSO/IPA (50%:50%, v/v) under stirring for 1 h, at room temperature under dim-light. The samples were centrifuged for 5 min at 5000 rpm at 4 °C. Aliquots from the supernatants were analyzed by RP-HPLC, as described in section 2.3.2. The percentage of cholesterol in each type of stone was estimated. The concentrations of cholesterol and hypericin in the DMSO/IPA extracts were determined from the regression equation of their corresponding calibration curves.
Interaction of cholesterol stones with hypericin at different concentrations: Cholesterol stones were treated with hypericin at 2 × 10⁻⁵, 2 × 10⁻⁴ and 2 × 10⁻³ M or only with the solvent for 72 h. After rinsing and drying, the stones were photographed under white light and at 365 nm in a CN-15 darkroom cabinet.
Animals: Fifty-one Wistar rats (male, 8-10 wk, 300-350 g) were used. The animals were purchased from Charles River Breeding Laboratories, Inc. (St. Aubain les Elbeuf, France). One week before the experiments, they were housed under environmentally controlled conditions (temperature 23 ± 2 °C, relative humidity 60% ± 10%, 12:12 h light-dark cycle). Standard rat chow (Ssniff Spezialdiäten GmbH, Soest, Germany) and water were available ad libitum. The experiments were approved by the local animal ethics committee and were performed according to the European Ethics Committee guidelines (decree 86/609/EEC).
Fluorescent detection of human stones in a rat model of cholelithiasis receiving a given hypericin dose: Model rats with virtual gallbladder having implanted either cholesterol, mixed or pigment stones (VGHG) were prepared, as previously described[25]. Animals were imaged by MRI using a 3.0 T Siemens Trio whole-body scanner (Siemens, Erlangen Germany) to monitor the dilatation of the CBD and to detect the location of the gallstone(s) in the virtual gallbladder.
According to the gallstones classification by composition, VGHG rats with cholesterol, mixed or pigment stones were allocated in three groups (n = 5 each). Under intraperitoneal (IP) Nembutal anesthesia (30 mg/kg), the rats were intravenously (IV) given 1 × 10⁻³ M hypericin at 5.0 mg/kg via the penile vein. The other three groups of VGHG rats (n = 5) with cholesterol, mixed or pigment stones receiving only solvent were used as controls. Twelve hours later, the animals were sacrificed with an overdose Nembutal of 100 mg/kg. The stones were extracted from the animals, rinsed and photographed under white light and fluorescence (365 nm) in a CN-15 darkroom cabinet.
Fluorescent detection of cholesterol stones in a rat model of cholelithiasis receiving different hypericin doses: Three groups of anesthetized rats (n = 5 each) with virtual gallbladder having embedded cholesterol gallstones were IV given 1 × 10⁻³ M hypericin at 5, 10 or 15 mg/kg. After 12 h, the animals were killed with anaesthetic overdose and the internal organs were exposed. The animal and the extracted cholesterol stones were photographed in a CN-15 darkroom cabinet under white light and at 365 nm, with hypericin non-treated stones set as controls.
To investigate in which form hypericin is present in the bile for interacting with the stones, CBD-ligated rats were prepared by ligation of the CBD in six normal rats with a non-absorbable silk suture. The resulting enlarged CBD were cannulated using polyethylene (PE) tubing (0.58 mm ID and 0.96 mm OD, Natume Co., Tokyo, Japan) for bile collection.
The CBD-ligated rats then received IV 1 × 10⁻³ M hypericin at 10 mg/kg, and biliary juice was hourly collected from 0 to 9 h. Bile samples were transferred to a 96-well black polystyrene plate (Greiner Bio-One; Kremsmünster, Austria) and measured on a plate reader (FLUOstar OPTIMA, BMG Labtech, Offenburg, Germany) with excitation and emission filters of 485 and 590 nm wavelengths, respectively. The fluorescence concentrations versus time curves were built and the area under the curve from 0 up to 9 h (AUC0-9 h) was determined using the linear/logarithmic trapezoidal rule.
Bile samples were also analyzed by RP-HPLC using UV and fluorescence detection. Solutions of 1.3 × 10⁻⁵ M hypericin either in DMSO/PEG-400/PG/H2O (25%:25%:25%:25%, v/v/v/v) or bile were also analyzed.
The fluorescent HPLC peaks from bile analysis were collected and evaluated by matrix-assisted laser desorption/ionization time-of-flight mass spectrometry (MALDI-TOF MS) as described previously[30]. After digestion and extraction of the tryptic peptides, the samples were dried down, desalted onto Millipore ZipTip C18 (Bedford, MA, United States) and analyzed by MS on a MALDI-TOF/TOF 4800 instrument (Applied Biosystems, Foster City, United States)[30]. Data interpretation was performed with the GPS Explorer software (Version 3.5), and database searching was done using the Mascot program (Version 2.2) (http://www.matrixscience.com).
The numerical results are expressed as mean ± standard deviation (SD). Statistical analyses were performed using GraphPad Prism (version 4.0; GraphPad, San Diego, United States) by one-way analysis of variance (ANOVA). P values < 0.05 were considered statistically significant.
Solutions: Cholesterol solutions in DMSO/IPA (50%:50%, v/v) at different concentrations were transparent without any turbidity. Different concentrations of hypericin either in DMSO/IPA (50%:50%, v/v) or DMSO/PEG-400/PG/H2O (25%:25%:25%:25%, v/v/v/v) showed a light pink to bright red color without any discernible aggregates.
Stone morphology: Each cholecystectomy patient had several stones with similar size and morphology. However, marked variations in sizes and shapes of the stones were observed from different human subjects. Cholesterol stones were yellow polyhedrons having a smooth surface. Mixed stones appeared to have a yellow color, with large brown patches on their irregular surface. Pigment stones looked dark brown. Gallstones sized between 0.1 and 1.0 cm with various shapes ranging from round to faceted.
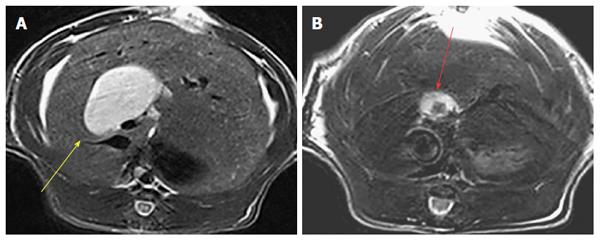
Animal models: The rat model of surgically induced virtual gallbladder with human cholesterol, mixed and pigment stones was successfully established in all animals[25], as confirmed by MRI (Figure 2).
No animals died due to the anesthetics and surgical procedures. For CBD-ligated rats, all the animals survived the anesthesia, surgery and cannulation process. None of them was excluded from the study because of procedural complications. The process proved to be safe and took around 20 min for each animal.
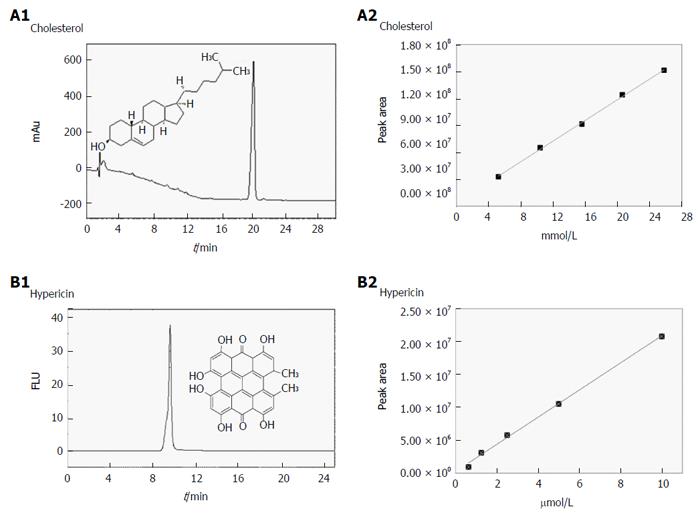
Validation of the chromatographic methods for cholesterol and hypericin quantification in gallstones: For cholesterol quantification, a blank and five standard solutions were prepared from 2.6 to 12.9 × 10⁻³ M in DMSO/IPA (50%:50 %, v/v). Chromatograms were obtained by RP-HPLC and diode array detection at 204 nm (Figure 3A). Table 1 presents the PAs and the RTs for the studied concentrations of cholesterol. Good column efficiency with a high number of theoretical plates (N) around 7700 was observed. The As and TF were 1.02 and 1.0, respectively (Table 2). The chromatographic method showed reliability, accuracy and precision. For replicate injections of five different concentrations of cholesterol, high precision was seen with %RSD values of the PAs below 1.7%. Low variability (%RSD < 1.3%) in RTs was observed (Table 3). The method exhibited a good accuracy having %RSD below 1.6% and recovery values of 99.8%, 100.3%, and 99.6% at 80%, 100% and 120% concentration levels, respectively (Table 4).
| Cholesterol | Hypericin | ||||
| Conc. | PA ± SD | RT ± SD (min) | Conc. | PA ± SD | RT ± SD (min) |
| (×10-3 M) | (n = 4) | (×10-6 M) | (n = 4) | ||
| 2.6 | 32715275 ± 532288 | 19.60 ± 0.19 | 0.6 | 961398 ± 14312 | 9.85 ± 0.14 |
| 5.2 | 64995700 ± 622439 | 19.83 ± 0.26 | 1.3 | 3120453 ± 33528 | 9.63 ± 0.03 |
| 7.8 | 91376450 ± 1113357 | 19.79 ± 0.14 | 2.5 | 5782945 ± 90738 | 9.41 ± 0.13 |
| 10.3 | 124007250 ± 2116420 | 19.97± 0.11 | 5.0 | 10563681 ± 134692 | 9.75 ± 0.11 |
| 12.9 | 151245250 ± 2660042 | 20.03 ± 0.12 | 10.0 | 20814150 ± 226368 | 9.61 ± 0.07 |
| System suitability parameters | Cholesterol | Hypericin |
| Theoretical plates (N) | 7700 | 5500 |
| Asymmetry factor (As) | 1.02 | 0.75 |
| Tailing factor (TF) | 1.00 | 0.61 |
| Cholesterol | Hypericin | ||||
| Conc. | RSD-PA | RSD-RT | Conc. | RSD-PA | RSD-RT |
| (×10-3 M) | (×10-6 M) | ||||
| 2.6 | 1.6% | 0.9% | 0.6% | 1.5% | 1.4% |
| 5.2 | 0.9% | 1.3% | 1.3% | 1.1% | 0.3% |
| 7.8 | 1.2% | 0.7% | 2.5% | 1.6% | 1.4% |
| 10.3 | 1.7% | 0.5% | 5.0% | 1.3% | 1.1% |
| 12.9 | 1.7% | 0.6% | 10.0% | 1.1% | 0.7% |
| Compound | Labelled amount | Added amount | Found amount | Recovery | RSD |
| Cholesterol | 1.0 mg | 0.80 mg | 0.79 mg | 99.8% | 1.6% |
| 1.00 mg | 1.00 mg | 100.0% | 1.1% | ||
| 1.20 mg | 1.19 mg | 99.6% | 1.2% | ||
| Hypericin | 0.0025 μg | 0.0020 μg | 0.0029 μg | 108.8% | 0.4% |
| 0.0025 μg | 0.0026 μg | 101.7% | 0.1% | ||
| 0.0030 μg | 0.0032 μg | 103.6% | 1.6% |
Figure 3B depicts the calibration curves corresponding to the mean chromatogram peak areas of cholesterol at different concentrations. The chromatographic conditions used to build the calibration curve allowed an efficient identification of this compound. The slope, Y-intercept and regression equation of the curve are presented in Table 5. Good linearity was observed with correlation coefficients (R2) above 0.998. The LOD and LOQ were 0.58 × 10⁻³ M and 1.76 × 10⁻³ M, respectively (Table 5).
| Compound | LR | Slope | SD (LR) | R2 | LOD (M) | LOQ (M) |
| Cholesterol | y = 1 × 10⁷ x + 3 × 10⁶ | 11712479 | 2055881 | 0.998 | 0.58 × 10⁻³ | 1.76 × 10⁻³ |
| Hypericin | y = 2 × 10⁶x + 2 × 10⁵ | 2066297 | 433480 | 0.998 | 0.69 × 10⁻⁶ | 2.1 × 10⁻⁶ |
For hypericin, standard solutions with five different concentrations from 0.6 to 10 × 10-6 M and a blank were prepared in DMSO/IPA (50%:50%, v/v). Unlike cholesterol, RP-HPLC chromatograms for hypericin were obtained using fluorescence detection (Figure 3C). The PAs and their RTs for the studied concentrations are shown in Table 1. The chromatographic method appeared to be feasible, precise and accurate (Table 2). A high number of theoretical plates (N = 5500) were determined, indicating good column efficiency. The As and TF were found to be around 0.75 and 0.61, respectively. For all replicate concentrations, the %RSD values of the PAs and RTs were less than 1.6% (Table 3). The accuracy of the method was excellent with %RSD lower than 1.5% and recovery values of 108.8%, 101.7%, and 103.6% at 80%, 100% and 120% concentration levels, respectively (Table 4).
By using the mean PAs at different concentrations of hypericin, calibration curves were plotted and are presented in Figure 3D. The slope, Y-intercept and regression equation are indicated in Table 5. The HPLC conditions used to construct the standard curves permitted a good identification of hypericin in the studied range of concentrations. The plot showed a good fit for a linear model with R2 above 0.997. The LOD and LOQ were 0.64 × 10⁻⁶ M and 1.90 × 10⁻⁶ M, respectively (Table 5).
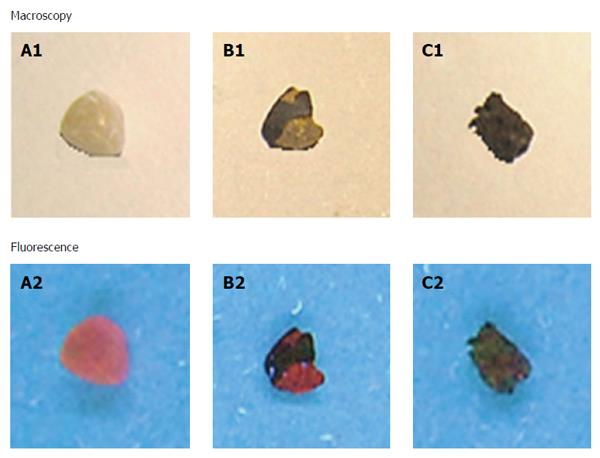
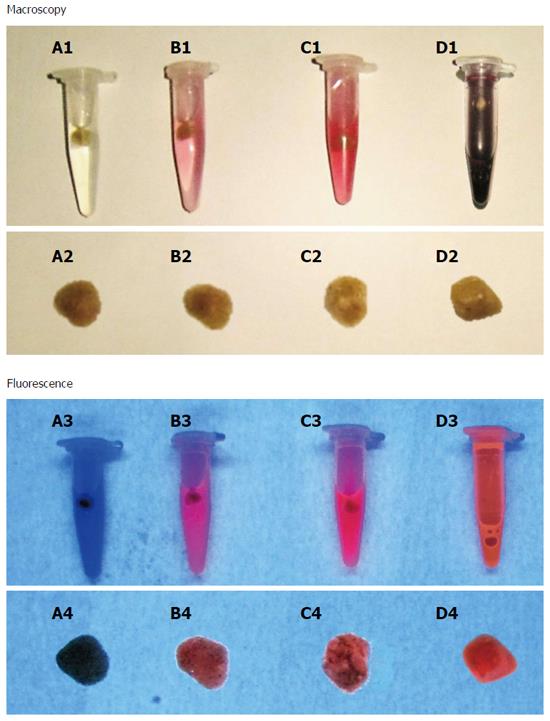
Interaction of different types of gallstones with hypericin: No solid depositions of solubilized stones fragments were macroscopically observed either in the solvent or at the bottom of the vials. At 365 nm, cholesterol gallstones showed a homogeneous red fluorescence on their surfaces. Mixed stones exhibited similar fluorescent intensity as that observed in cholesterol ones. However, the fluorescence signal had a heterogeneous distribution resembling a dotted pattern. In contrast, no fluorescence was noticed on the pigment stones and on the ones treated only with solvent (control) (Figure 4).
Interaction of cholesterol stones with hypericin at different concentrations: At 365 nm, a stronger red fluorescence was observed on the surfaces of cholesterol stones pre-incubated with 2 × 10⁻³ M hypericin than that from those stones treated with lower concentrations (2 × 10⁻⁴ and 2 × 10⁻⁵ M). Among them, 2 × 10⁻⁵ M hypericin produced the lowest fluorescence signal on the stone surface (Figure 5).
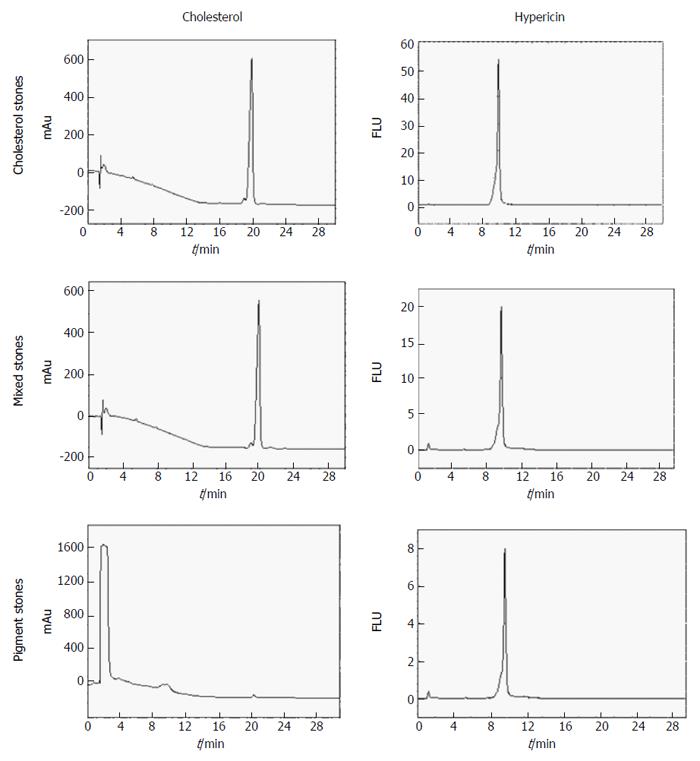
Quantification of hypericin and cholesterol in human stones: Figure 6 depicts chromatograms of DMSO/IPA (50%:50%, v/v) extracts from cholesterol, mixed and pigment stones obtained by RP-HPLC under diode array (204 nm) and fluorescence (excitation/emission wavelengths: 470/600 nm) detections.
On UV-chromatograms of mixed and cholesterol stones, a single peak was observed at an RT of 19.99 ± 0.17 min, corresponding to the cholesterol contents in the gallstones. With pigment stones, however, two peaks were seen. The first large peak appeared at 1.41 ± 0.02 min that seemed to correspond to other components which were present at higher amounts than cholesterol. The second small peak having an RT of 19.81 ± 0.11 min represented the cholesterol fraction in this type of stone. The concentrations of cholesterol in the DMSO/IPA extracts were 7.68, 6.65 and 0.08 × 10⁻³ M representing percentages of 81%-83%, 71%-75% and 1%-3% of the cholesterol, mixed and pigments stones, respectively (Table 6), which differ slightly from known classification[17,18].
| Type of stones | Cholesterol | Hypericin | P value | |
| Conc. (× 10-3 M) | Percentage | Conc. (× 10-6 M) | ||
| IPA/DMSO extracts | in stone | IPA/DMSO extracts | ||
| Cholesterol | 7.68 ± 0.25 | 83%-86% | 2.01 ± 0.38 | |
| Mixed | 6.65 ± 0.12 | 71%-75% | 0.50 ± 0.19 | 0.011 |
| Pigment | 0.08 ± 0.02 | 1%-3% | 0.23 ± 0.06 | |
By fluorescence detection for hypericin, a single peak with an RT of 9.68 ± 0.06 min was observed in all types of gallstones. Regarding its concentration, significant differences were found among cholesterol, mixed and pigment stones (P = 0.01). The highest contents were detected in cholesterol stones, whereas the lowest values were determined in the pigment ones. The concentrations of hypericin in the DMSO/IPA extracts were 2.0, 0.5 and 0.2 × 10⁻⁶ M for cholesterol, mixed and pigments stones, respectively (Table 6).
Fluorescence detection of cholesterol, mixed and pigment stones in a rat model of cholelithiasis receiving hypericin: Cholelithiasis rats having cholesterol, mixed and pigment stones received IV 1 × 10⁻³ M hypericin at 5 mg/kg. No unexpected side-effects and good tolerability were observed. Cholesterol gallstones extracted from rats treated with hypericin showed high red fluorescence at 365 nm. Mixed stones exhibited similar fluorescent intensity but in a heterogeneous distribution pattern. In contrast, pigment stones or stones from the rats receiving only solvent showed no fluorescent signals (data not shown).
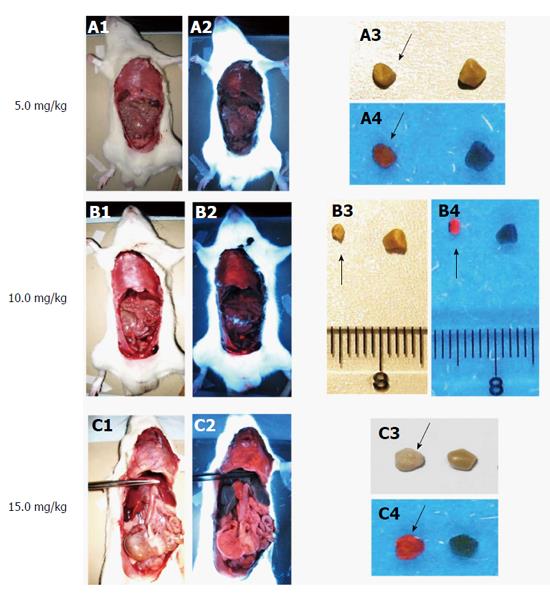
Fluorescence detection of cholesterol stones in a rat model of cholelithiasis receiving different doses of hypericin: Cholelithiasis rats with cholesterol stones were IV given 1×10⁻³ M hypericin at doses of 5, 10 or 15 mg/kg, which were all safe and well-tolerated. With 5 mg/kg, the stones exhibited relative lower fluorescence and, almost no signal was observed from the organs and tissues (Figure 7). After injecting hypericin at 10 mg/kg, stones exhibited high red fluorescence, with moderate signal intensity seen in the diaphragm and intestine (Figure 7). With 15 mg/kg, fluorescence in the midline surgical incision, mouth and testis skin was detected (data not shown) in addition to the high fluorescence intensity in gallstones as well as the diaphragm, intestine, stomach and pancreas. Overall, the results showed that the fluorescence intensity and the tissue distribution of hypericin were positively correlated with the injected dose. Interestingly, the liver was almost not fluorescent in all hypericin doses (Figure 7), likely due to non-fluorescent binding form of hypericin present in hepatocytes.
Bile collection in CBD-cannulated rats: The bile flow rate varied from 0.22 to 0.58 mL/h. It remained almost constant at 0.57 ± 0.01 ml/h over the first two hours, but dropped to 0.2 mL/h during the later 7 h. The total volume of bile collected was about 3.5 mL in the course of the nine hours.
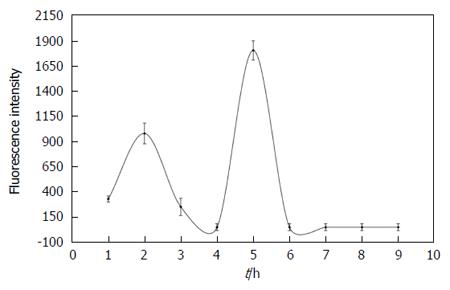
Fluorescence intensity over time in bile from CBD-cannulated rats after hypericin administration: Figure 8 gives the concentration curves of fluorescent species versus time in bile during 9 h after hypericin administration with two peaks observed. The first peak reached its highest value at 2 h. The second higher steep peak occurred at 5 h. From AUC calculation of concentration curves, the percentage of fluorescent species excreted into the bile within 9 h was 20% of the total administered dose of hypericin.
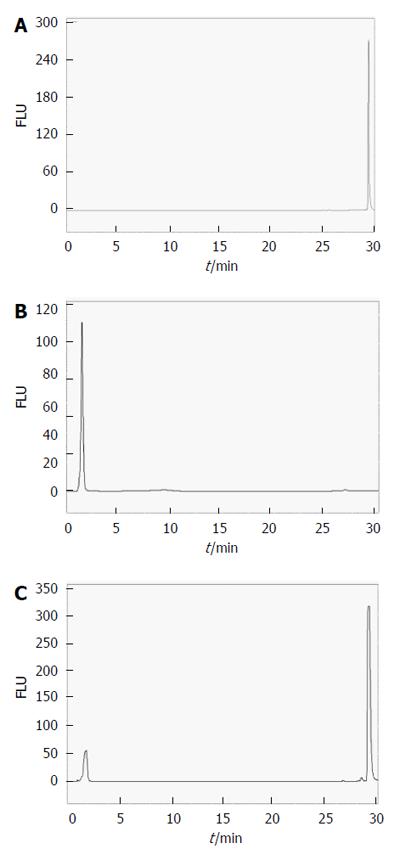
Figure 9 shows fluorescence HPLC chromatograms for 1.3 × 10⁻⁵ M hypericin dissolved either in solvent or bile as well as samples of bile from CBD-cannulated rats before hypericin injection at excitation/emission wavelengths of 470 and 600 nm. With only hypericin, a single narrow peak at an RT of 29.22 ± 0.09 min was seen (Figure 9A). Bile samples before receiving hypericin showed a single peak with a short RT of 1.67 ± 0.14 min that corresponded to the autofluorescent properties of the bile (Fig 9B). HPLC of hypericin in bile had two peaks of RT at 1.72 ± 0.22 min and 29.38 ± 0.15 min, respectively (Figure 9C).
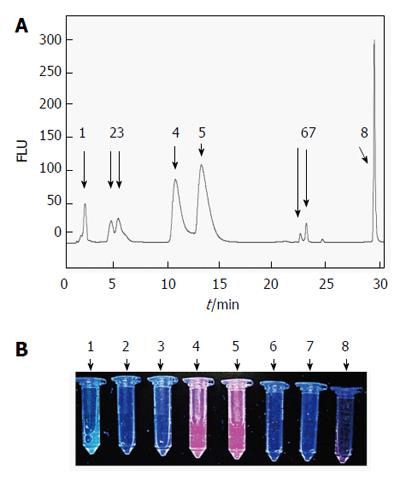
A fluorescent HPLC of bile at 2 h after hypericin injection is shown in Figure 10 with a total of 8 peaks. The first peak with an RT of 1.76 ± 0.11 min and 15% of area referred to the autofluorescent bile fraction. The 2nd and 3rd peaks overlapped at an RT of 4.27 ± 0.09 min and 5.03 ± 0.25 min with 4.3% and 7.2% of the total area, respectively. The 4th peak was detected at 10.42 ± 0.18 min with 26.6% of area. The 5th peak slightly overlapped with the 4th one came out at 12.95 ± 0.25 min with 37.6% of area. At longer RTs, the 6th (22.50 ± 0.26 min) and 7th (23.16 ± 0.72 min) small peaks represented less than 4% of the biliary excretion, followed by the last peak with an RT of 29.12 ± 0.03 min accounting for 15.8% of area that seemed to correspond to the intact hypericin (Figure 10A and B).
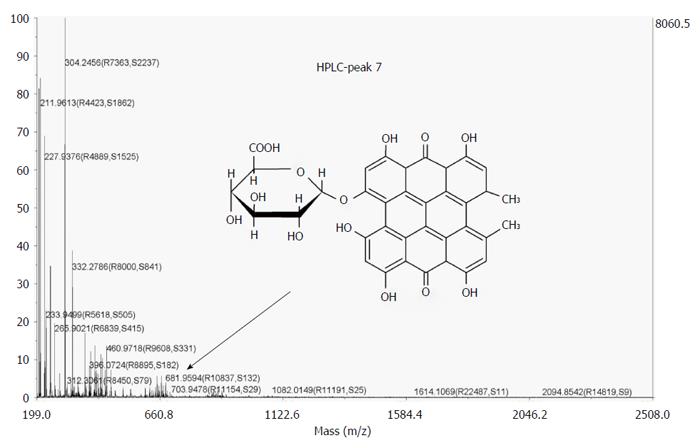
By MALDI-TOF MS, the collected fluorescent HPLC peaks were analyzed. Among them, however, only one peak (RT = 23.16 min) could be identified, which most likely represents the mono-glucuronide (m/z = 681. 9594 Da) ion of hypericin (Figure 11).
Gallstones are deposits in the gallbladder, which often instigate diseases including cholelithiasis and require treatments including surgery to remove the gallbladder and/or stone(s)[11-20]. These crystalline concretions differ in chemical compositions, indicating various mechanisms of formation and growth. Although some diagnostic techniques are clinically available for cholelithiasis, none of them offer a differential imaging diagnosis based on the chemical composition of the gallstones. The feasibility and availability of such a technique may help to better treat cholelithiasis and reduce its recurrence.
In this study, we thought hypericin could be a potential fluorophore for the differential detection of gallstones by optical imaging. Literature shows that high amounts of hypericin selectively localized in cholesterol-rich microdomains than in less ordered lipid-rich areas[9]. Emission spectrum measurements indicated interactions between pi electrons of hypericin and cholesterol may lead to the formation of a packing arrangement between the common planar structures of the two molecules[9]. Based on these observations, we hypothesised that similar interaction could occur between hypericin and the cholesterol crystals (in gallstones), which are formed due to the inability to solubilize the lipid-bile salt micelles in cholesterol-enriched bile. Moreover, the nearly 100% hypericin excretion in the bile could be a favourable feature for the exploration of this approach. Hypericin is highly lipophilic with a high octanol-water partition coefficient value (log P = 3.43)[31] and a molecular size of 504 g/mol. In its metabolic pathway, being taken up and excreted by hepatocytes, it passes via the bile from the liver through the CDB and gallbladder into the intestine[32]. This might facilitate the contact between hypericin and the stones located either in the gallbladder or biliary ducts. Furthermore, hypericin has a distinct fluorescent profile in the orange-red region (emission peak about 590 nm) which can offer high quality optical images.
By testing in vitro, we proved the specificity and affinity of hypericin for the cholesterol present in the gallstones from cholecystectomy patients. Hypericin-treated cholesterol gallstones showed high and homogeneous fluorescence covering their entire surfaces. In mixed stones with heterogeneous surface distribution of cholesterol, only spotted fluorescence was observed. Pigment stones having low cholesterol contents as well as hypericin-non treated stones exhibited no fluorescent properties. As it was expected, hypericin seemed to accumulate preferably in regions where high concentrations of cholesterol localized.
In a second step to investigate the preferential hypericin accumulation in cholesterol-rich gallstones, HPLC technique combined with the calibration curve method[33,34] was applied to determine cholesterol and hypericin contents in different types of human gallstones pre-incubated with hypericin. Both techniques, separately or in combination, have been applied for quantification of both compounds in different samples[35,36]. In this study, standards of either cholesterol or hypericin were assessed by HPLC and, then, the corresponding calibration curves were generated, allowing the quantification of both compounds in the gallstones by further curve-extrapolation. Although we used similar chromatographic conditions such as type and length of analytical column, mobile phase composition and flow rate, with different detectors included, the fluorescence detection of hypericin as the fluorophore was preferred due to its high sensitivity for identifying trace amounts of molecules in biological matrices[37]. With the non-fluorescent cholesterol, instead, a diode array detector was set at a wavelength of 204 nm, as has been used in previous works[38]. For HPLC analysis, all the stones were treated with a solvent mixture consisting of DMSO/IPA (50%/50%, v/v) to simultaneously extract cholesterol and hypericin. The 2-propanol solvent has been used for cholesterol extraction from different biological fluids and tissues[39]. Regarding DMSO, it is the solvent of choice for dissolving water-insoluble hypericin[40]. After extrapolating the concentration of hypericin or cholesterol in the DMSO/IPA extracts from the stones to the corresponding calibration curves, cholesterol stones constantly showed the highest amounts of both compounds. Despite these results, it is important to note that the concentration of hypericin detected is thousand-fold smaller than the total cholesterol contents in the stones, likely due to binding of hypericin to the cholesterol-rich surfaces of the gallstone without going deeper into the internal cholesterol deposits of the stone.
To make steps forward, we investigated the feasibility of using hypericin to detect different types of human gallstones in a rat model of cholelithiasis[25] by fluorescence optical imaging. Comparisons among groups of VGHG animals containing different types of gallstones supported our in vitro observations. Indeed, 12 h after giving hypericin to VGHG animals, cholesterol and mixed gallstones were fluorescent in contrast to the pigment stones which lacked fluorescent properties. Moreover, we tried to optimize in vivo the dose of hypericin needed to obtain a good ratio between the fluorescent signals from cholesterol stones and the background. Such a ratio could be hampered either by tissue autofluorescence or hypericin biodistribution/excretion. Indeed, the results showed dependence between the administered dose of hypericin and its accumulation in the stones and organs. This closely matched with our in vitro studies about the influence of hypericin concentration on the fluorescent intensity of cholesterol stones. It seems that a dose of 10 mg/kg offered the best outcome among the tested hypericin doses, with which highly fluorescent contrast on stones was detected relative to the low intestinal background. By injecting 15 mg/kg hypericin, however, high fluorescence from both stones and tissues was observed, which interfered with the detection of gallstones. It may be due to the presence of hypericin remnants in the intestinal lumen as its major excretion pathway[32,41]. With 5 mg/kg hypericin, no fluorescence from the background and faint fluorescent signal from the stones were observed. This could be due to that hypericin was almost cleared from the body and washed out from the surface of gallstones by the bile flow over 12 h. Despite these promising results, improvement is still needed. Because of the possible phototoxicity of hypericin[42], a dose of 10 mg/kg could harm the patients. Lower doses of hypericin along with shorter incubation time (< 12 h) for gallstone detection could be a solution to overcome this drawback. With further optimization, by using a safe dose, it could be possible to guarantee a good signal-to-noise ratio in fluorescence before a complete washout of hypericin from the stone surface.
An additional study was conducted on CBD-cannulated rats for identifying hypericin species in the bile interacting with the stones. For this, the fluorescent properties of bile samples collected in 9 h were assayed by fluorospectrometry, HPLC and MALDI TOF-TOF MS at the excitation and emission wavelengths for the fluorophore hypericin. A collection period of 9 h was chosen due to the decrease in the flow rate of drained biliary juice after long period of CBD cannulation, as was also observed in previous studies[43]. By HPLC, a profile of eight fluorescent species was observed along 9 h of bile collection. Hypericin was mainly excreted in conjugated fluorescent forms representing above 60% of the total peak area. This matched with previous results for iodinated-hypericin derivatives[43]. Importantly, such peaks could not be observed in a hypericin solution with the bile as a solvent. They only appear during the passage of hypericin through the liver. Because cholesterol is one of the major bile constituents and undergoes intestinal reabsorption[44], and since the affinity between cholesterol and hypericin has been reported[20,45], we initially thought both molecules might form complexes in their primary path through hepatocytes. However, the lipophilicity of both compounds does not explain the presence of hypericin conjugates observed during the RP-HPLC analysis, showing less lipophilic character due to their shorter RTs. An alternative reason is the possible hepatic glucuronidation of hypericin during bile excretion due to its relatively large molecular weight (504 g/mol) and chemical structure[32,41,46]. The glucuronic acid-compounds are usually more soluble in water than non-glucuronic acid-containing compounds. This could explain the faster elution of the fluorescent hypericin metabolites compared to the intact hypericin from the hydrophobic HPLC column. Indeed, MALDI TOF-TOF MS showed a peak corresponding to a glucuronide hypericin specie, confirming our hypothesis.
By fluorospectrometry, time-fluorescence concentration curves for hypericin revealed two fluorescent peaks in the bile. The first one is most likely related with the elimination of hypericin through the bile that came a few hours after administration. The second delayed peak may denote the enterohepatic circulation (EHC) of hypericin, in line with earlier reports on hypericin and its derivatives[32]. Consequently, hypericin is partially reabsorbed from intestinal lumen through the portal circulation. Indeed, previous studies on lipophilic compounds such as hypericin have shown the influence of EHC on their absorption, distribution, metabolism and excretion[32,47,48].
In conclusion, this study proves the feasibility of using the fluorophore hypericin for differential detection of human gallstones by their chemical compositions. This approach may assist in fluorescent detection and removal of cholesterol gallstones during open surgery and/or endoscopic cholecystectomy and cholangiotomy. Further research is deemed necessary before this approach could enter clinical applications.
The corresponding author is a Bayer Lecture Chair holder.
Cholelithiasis refers to cholesterol, mixed and pigment gallstones in the biliary system especially the gallbladder, which is a common disorder of the digestive system.
Although current diagnostic methods may detect gallstones in the biliary system, none of them may offer an in situ differential diagnosis of gallstones regarding their chemical composition.
Hypericin is a fluorophore plant pigment tending to bind lipids and is excreted via bile. Because hypericin presumably targets cholesterol, it could become a potential optical imaging probe for differential fluorescent detection of gallstones. This hypothesis was verified in vitro and in vivo in a rat model of human gallstones.
Such imaging procedures would allow identifying the origin, composition and formation of gallstones in patients and permit adopting strategies to minimize cholelithiasis recurrence.
The manuscript is well written, the methodological part in particular. It deserves to be published. The authors consider the main benefit of this study to allow a differential detection of human gallstones regarding to their chemical composition. I am afraid this information has, today, little clinical significance to the surgeon. Knowing the chemical composition of the gallstone do not alter the surgical management. However, this information will certainly help treat these patients without surgery. Drugs like Ursodiol, a biliary acid that is used to prevent and treat gallstones, may be better indicated if the chemical composition of the gallstone is known.
Manuscript source: Unsolicited manuscript
Specialty type: Gastroenterology and hepatology
Country of origin: Belgium
Peer-review report classification
Grade A (Excellent): 0
Grade B (Very good): B
Grade C (Good): 0
Grade D (Fair): 0
Grade E (Poor): 0
P- Reviewer: Bener A S- Editor: Yu J L- Editor: Wang TQ E- Editor: Wang CH
| 1. | Haller CA. St John’s wort, depression, and catecholamines. Clin Pharmacol Ther. 2004;76:393-395. [RCA] [PubMed] [DOI] [Full Text] [Cited by in Crossref: 1] [Cited by in RCA: 1] [Article Influence: 0.0] [Reference Citation Analysis (0)] |
| 2. | Tedeschi E, Menegazzi M, Margotto D, Suzuki H, Förstermann U, Kleinert H. Anti-inflammatory actions of St. John’s wort: inhibition of human inducible nitric-oxide synthase expression by down-regulating signal transducer and activator of transcription-1alpha (STAT-1alpha) activation. J Pharmacol Exp Ther. 2003;307:254-261. [PubMed] |
| 3. | Karioti A, Bilia AR. Hypericins as potential leads for new therapeutics. Int J Mol Sci. 2010;11:562-594. [RCA] [PubMed] [DOI] [Full Text] [Full Text (PDF)] [Cited by in Crossref: 200] [Cited by in RCA: 185] [Article Influence: 12.3] [Reference Citation Analysis (0)] |
| 4. | Li J, Sun Z, Zhang J, Shao H, Cona MM, Wang H, Marysael T, Chen F, Prinsen K, Zhou L. A dual-targeting anticancer approach: soil and seed principle. Radiology. 2011;260:799-807. [RCA] [PubMed] [DOI] [Full Text] [Cited by in Crossref: 67] [Cited by in RCA: 77] [Article Influence: 5.5] [Reference Citation Analysis (1)] |
| 5. | Ni Y, Bormans G, Marchal G, Verbruggen A. Tissue infarction and necrosis specific compounds (of hypericin derivatives). PCT/BE2004/000107. US: FreePatentsOnline 2003; . |
| 6. | Ni Y, Bormans G, Chen F, Verbruggen A, Marchal G. Necrosis avid contrast agents: functional similarity versus structural diversity. Invest Radiol. 2005;40:526-535. [PubMed] |
| 7. | Miskovsky P, Hritz J, Sanchez-Cortes S, Fabriciova G, Ulicny J, Chinsky L. Interaction of hypericin with serum albumins: surface-enhanced Raman spectroscopy, resonance Raman spectroscopy and molecular modeling study. Photochem Photobiol. 2001;74:172-183. [PubMed] |
| 8. | Buriankova L, Buzova D, Chorvat D, Sureau F, Brault D, Miskovský P, Jancura D. Kinetics of hypericin association with low-density lipoproteins. Photochem Photobiol. 2011;87:56-63. [RCA] [PubMed] [DOI] [Full Text] [Cited by in Crossref: 12] [Cited by in RCA: 13] [Article Influence: 0.9] [Reference Citation Analysis (0)] |
| 9. | Ho YF, Wu MH, Cheng BH, Chen YW, Shih MC. Lipid-mediated preferential localization of hypericin in lipid membranes. Biochim Biophys Acta. 2009;1788:1287-1295. [RCA] [PubMed] [DOI] [Full Text] [Cited by in Crossref: 44] [Cited by in RCA: 48] [Article Influence: 3.0] [Reference Citation Analysis (0)] |
| 10. | Song S, Xiong C, Zhou M, Lu W, Huang Q, Ku G, Zhao J, Flores LG, Ni Y, Li C. Small-animal PET of tumor damage induced by photothermal ablation with 64Cu-bis-DOTA-hypericin. J Nucl Med. 2011;52:792-799. [RCA] [PubMed] [DOI] [Full Text] [Cited by in Crossref: 39] [Cited by in RCA: 41] [Article Influence: 2.9] [Reference Citation Analysis (0)] |
| 11. | Everhart JE, Khare M, Hill M, Maurer KR. Prevalence and ethnic differences in gallbladder disease in the United States. Gastroenterology. 1999;117:632-639. [PubMed] |
| 12. | Qiao T, Ma RH, Luo XB, Yang LQ, Luo ZL, Zheng PM. The systematic classification of gallbladder stones. PLoS One. 2013;8:e74887. [RCA] [PubMed] [DOI] [Full Text] [Full Text (PDF)] [Cited by in Crossref: 43] [Cited by in RCA: 44] [Article Influence: 3.7] [Reference Citation Analysis (0)] |
| 13. | Cholelithiasis. accessed 2016-03-26. Available from: http://fitsweb.uchc.edu/student/selectives/Luzietti/Gallbladder_cholelithiasis.htm. |
| 14. | Vorvick LJ, Longstreth GF, Zieve D. Acute cholecystitis. MedlinePlus 2011. Update April 24, 2015. Available from: http://www.nlm.nih.gov/medlineplus/ency/article/000264.htm. |
| 15. | Csendes A, Burdiles P, Maluenda F, Diaz JC, Csendes P, Mitru N. Simultaneous bacteriologic assessment of bile from gallbladder and common bile duct in control subjects and patients with gallstones and common duct stones. Arch Surg. 1996;131:389-394. [PubMed] |
| 16. | Iida M, Okayama Y, Goto K, Shiraki S, Hoshino M, Takeuchi T. [Gallstone classification and analysis of their constituents]. Nihon Rinsho. 1993;51:1718-1724. [PubMed] |
| 17. | Kim IS, Myung SJ, Lee SS, Lee SK, Kim MH. Classification and nomenclature of gallstones revisited. Yonsei Med J. 2003;44:561-570. [PubMed] |
| 18. | Ravnborg L, Teilum D, Pedersen LR. Gallbladder stones classified by chemical analysis of cholesterol content. Frederiksberg, 1987-1988. Scand J Gastroenterol. 1990;25:720-724. [PubMed] |
| 19. | Hanaoka H. The fate of hypertrophic chondrocytes of the epiphyseal plate. An electron microscopic study. J Bone Joint Surg Am. 1976;58:226-229. [PubMed] |
| 20. | Gallstones. accessed 2016-03-26. Available from: http: //www.medicinenet.com/gallstones/article.htm. |
| 21. | Mukherjee P, Adhikary R, Halder M, Petrich JW, Miskovsky P. Accumulation and interaction of hypericin in low-density lipoprotein--a photophysical study. Photochem Photobiol. 2008;84:706-712. [RCA] [PubMed] [DOI] [Full Text] [Cited by in Crossref: 25] [Cited by in RCA: 26] [Article Influence: 1.5] [Reference Citation Analysis (0)] |
| 22. | Maduray K, Davids LM. The anticancer activity of hypericin in photodynamic therapy. J Bioanal Biomed. 2011;S6-004. [RCA] [DOI] [Full Text] [Cited by in Crossref: 6] [Cited by in RCA: 6] [Article Influence: 0.5] [Reference Citation Analysis (0)] |
| 23. | Uzdensky AB, Ma LW, Iani V, Hjortland GO, Steen HB, Moan J. Intracellular localisation of hypericin in human glioblastoma and carcinoma cell lines. Lasers Med Sci. 2001;16:276-283. [PubMed] |
| 24. | Uzdensky AB, Iani V, Ma LW, Moan J. Photobleaching of hypericin bound to human serum albumin, cultured adenocarcinoma cells and nude mice skin. Photochem Photobiol. 2002;76:320-328. [PubMed] |
| 25. | Cona MM, Liu Y, Yin T, Feng Y, Chen F, Mulier S, Li Y, Zhang J, Oyen R, Ni Y. Rat model of cholelithiasis with human gallstones implanted in cholestasis-induced virtual gallbladder. World J Methodol. 2016;6:154-162. [RCA] [PubMed] [DOI] [Full Text] [Full Text (PDF)] [Cited by in CrossRef: 2] [Cited by in RCA: 2] [Article Influence: 0.2] [Reference Citation Analysis (1)] |
| 26. | United States Food and Drug Administration. ICH harmonized tripartite guideline, Validation of analytical procedures: text and methodology, Q2-R1, 2005, accessed 2016-03-26. Available from: http://www.fda.gov/Drugs/GuidanceComplianceRegulatoryInformation/Guidances/ucm265700.htm. |
| 27. | United States Food and Drug Administration. Reviewer guidance’ validation of chromatographic methods center for drug evaluation and research (CDER), accessed 2016-03-26. Available from: http://www.fda.gov/downloads/Drugs/.../Guidances/UCM134409.pdf. |
| 28. | United States Food and Drug Administration. Analytical Procedures and Methods Validation: Chemistry, Manufacturing, and Controls, Federal Register. DFT WPD. 2000;65:776-777. |
| 29. | Bartolomeo MP, Maisano F. Validation of a reversed-phase HPLC method for quantitative amino acid analysis. J Biomol Tech. 2006;17:131-137. [PubMed] |
| 30. | D’Hertog W, Overbergh L, Lage K, Ferreira GB, Maris M, Gysemans C, Flamez D, Cardozo AK, Van den Bergh G, Schoofs L. Proteomics analysis of cytokine-induced dysfunction and death in insulin-producing INS-1E cells: new insights into the pathways involved. Mol Cell Proteomics. 2007;6:2180-2199. [PubMed] |
| 31. | Jürgenliemk G, Nahrstedt A. Dissolution, solubility and cooperativity of phenolic compounds from Hypericum perforatum L. in aqueous systems. Pharmazie. 2003;58:200-203. [PubMed] |
| 32. | Kerb R, Brockmöller J, Staffeldt B, Ploch M, Roots I. Single-dose and steady-state pharmacokinetics of hypericin and pseudohypericin. Antimicrob Agents Chemother. 1996;40:2087-2093. [PubMed] |
| 33. | Baldelli S, Cattaneo D, Giodini L, Baietto L, Di Perri G, D’Avolio A, Clementi E. Development and validation of a HPLC-UV method for the quantification of antiepileptic drugs in dried plasma spots. Clin Chem Lab Med. 2015;53:435-444. [RCA] [PubMed] [DOI] [Full Text] [Cited by in Crossref: 35] [Cited by in RCA: 37] [Article Influence: 4.1] [Reference Citation Analysis (0)] |
| 34. | Baheti KG, Shah N, Shaikh S. Ion-pairing reverse-phase high performance liquid chromatography method for simultaneous estimation of atenolol and indapamide in bulk and combined dosage form. Indian J Pharm Sci. 2012;74:271-274. [RCA] [PubMed] [DOI] [Full Text] [Full Text (PDF)] [Cited by in Crossref: 5] [Cited by in RCA: 5] [Article Influence: 0.4] [Reference Citation Analysis (0)] |
| 35. | Cao XZ, Mi TY, Li L, Vermeer MA, Zhang CC, Huang N, Manoj JK. HPLC-FLD determination of NBD-cholesterol, its ester and other metabolites in cellular lipid extracts. Biomed Chromatogr. 2013;27:910-915. [RCA] [PubMed] [DOI] [Full Text] [Cited by in Crossref: 4] [Cited by in RCA: 4] [Article Influence: 0.3] [Reference Citation Analysis (0)] |
| 36. | de los Reyes GC, Koda RT. Development of a simple, rapid and reproducible HPLC assay for the simultaneous determination of hypericins and stabilized hyperforin in commercial St. John’s wort preparations. J Pharm Biomed Anal. 2001;26:959-965. [PubMed] |
| 37. | Agarwal R. Temperature sensitivity and fluorescence detection. J Sep Sci. 2008;31:128-132. [PubMed] |
| 38. | Wong WW, Hachey DL, Feste A, Leggitt J, Clarke LL, Pond WG, Klein PD. Measurement of in vivo cholesterol synthesis from 2H2O: a rapid procedure for the isolation, combustion, and isotopic assay of erythrocyte cholesterol. J Lipid Res. 1991;32:1049-1056. [PubMed] |
| 39. | Sen M, Bhattacharyya DK. Nutritional quality of sunflower seed protein fraction extracted with isopropanol. Plant Foods Hum Nutr. 2000;55:265-278. [PubMed] |
| 40. | Bánó G, Staničová J, Jancura D, Marek J, Bánó M, Uličný J, Strejčková A, Miškovský P. On the diffusion of hypericin in dimethylsulfoxide/water mixtures-the effect of aggregation. J Phys Chem B. 2011;115:2417-2423. [RCA] [PubMed] [DOI] [Full Text] [Cited by in Crossref: 54] [Cited by in RCA: 57] [Article Influence: 4.1] [Reference Citation Analysis (0)] |
| 41. | Bormans G, Huyghe D, Christiaen A, Verbeke K, de Groot T, Vanbilloen H, de Witte P, Verbruggen A. Preparation, analysis and biodistribution in mice of iodine-123 labeled derivatives of hypericin. J Labeled Compounds & Radiopharmaceuticals. 2004;47:191-198. [RCA] [DOI] [Full Text] [Cited by in Crossref: 22] [Cited by in RCA: 22] [Article Influence: 1.0] [Reference Citation Analysis (0)] |
| 42. | Davids LM, Kleemann B, Kacerovská D, Pizinger K, Kidson SH. Hypericin phototoxicity induces different modes of cell death in melanoma and human skin cells. J Photochem Photobiol B. 2008;91:67-76. [RCA] [PubMed] [DOI] [Full Text] [Cited by in Crossref: 84] [Cited by in RCA: 88] [Article Influence: 5.2] [Reference Citation Analysis (0)] |
| 43. | Cona MM, Feng Y, Verbruggen A, Oyen R, Ni Y. Improved clearance of radioiodinated hypericin as a targeted anticancer agent by using a duodenal drainage catheter in rats. Exp Biol Med (Maywood). 2013;238:1437-1449. [RCA] [PubMed] [DOI] [Full Text] [Cited by in Crossref: 10] [Cited by in RCA: 10] [Article Influence: 0.8] [Reference Citation Analysis (0)] |
| 44. | Bergstrom S. CIBA Foundation symposium on biosynthesis of terpenes and sterols. 1959;185. [DOI] [Full Text] |
| 45. | Eriksson ESE, Eriksson LA. The influence of cholesterol on the properties and permeability of hypericin derivatives in lipid membranes. J Chem Theory Comput. 2011;7:560-74. [RCA] [DOI] [Full Text] [Cited by in Crossref: 42] [Cited by in RCA: 39] [Article Influence: 2.8] [Reference Citation Analysis (0)] |
| 46. | Barceloux DG. Medical Toxicology of Natural Substances: Foods, Fungi, Medicinal Herbs, Plants, and Venomous Animals. John Wiley & Sons. 2008;90. [DOI] [Full Text] |
| 47. | Jandacek RJ, Tso P. Enterohepatic circulation of organochlorine compounds: a site for nutritional intervention. J Nutr Biochem. 2007;18:163-167. [RCA] [PubMed] [DOI] [Full Text] [Cited by in Crossref: 33] [Cited by in RCA: 33] [Article Influence: 1.8] [Reference Citation Analysis (0)] |
| 48. | Jaggi R, Addison RS, King AR, Suthers BD, Dickinson RG. Conjugation of desmethylnaproxen in the rat--a novel acyl glucuronide-sulfate diconjugate as a major biliary metabolite. Drug Metab Dispos. 2002;30:161-166. [PubMed] |


