Published online May 14, 2016. doi: 10.3748/wjg.v22.i18.4466
Peer-review started: January 21, 2016
First decision: February 18, 2016
Revised: March 2, 2016
Accepted: March 14, 2016
Article in press: March 14, 2016
Published online: May 14, 2016
Processing time: 104 Days and 11.1 Hours
AIM: To analyze the effect of three-dimensional (3D)-arrangement on the expression of epithelial-to-mesenchymal transition markers in pancreatic adenocarcinoma (PDAC) cells.
METHODS: HPAF-II, HPAC, and PL45 PDAC cells were cultured in either 2D-monolayers or 3D-spheroids. Ultrastructure was analyzed by transmission electron microscopy. The expression of E-cadherin, β-catenin, N-cadherin, collagen type I (COL-I), vimentin, α-smooth muscle actin (αSMA), and podoplanin was assayed by confocal microscopy in cells cultured on 12-mm diameter round coverslips and in 3D-spheroids. Gene expression for E-cadherin, Snail, Slug, Twist, Zeb1, and Zeb2 was quantified by real-time PCR. E-cadherin protein level and its electrophoretic pattern were studied by Western blot in cell lysates obtained from cells grown in 2D-monolayers and 3D-spheroids.
RESULTS: The E-cadherin/β-catenin complex was expressed in a similar way in plasma membrane cell boundaries in both 2D-monolayers and 3D-spheroids. E-cadherin increased in lysates obtained from 3D-spheroids, while cleavage fragments were more evident in 2D-monolayers. N-cadherin expression was observed in very few PDAC cells grown in 2D-monolayers, but was more evident in 3D-spheroids. Some cells expressing COL-I were observed in 3D-spheroids. Podoplanin, expressed in collectively migrating cells, and αSMA were similarly expressed in both experimental conditions. The concomitant maintenance of the E-cadherin/β-catenin complex at cell boundaries supports the hypothesis of a collective migration for these cells, which is consistent with podoplanin expression.
CONCLUSION: We show that a 3D-cell culture model could provide deeper insight into understanding the biology of PDAC and allow for the detection of marked differences in the phenotype of PDAC cells grown in 3D-spheroids.
Core tip: The functions of living tissue can be mimicked by three-dimensional (3D) cell cultures, thereby providing a method of decoding the information encoded in the tissue architecture. We aimed to analyze the effect of 3D-arrangement on the expression of some key markers of epithelial-to-mesenchymal transition in pancreatic adenocarcinoma (PDAC) cells cultured in either 2D-monolayers or 3D-spheroids. Our results show that a 3D-cell culture model could provide deeper insight into understanding the biology of PDAC and allow for the detection of marked differences in the phenotype of PDAC cells grown in 3D-spheroids.
- Citation: Gagliano N, Celesti G, Tacchini L, Pluchino S, Sforza C, Rasile M, Valerio V, Laghi L, Conte V, Procacci P. Epithelial-to-mesenchymal transition in pancreatic ductal adenocarcinoma: Characterization in a 3D-cell culture model. World J Gastroenterol 2016; 22(18): 4466-4483
- URL: https://www.wjgnet.com/1007-9327/full/v22/i18/4466.htm
- DOI: https://dx.doi.org/10.3748/wjg.v22.i18.4466
Pancreatic ductal adenocarcinoma (PDAC) is one of the most aggressive and lethal tumors, representing the fourth most common cause of cancer death in the Western world, with an estimated incidence of more than 40000 cases per year in the United States. The 5-year survival for all stages of the disease remains < 5%[1,2], due to the high incidence of recurrence and metastases dissemination[3].
During carcinogenesis, the “phenotypic switch” of pancreatic epithelial cells to mesenchymal cells, the so-called “epithelial-to-mesenchymal transition” (EMT), plays a pivotal role in PDAC progression, rendering tumor cells invasive and able to metastasize distant organs[4]. The EMT-related phenotype is characterized by the loss of epithelial features, including cell adhesion and polarity, following down-regulation of E-cadherin, cytoskeleton reorganization by expressing vimentin and α-smooth muscle actin (αSMA), and the motile properties and secretion of matrix metalloproteinases (MMPs)[5]. Several inducers of EMT transcription factors have been described, such as Snail, Slug, Twist, and Zeb, repressing E-cadherin expression in vivo and in various cancer cell lines, including lung, breast, colorectal, and ovarian cancer, thus inducing tumor malignancy[6-8]. It was demonstrated that Snail and Slug could increase invasion of breast, squamous, and pancreatic cancer cells[9-12]. The loss of E-cadherin is known to be a pivotal event, although experimental evidence demonstrates that 6 out of 7 PDAC commercial cell lines maintain E-cadherin expression in the cell membrane. Moreover, the similar expression of EMT markers in PDAC and benign pancreatic ducts[13] increases the relevance of studies aimed at definitively clarifying the role of EMT in PDAC development and progression, with particular attention paid to the expression of E-cadherin.
It is generally recognized that plastic or glass substrates commonly used for cell culture are not representative of the cellular environment found in organisms. Cells cultured as monolayers do not reproduce the structural organization or functional differentiation of the epithelium in vivo[14], and sometimes signaling pathways are fundamentally differently regulated than in polarized structures[15]. In vitro three-dimensional (3D) culture systems reduce the differences between 2D cell cultures and physiological tissues, thereby offering the possibility of investigating aspects of tumor biology and pathophysiology by maintaining a 3D cancer cell arrangement that reflects the in vivo tissue and tumor situation in relation to cell-cell interaction and differentiation patterns[16]. Therefore, 3D cultures, such as the well-established spheroid culture system, could better reflect the in vivo behavior of cells in tumor tissues[17].
As PDAC remains currently one of the most lethal cancers, comprehension of its biology, development, and progression remains crucial for making inroads into this devastating human disease. The aim of this study was to investigate the expression of the main EMT markers in HPAF-II, HPAC, and PL45 PDAC cell lines, grown in either 2D-monolayers or 3D-spheroids. Our goal was to use 3D cultures to bridge the gap between traditional cell cultures and in vivo settings with a method that mimics the 3D structure of living tissue in order to better characterize the phenotype of PDAC cells and, therefore, their behavior. We were particularly interested in understanding if the expression of E-cadherin is affected by these two different cell arrangements, in order to obtain new information on the effective role of this marker in PDAC.
Three human pancreatic cancer cell lines (HPAF-II, HPAC, and PL45) from pancreatic ductal adenocarcinoma (PDAC) (American Type Culture Collection, ATCC) were studied. PDAC cells were cultured in DMEM (Dulbecco’s Modified Eagle Medium) supplemented with 10% heat-inactivated fetal bovine serum (FBS), 2 mmol/L glutamine, antibiotics (100 U/mL penicillin, 0.1 mg/mL streptomycin), and 0.25 μg/mL amphotericin B. Cell viability was determined by trypan blue staining.
To obtain 3D-spheroids, PDAC cells (5 × 10⁴ cells) were seeded in 24-well multiwell plates coated with 1% agarose in DMEM.
Spheroid integrity was verified by phase-contrast imaging after 3 d, 1 wk, and 2 wk, and cell viability in 3D-spheroids was determined by calcein fluorescence. For this purpose, 3D-spheroids were incubated with calcein-AM (3 μg/mL in PBS) for 30 min at 37 °C, 5% CO2 and observed under a fluorescence inverted microscope. In live cells, the nonfluorescent calcein AM is converted to green-fluorescent calcein after acetoxymethyl ester hydrolysis by intracellular esterases. For morphological and molecular evaluations, spheroids were harvested after 10 d. Duplicate samples of PDAC cells grown in 2D-monolayers and 3D-spheroids were analyzed.
To understand the invasive behavior of 3D-spheroids, HPAF-II spheroids were seeded in basement membrane extract (BME) (Geltrex, Life Technologies), following the manufacturer’s instructions. Single 3D-spheroids were suspended in 2% BME in complete DMEM, and then seeded in a 96-well multiwell plate coated with a thick layer of BME. 3D-spheroids were observed under an inverted microscope at different time points and monitored for a 14 d period to detect whether or not they were able to invade the surrounding environment.
HPAF-II, HPAC, and PL45 cells were grown as 2D-monolayers on Petri dishes. At confluence, cells were fixed with a solution containing 2% freshly prepared paraformaldehyde and 2% glutaraldehyde in 0.1 mol/L sodium cacodylate buffer (pH 7.4). 3D-spheroids were harvested and fixed in the same fixative. Both 2D-monolayer cultures and 3D-spheroids, after fixation for 2-4 h at 4 °C, were rinsed twice in cacodylate buffer for 20 min, post-fixed in 1% osmium tetroxide in the same buffer at 0 °C for 30 min, washed in distilled water, and stained en bloc with 2% aqueous uranyl acetate. After dehydration in graded ethanols, 2D-monolayer cultures (in situ on Petri dishes) and 3D-spheroids were embedded in Epon-Araldite resin.
Semi-thin sections 0.5 μm thick were stained with 0.5% toluidine blue in 1% sodium borate and examined using a light microscope (Zeiss Axiophot) for preliminary observations. Ultra-thin sections cut by a Leica Supernova ultramicrotome were stained with lead citrate and observed under a Zeiss EM10 electron microscope.
HPAF-II, HPAC, and PL45 cells were cultured on 12-mm diameter round coverslips into 24-well culture plates. When at the desired confluence, cells were washed in phosphate-buffered saline (PBS), fixed in 4% paraformaldehyde in PBS containing 2% sucrose for 10 min at room temperature, post-fixed in 70% ethanol, and stored at -20 °C until use. 3D-spheroids were fixed for 3 h in the same conditions. Cells grown in 2D-monolayers and 3D-spheroids were then washed in PBS three times and incubated overnight at 4 °C with the primary antibodies anti-E-cadherin (1:2500, Becton Dickinson), anti β-catenin (1:500, Novocastra), anti-N-cadherin (1:200, Santa Cruz), anti-collagen type I (COL-I) (1:2000, Sigma Aldrich), anti-vimentin (1:200, Novocastra), anti-αSMA (1:400, Sigma Aldrich), and anti-podoplanin (15 μg/mL, Sigma Aldrich). Secondary antibodies conjugated with Alexa 488 (1:500, Molecular Probes, Invitrogen) were applied for 1 h at room temperature in PBS containing 25 μmol/L rhodamine-phalloidin in PBS and 0.2% triton X-100 in the dark. Negative controls were incubated that omitted the primary antibody. Finally, cells on coverslips and 3D-spheroids were incubated for 15 min with DAPI (1:100.000, Sigma Aldrich) and mounted onto glass slides using Mowiol. PDAC cells grown in 2D-monolayers or 3D-spheroids were analyzed by confocal microscopy (Olympus FV1000).
Total RNA was isolated by a modification of the acid guanidinium thiocyanate-phenol-chloroform method (Tri-Reagent, Sigma, Italy). One μg of total RNA was reverse-transcribed in 20 μL final volume of reaction mix (Bio-Rad, Segrate-Milan, Italy). mRNA levels for E-cadherin, Snail, Slug, Twist, Zeb1, and Zeb2 were assessed. GAPDH was used as an endogenous control to normalize the differences in the amount of total RNA in each sample. The primer sequences were as follows: GAPDH: sense CCCTTCATTGACCTCAACTACATG, antisense TGGGATTTCCATTGATGACAAGC; E-cadherin: sense GAACGCATTGCCACATACAC, antisense GAATTCGGGCTTGTTGTCAT; Snail: sense CTTCCA GCAGCCCTACGAC, antisense CGGTGGGGTTG AGGATCT; Slug: sense TGTTTGCAAGATCTGCGGC, antisense TGCAGTCAGGGCAAGAAAAA; Twist: sense AGCAAGATTCAGACCCTCAAGCT, antisense CCTGGTAGAGGAAGTCGATGTACCT; Zeb1: sense GAAAGTCATCCAGCCAAATGG, antisense ACTTGGTTCTCAGC TTGGGGAATCA; and Zeb2: sense GCTACACGTTTTGCCTACCGC, antisense CGATTACCTGCTCCTTTGGGTT.
Amplification reactions were conducted in a 96-well plate in a final volume of 20 μL per well containing 10 μL of 1× SYBR Green Supermix (Bio-Rad, Italy), 2 μL of template, and 300 pmol of each primer. Each sample was analyzed in triplicate in a Bioer LineGene 9600. The cycle threshold (Ct) was determined and gene expression levels relative to that of GAPDH were calculated.
Cell lysates were prepared in Tris-HCl 50 mmol/L pH 7.6, 150 mmol/L NaCl, 1% Triton X-100, 5 mmol/L EDTA, 1% SDS, proteases inhibitors, and 1 mmol/L sodium orthovanadate. Lysates were incubated on ice for 30 min and centrifuged at 14000 g, for 10 min at 4 °C to remove cell debris. Cell lysates (40 μg of total proteins) were diluted in SDS-sample buffer, loaded on 10% SDS-polyacrylamide gel, separated under reducing and denaturing conditions at 80 V according to Laemmli, and transferred at 90 V for 90 min to a nitrocellulose membrane in 0.025 mol/L Tris, 192 mmol/L glycine, 20% methanol, and pH 8.3. After electroblotting, the membranes were air dried and blocked for 1 h.
For E-cadherin evaluation on cell lysates, membranes were incubated for 1 h at room temperature in monoclonal antibody to E-cadherin (1:2500, Becton Dickinson) and, after washing, in HRP-conjugated rabbit anti-mouse serum (1:40000 dilution, Sigma, Italy). To confirm equal loading, membranes were reprobed by monoclonal antibody to α-tubulin (1:2000 dilution, Sigma Aldrich). Immunoreactive bands were revealed using the Amplified Opti-4CN or the Opti-4CN substrate Bio-Rad.
Data are expressed as mean ± SD. Since the number of samples in each experimental group was low, we did not analyze our data by inferential statistics; rather, we aimed to measure differences between cells grown in 2D-monolayers or 3D-spheroids by calculating the effect size according to Cohen[18].
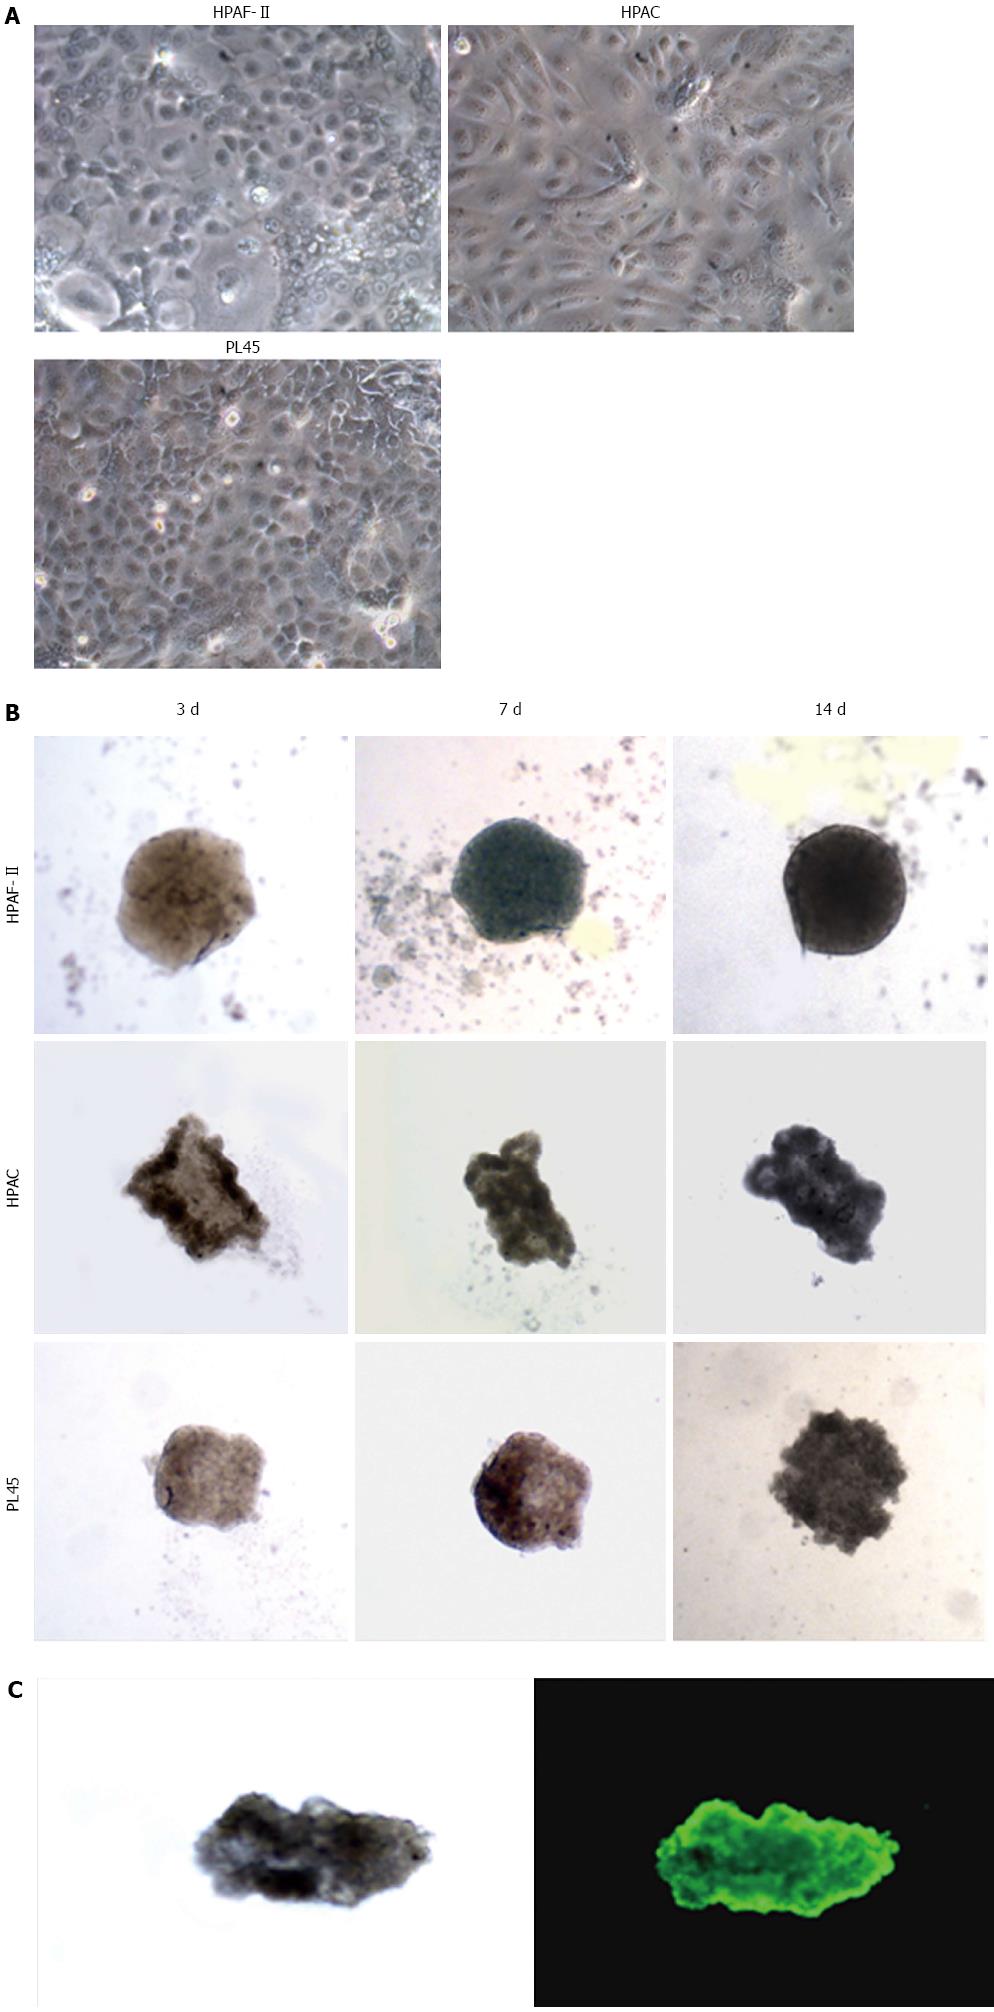
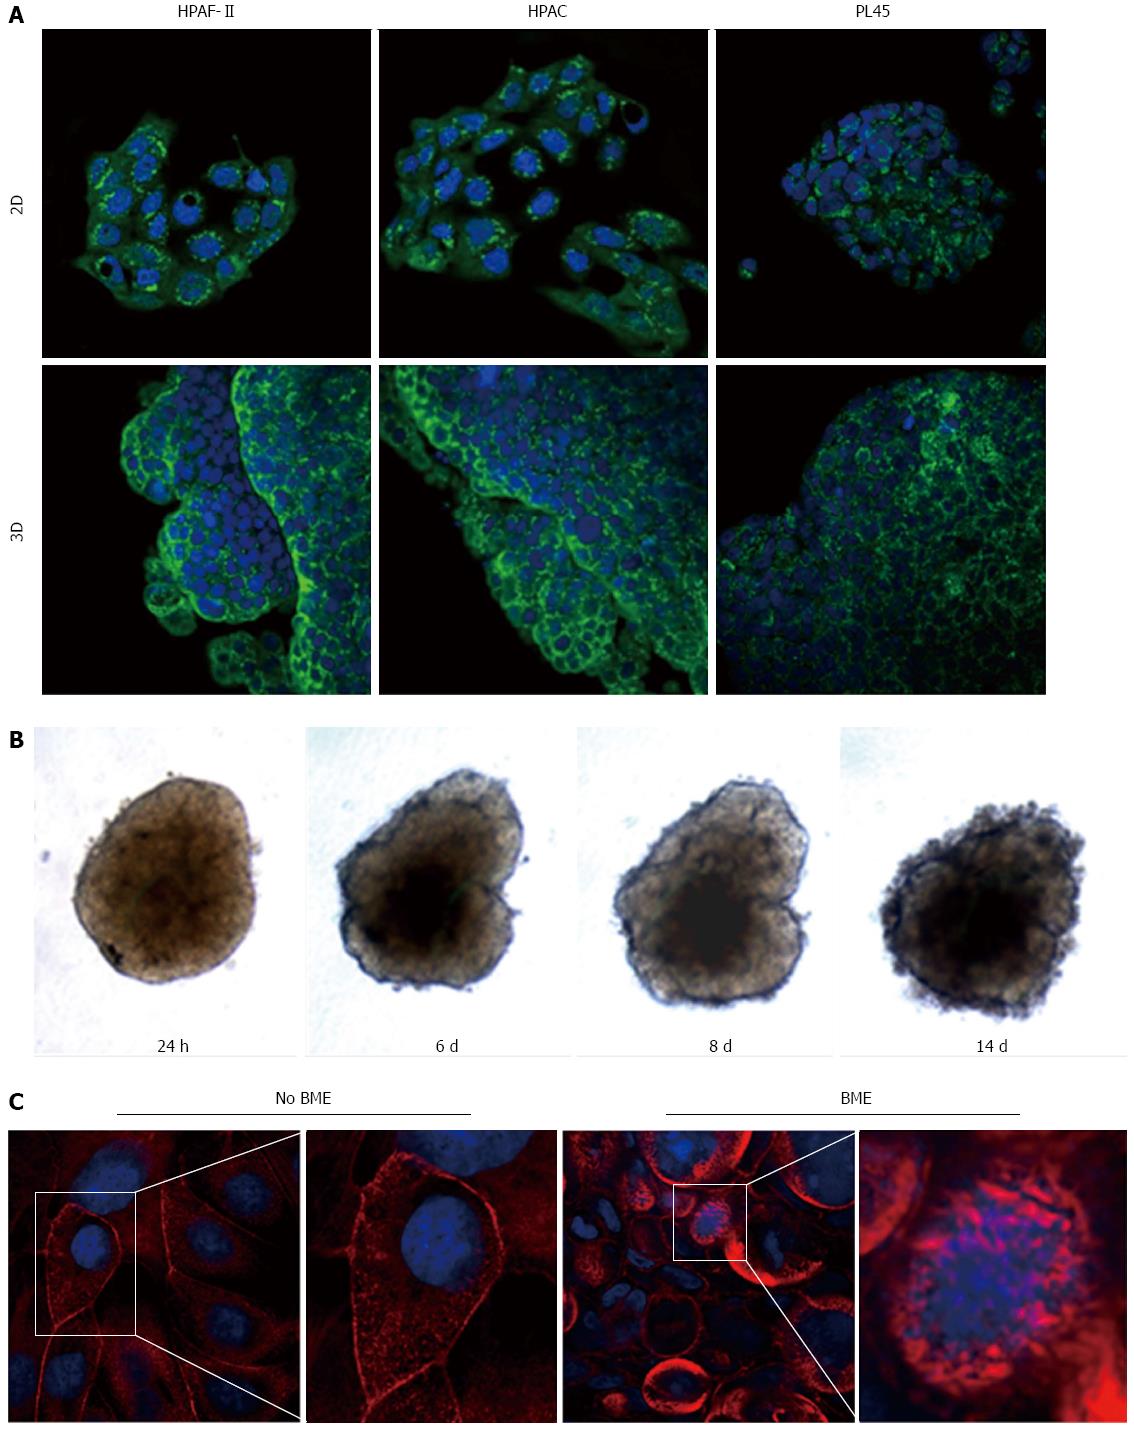
When seeded in agarose-coated wells, PDAC cells formed 3D aggregates that were evident after 40-72 h. HPAF-II, HPAC, and PL45 cells cultured in 2D-monolayers were characterized by an epithelial morphology (Figure 1A). Inverted microscope observation of the 3D-spheroids at different time points showed that, after one week, cell density was increased and the spheroid exhibited a compact structure, with different morphologies in different cell types (Figure 1B). The size of the 3D-spheroids was approximately 300-500 μm. No evident differences were observed after two weeks, and so the spheroids were harvested for molecular and morphological evaluations after 10 d. To assess eventual necrosis in the inner part of the spheroids, possibly due to reduced delivery of nutrients, cells were stained with calcein-AM. Observations via fluorescent microscope revealed that all the cells were metabolically active, as they were all fluorescent (Figure 1C). Cell integrity in 3D-spheroids was also confirmed by transmission electron microscopy (TEM) (Figures 2, 3 and 4).
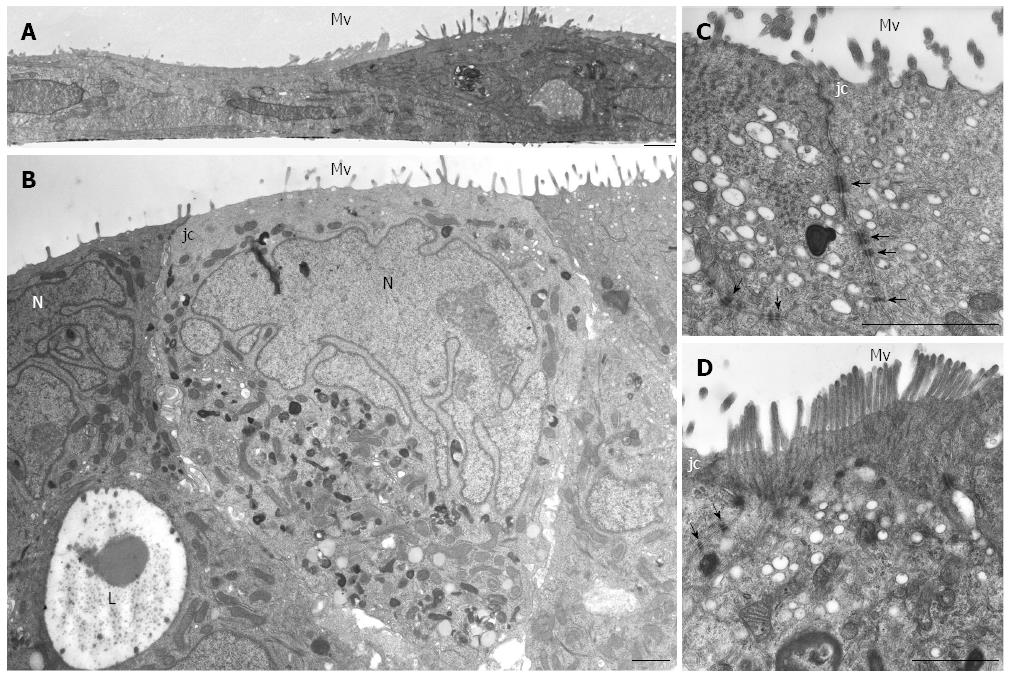
HPAF-II cultured in 2D-monolayers grew as flat layers in which light or small dark cells partially overlapped and arranged with the basolateral membrane adhering to the plastic dish. Cells contained organelles and showed apical microvilli facing the culture medium (Figure 2A). HPAF-II 3D-spheroids showed a compact structure consisting of multiple cell layers, with microvilli extensively covering the apical surfaces of the outer cellular layer (Figure 2B-D). Cells had variable shapes and cytoplasm amount, and sometimes contained mucin granules and small autophagic vacuoles. They also frequently exhibited a pale and markedly segmented nucleus (Figure 2B), with adjacent cells in the outer layer connected by junctional complexes located in the apical-lateral domain and by numerous interdigitations and desmosomes in their lateral domains (Figure 2C and D), which was consistent with cell polarity. The inner part of 3D-spheroid adjacent cells were separated by an evident intercellular space and linked by interdigitations. Additionally, some cells were arranged to delimit lumen-like structures (Figure 2B).
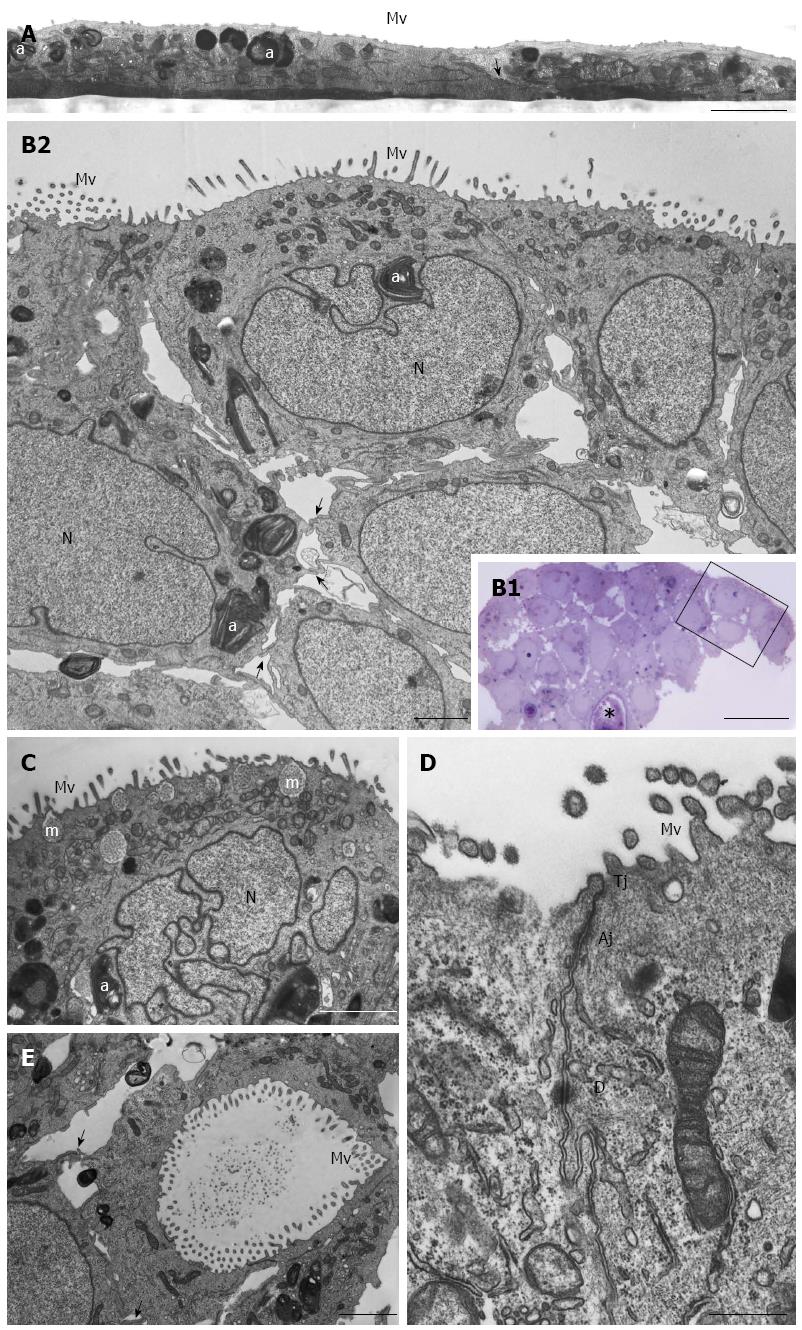
HPAC cells appeared as flat layers of light and dark cells that only partially overlapped and were interdigitated and connected by junctions in some cases. They exhibited short microvilli on the surface facing the culture medium. Cells contained organelles, autophagosomes, and showed other morphological similarities with HPAF-II (Figure 3A). HPAC grown in 3D-spheroids showed a compact organization consisting of multicellular layers (Figure 3B). Epithelial cells of the outer layer presented their apical domain towards the culture medium and were extensively covered with microvilli (Figure 3B2-D). Cell polarity was also evident as Golgi complexes and numerous mitochondria were present in the apical compartment (Figure 3B2 and C); moreover, the cytoplasm occasionally exhibited mucin granules at the apical pole (Figure 3C). Nuclei were located at the opposite side and characterized by widely dispersed chromatin and sometimes by a markedly irregular shape (Figure 3C). HPAC cells in 3D-spheroids exhibited a junctional complex consisting of tight junctions (zonulae occludentes), adherens junctions (zonulae adhaerentes), and desmosomes (maculae adhaerentes) in the apical-lateral domains (Figure 3D). In the internal region of 3D-spheroids, adjacent cells were separated by a more evident intercellular space and were interdigitated with neighboring cells by finger-like projections, without any evident junctional specializations (Figure 3B2). Notably, according to the description of elevated basal autophagy of PDAC cells, numerous autophagosomes were present in the cytoplasm of both the outer and inner regions of 3D-spheroids (Figure 3B2 and C)[19]. In the internal part of HPAC spheroids, some adjoined cells were linked by junctional specializations and arranged in lumen-like structures which appeared polarized with numerous microvilli projecting into the lumen (Figure 3E).
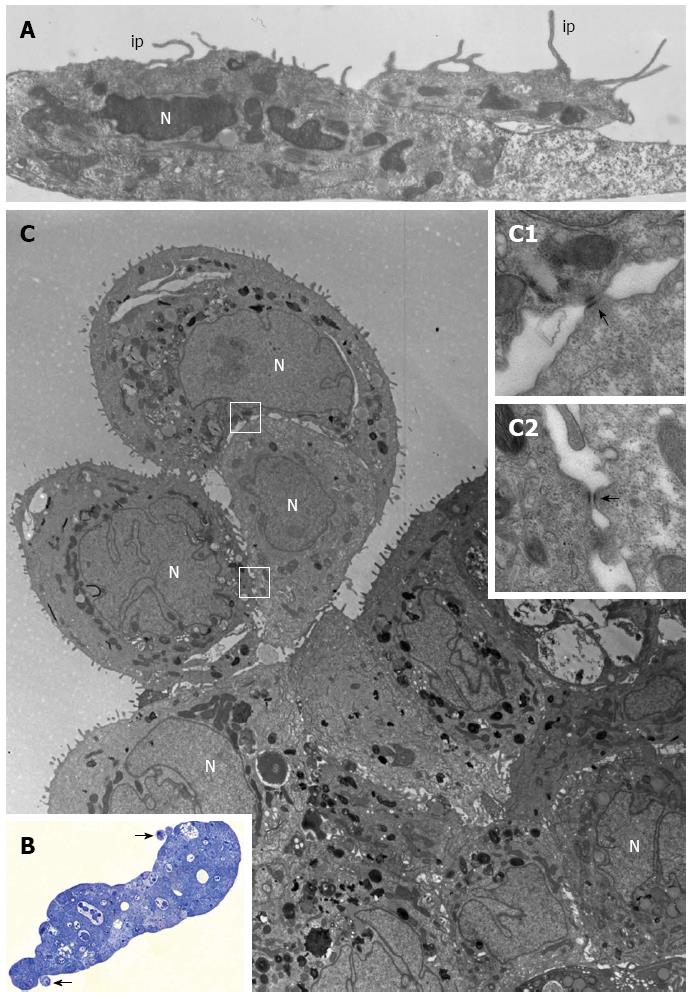
PL45 cells cultured in 2D-monolayers showed a light or dark cytoplasm in a similar manner to HPAF-II and HPAC cells. However, unlike HPAF-II and HPAC grown in 2D-monolayers, some cells showed protrusions of the plasma membrane similar to invadopodia of about 6 μm in length that projected toward the culture medium (Figure 4A).
PL45 grown in 3D-spheroids were arranged in multiple layers (Figure 4B and C) and frequently had markedly irregular nuclei (Figure 4C). In the cytoplasm, lipid droplets, autophagosomes, and numerous mitochondria were mainly located close to the nucleus. Interestingly, small groups of cells linked to each other by desmosomes (Figure 4C; inserts C1 and C2) seemed partially detached from the peripheral area of the spheroid (Figure 4B and C).
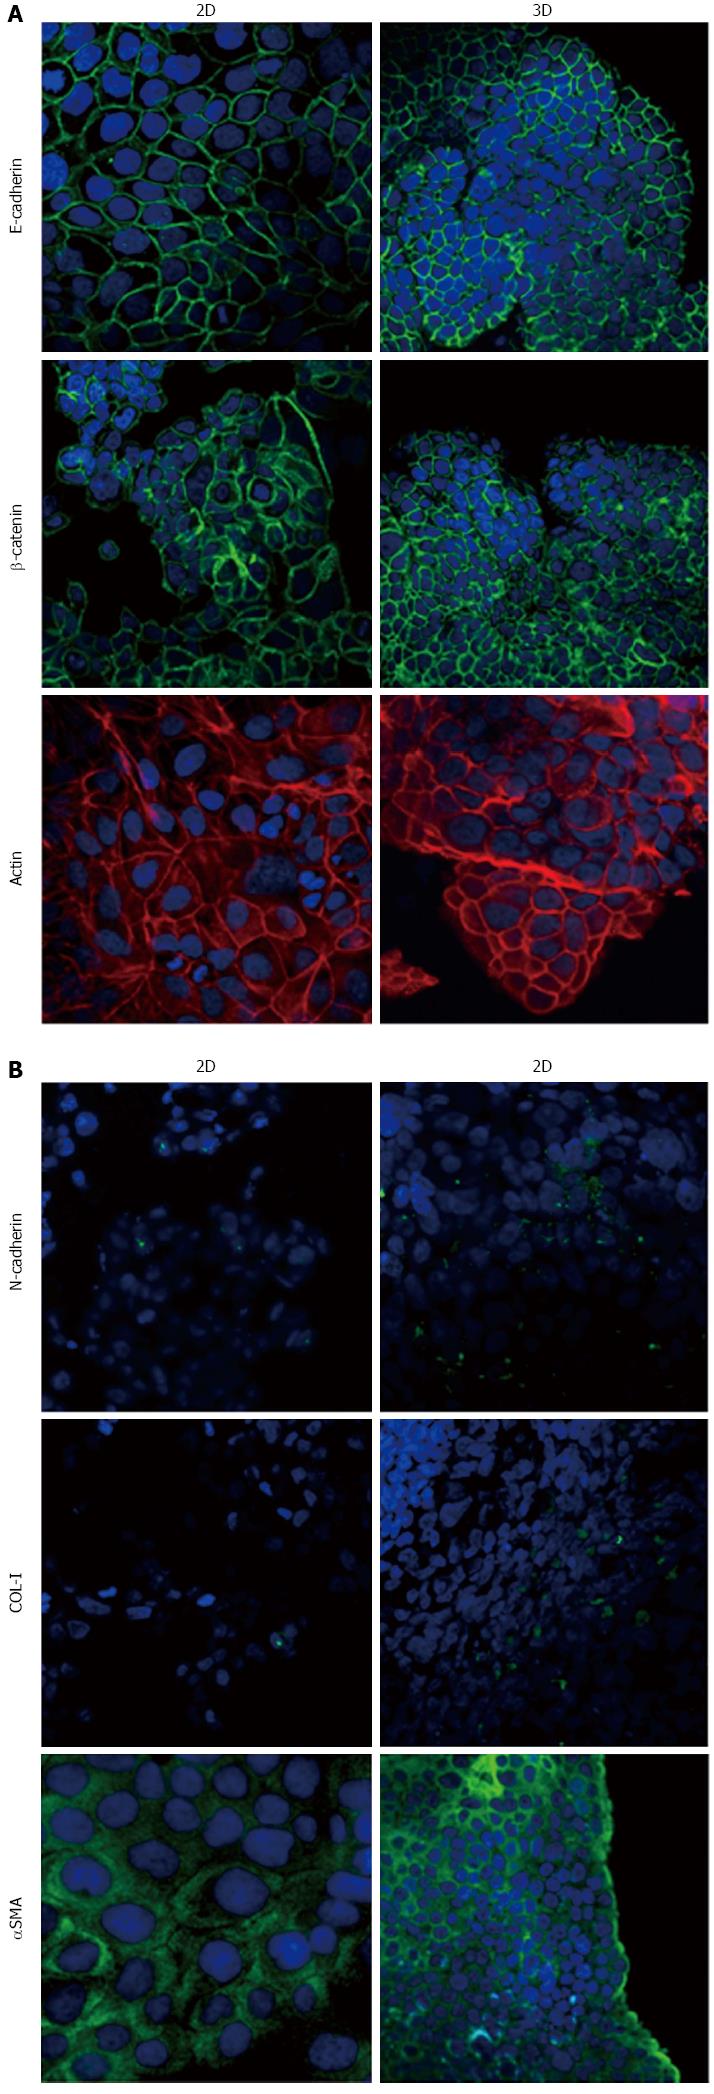
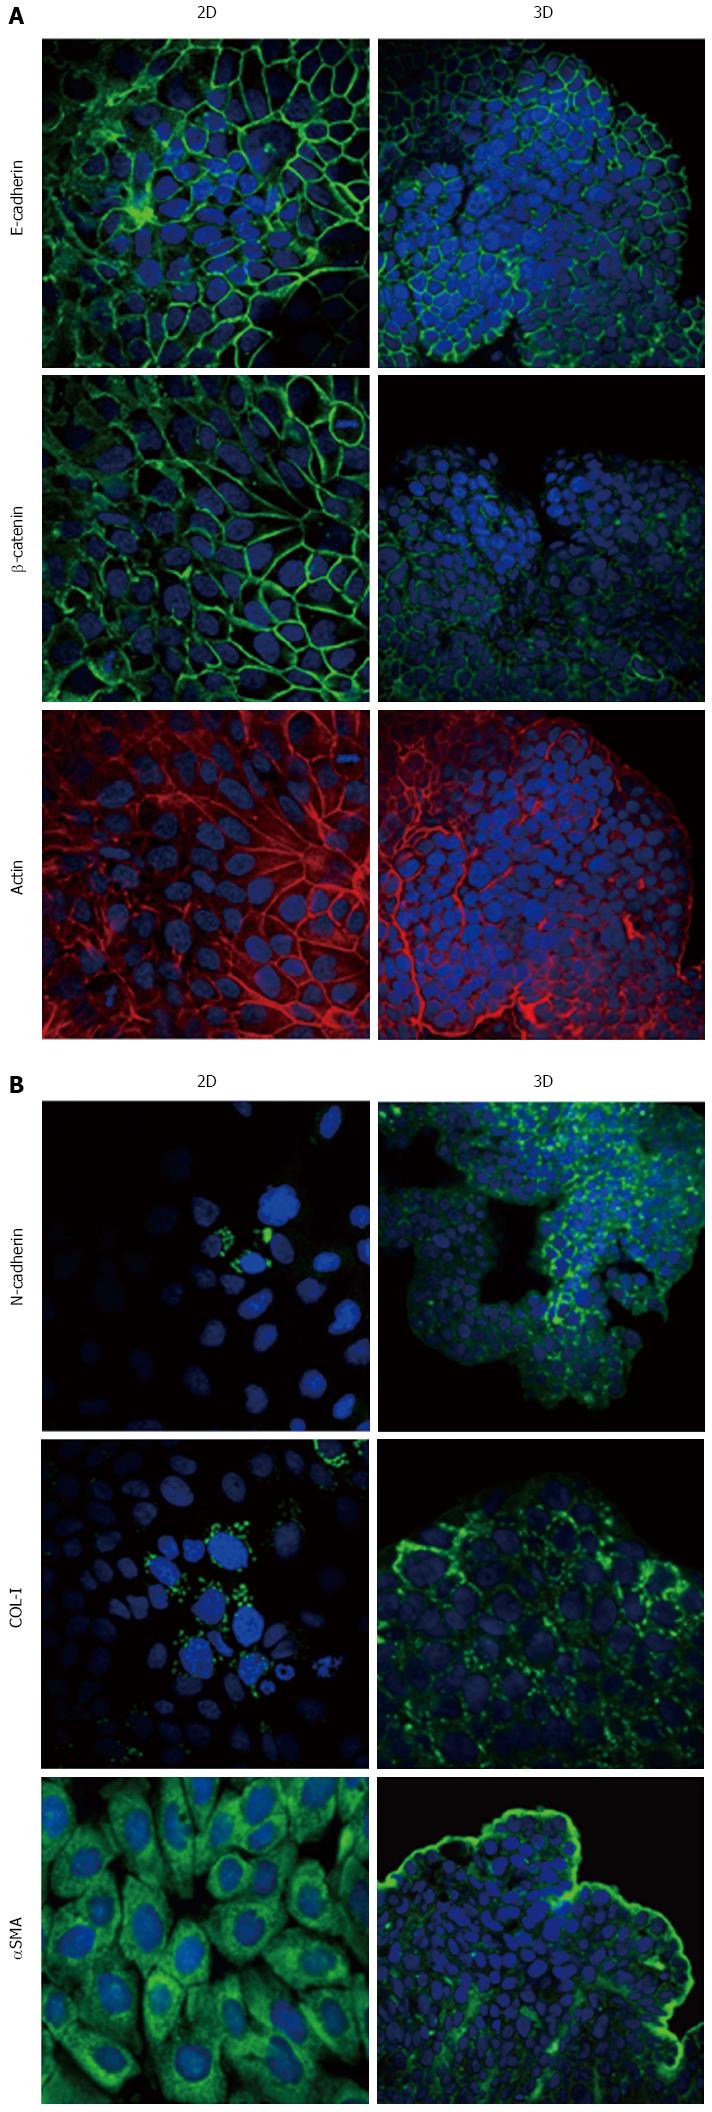
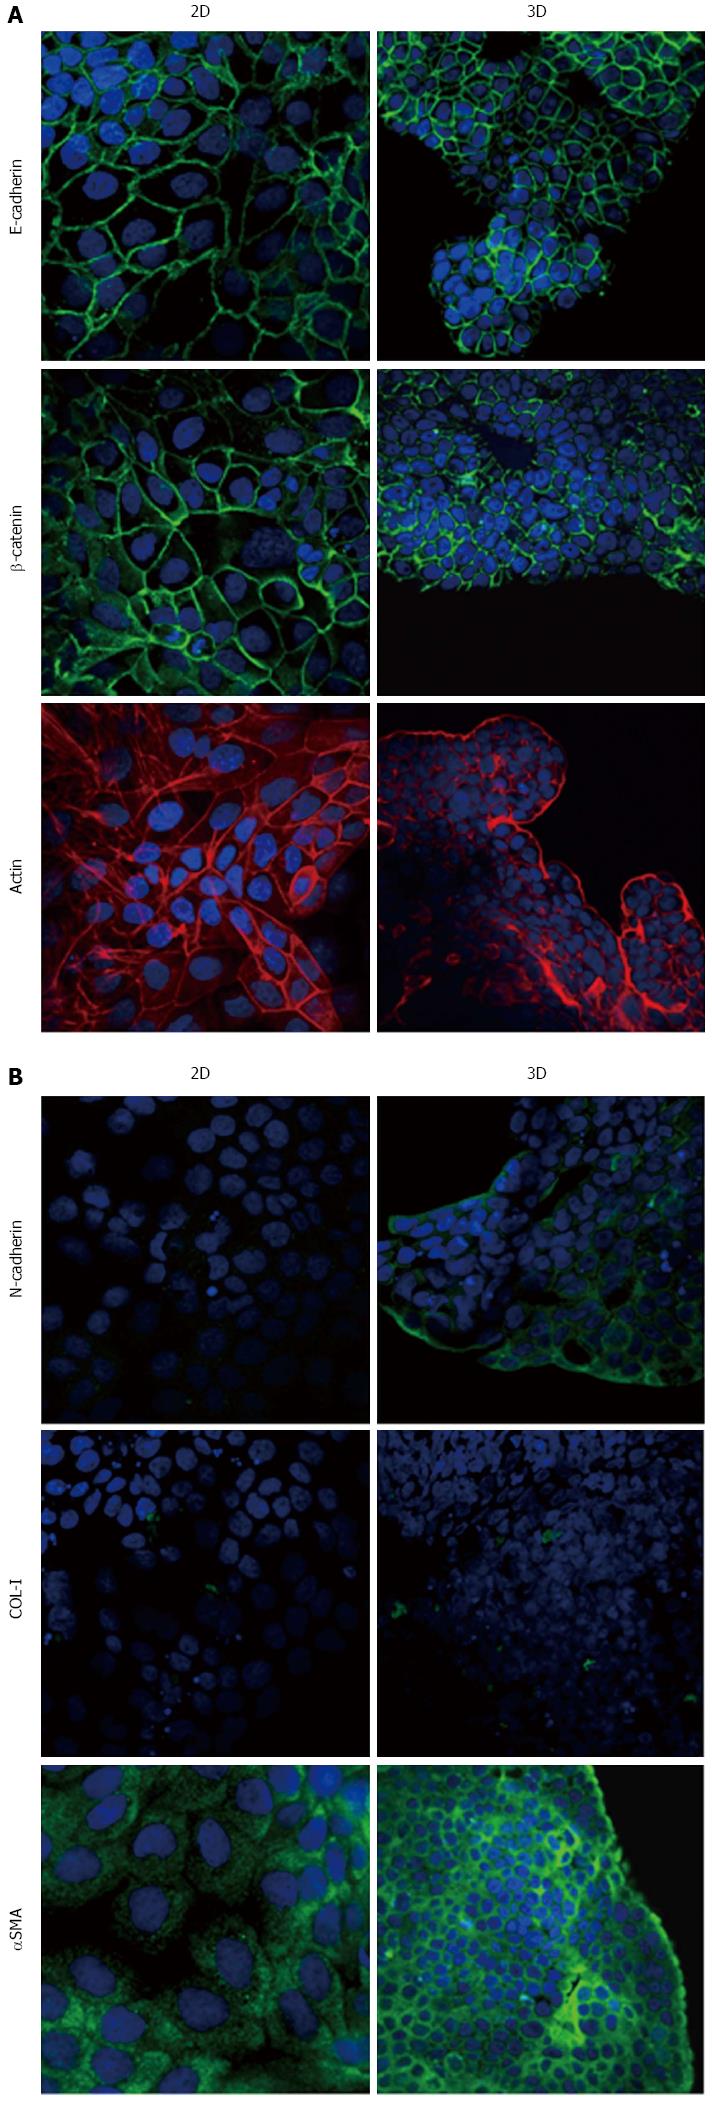
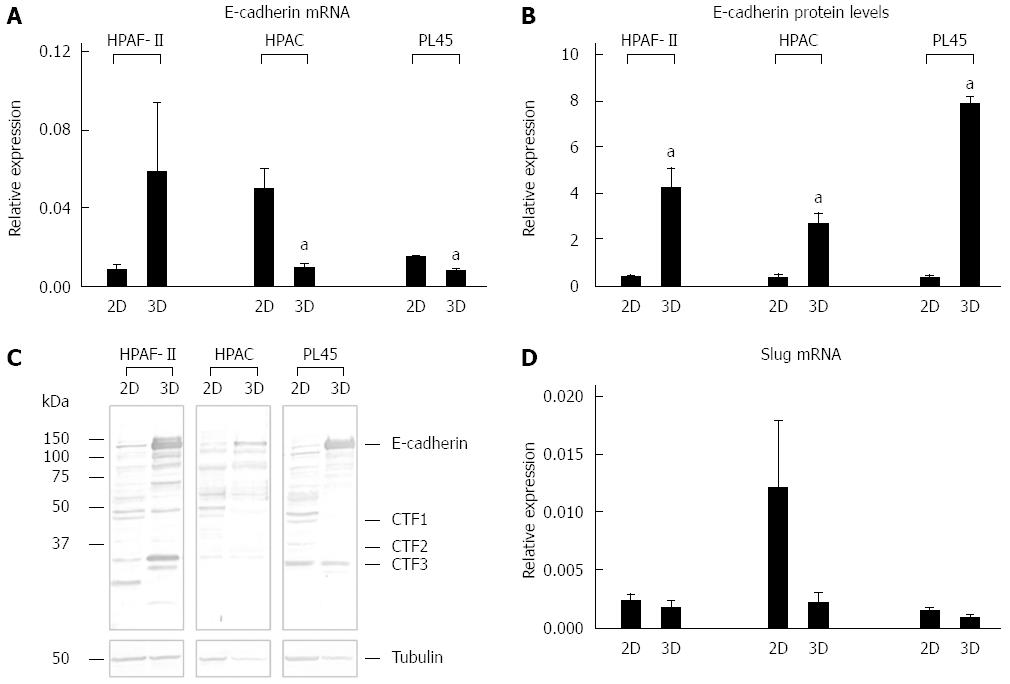
Immunofluorescence analysis revealed that E-cadherin and β-catenin were strongly expressed at cell boundaries in both PDAC 2D-monolayers and 3D-spheroids, suggesting the presence of functional adherens junctions (Figures 5, 6 and 7). In 2D-monolayers, actin filaments were arranged just beneath the plasma membrane, forming the cortical actin, although actin fibers were also found in the cytoplasm. In HPAC and PL45, the presence of actin fibers was even more evident, suggesting focal adhesions which attach to the plastic substrate. In contrast, cortical actin filaments were much more evident in 3D-spheroids, as observed in differentiated epithelial cells (Figures 5A, 6A, and 7A). Gene expression analysis revealed that E-cadherin mRNA levels were highly expressed in 2D-monolayers compared to 3D-spheroids. This difference was evident since the effect size was > 2 (5.68 and 7 in HPAC and PL45 cells, respectively) (Figure 8A). In contrast, Western blot analysis showed that full-length E-cadherin (120 kDa) was expressed to a higher extent in 3D-spheroids (Figure 8B and C). In fact, lysates of HPAF-II, HPAC, and PL45 cells grown in 3D-spheroids contained higher E-cadherin expression when compared to the relative 2D-monolayers (effect size: 6.15, 6.91, and 36.28, respectively), which was consistent with stronger cell adhesion. Moreover, in cells grown in 2D-monolayers, lower full-length E-cadherin levels were paralleled by an increase in E-cadherin degradation fragments that was consistent with cell junction disruption and lower cell adhesion. The molecular weight of some E-cadherin fragments were consistent with CT1, CT2, and CT3, as previously described[20,21].
Using immunofluorescence, the expression of EMT markers was analyzed with respect to the acquisition of a mesenchymal phenotype suggestive of EMT. N-cadherin was almost undetectable in PDAC cells grown as 2D-monolayers and immunoreactivity was mostly diffuse in the cytoplasm. N-cadherin immunoreactivity was more frequent in 3D-spheroids, mostly in the cytoplasm. In HPAC spheroids, N-cadherin was sometimes detected at cell boundaries, which was consistent with the presence of functional adherens junctions containing this “mesenchymal” transmembrane protein. Although COL-I was expressed by very few scattered PDAC cells grown in 2D-monolayers, its expression seemed more frequent in 3D-spheroids, particularly in HPAC cells (Figures 5B, 6B, and 7B). αSMA was evident in both experimental conditions (Figures 5B, 6B, and 7B) in the three considered cell lines. Vimentin was undetectable (data not shown).
The EMT markers Twist, Snail, Zeb1, and Zeb2 were almost undetectable in both experimental conditions (data not shown). Slug was expressed at very low levels in HPAF-II, as well as in PL45 2D-monolayers and 3D-spheroids, and was detected in HPAC at a higher degree in cells grown in 2D-monolayers compared to HPAC in 3D-spheroids (Figure 8D). Low or undetectable mRNA levels of these EMT markers were consistent with a high expression of E-cadherin under both experimental conditions.
Podoplanin was expressed in the cytoplasm of PDAC cells grown in either 2D-monolayers or 3D-spheroids (Figure 9A). Since podoplanin expression was described in cells undergoing collective migration, HPAF-II 3D-spheroids were placed in BME to monitor their morphology during invasion of the surrounding matrix. We did not observe any evident spindle-like projections extending in the BME, but small clusters of cells did seem to detach from the spheroid surface to invade the surrounding environment (Figure 9B). These findings were confirmed by TEM analysis. In these experimental conditions we analyzed phalloidin-stained cells to detect invadopodia. Confocal microscopy revealed the presence of isolated invadopodia, mostly located in the perinuclear region of HPAF-II 3D-spheroids grown without BME. Interestingly, invadopodia seemed more evident in the 3D-spheroids grown in BME (Figure 9C).
EMT is a complex step-wise process characterized by the loss of epithelial adhesion properties following changes in E-cadherin expression patterns, adherens junction disruption, induction of MMPs leading to the disruption of basement membranes, and enhanced migration and invasion[4]. Loss of intercellular adhesion and increased motility promote tumor cell invasion, allowing tumor cells to acquire the capacity to infiltrate surrounding tissue and metastasize at distant sites[22].
An early essential event of EMT is the loss of epithelial phenotype and cell-cell adhesion driven by the down-regulation of E-cadherin, a well-characterized adhesive junction protein expressed in differentiated and polarized epithelial cells. The graded loss of E-cadherin correlates with the aggressiveness of numerous carcinomas and a worsening prognosis, whereas the forced expression of E-cadherin suppresses tumor development in various in vitro and in vivo experimental tumor models[23]. E-cadherin down-regulation leads to the release of the E-cadherin/β-catenin complex from the plasma membrane, the disruption of cell-cell junctions[24], and to β-catenin nuclear translocation, where it may function as a transcriptional co-activator[25].
It has also been shown that pancreatic cancers display a reduced expression of E-cadherin and an increased expression of N-cadherin which, in primary tumors, are significantly related to histological grade[26] and the invasive/undifferentiated phenotype[27]. However, in 6 out of 7 PDAC commercial cell lines, the expression of E-cadherin was maintained in the cell membrane[13], increasing the relevance of studies aimed at characterizing the phenotype of PDAC cells in relation to the expression of EMT markers, in order to define the role of EMT in PDAC development and progression.
Our immunofluorescence analysis data show that HPAF-II, HPAC, and PL45 cells grown in 2D-monolayers and 3D-spheroids are characterized by strong E-cadherin and β-catenin immunoreactivity at the cell-cell boundary, suggesting that adherent junctions are retained by PDAC cells under both experimental conditions. Gene expression analysis showed that E-cadherin mRNA levels tended to increase in HPAF-II cells grown in 3D-spheroids, but were decreased in HPAC and PL45 spheroids compared to 2D-monolayers. Conversely, E-cadherin was upregulated in PDAC 3D-spheroids at the protein level, suggesting that PDAC cells grown in 3D-spheroids have stronger cell adhesion. The electrophoretic pattern revealed cleavage fragments of E-cadherin in PDAC grown in monolayers, suggesting that the protein underwent partial digestion and was therefore less effective in providing strong cell-cell adhesion under these conditions. However, full length E-cadherin was detected in 3D-spheroids, supporting a stronger cohesion which likely allows and favors collective migration[28]. The presence of E-cadherin degradation fragments may explain the apparent discrepancy between E-cadherin mRNA and protein levels, since they can be generated by post-translational modifications.
The epithelial differentiated phenotype of HPAF-II, HPAC, and PL45 was strongly confirmed, especially in 3D-spheroids, using a transmission electron microscope. In fact, PDAC cells grown in 3D-spheroids maintained the junctional complexes and cell polarity typical of columnar simple epithelium lining pancreatic secretory ducts, and exhibited many microvilli on the apical surface. This finding is not in conflict with the behavior of these cells; as previously demonstrated, PDAC cells, even if characterized by a well-differentiated phenotype, are highly malignant and invasive[29].
Our results point to new and important information in understanding the phenotype of these cancer cells in relation to the expression of mesenchymal markers. We showed that PDAC cells in 3D-spheroids retain the expression of the E-cadherin/β-catenin complex at cell boundaries, while N-cadherin is occasionally expressed at the plasma membrane. This finding suggests not only that PDAC cells in 3D-spheroids have undergone the “cadherin switch” typical for EMT, but also that E-cadherin-mediated cell adhesion is retained and probably strengthened by functional adherens cell junctions containing N-cadherin, especially in HPAC cells.
Confocal microscopy confirmed that HPAF-II, HPAC, and PL45 exhibit a differentiated epithelial phenotype, as previously suggested[30,31], but some differences in the expression of EMT markers were detected. In particular, mesenchymal markers seemed more evident in HPAC and PL45 cells, with PL45 being the least differentiated. This differing profile could be responsible for the different behavior, but a relationship between differentiation grade, cell migration, and invasion potential has not yet been defined[32].
The concomitant expression of mesenchymal markers, such as αSMA, in both 2D-monolayers and 3D-spheroids supports the hypothesis that PDAC cells underwent EMT. The expression of EMT markers such as Twist, Snail, Zeb1, and Zeb2 was almost undetectable, in line with the high expression of E-cadherin and the maintenance of adherens junctions. Slug was detected in PDAC cells at low levels, particularly in HPAC cells, in both 2D-monolayers and 3D-spheroids. An inverse correlation between Snail and E-cadherin at the mRNA level in pancreatic cancer cells was previously reported, while Slug expression in pancreatic cancer was reported to have no evident relationship with decreased expression of E-cadherin[7]. To explain this apparent inconsistency, it was suggested that the transient expression of Snail might be involved in inducing the invasion process, whereas Slug might be involved in the maintenance of the migratory invasive phenotype[7].
Some cells in 3D-spheroids expressed COL-I, a protein typical of mesenchymal-like cells. We feel this is an interesting finding that demonstrates the relevance of the 3D arrangement in determining cell phenotype and, therefore, supports the importance of 3D experimental models in cancer research.
E-cadherin expression and functional adherens junctions seem more evident in 3D-spheroids, suggesting that higher cell adhesion could favor collective cell migration in PDAC cells by linking them together and ensuring tissue integrity during collective cell migration. The hypothesis of PDAC cells moving cohesively in a collective migration is also supported by the observation that no single invading cells were previously detected in 3D reconstructed models, indicating that single cell invasion does not occur in PDAC. Moreover, increased E-cadherin was shown in the leading edge of migrating epithelial sheets[33], supporting collective migration for these cancer cells. In contrast with individually migrating cells, during collective migration the rear of the front cell retains intact cell-cell junctions to the successor cell, thereby mechanically holding the cells together and augmenting the efficiency of paracrine cell-cell signaling and multicellular coordination[34,35].
Podoplanin is a small mucin-like protein up-regulated in a number of different cancers, suggesting a role in tumor progression[36-39]. Although the physiological function of podoplanin is still unknown and its functional contribution to tumor progression has remained elusive, podoplanin expression was observed in cells invaded by collective migration[40]. Results from immunofluorescence analysis show podoplanin expression in HPAF-II, HPAC, and PL45, according to the hypothesis of collective invasion of PDAC cells. This is consistent with the evidence of small clusters of cells detaching from spheroid surfaces observed at TEM, and with the results of the behavior of HPAF-II spheroids in BME, showing that spindle-like projections extending in the BME were not evident, but small groups of cells did detach from the spheroid surface to invade the surrounding matrix. Furthermore, we detected frequent invadopodia, known as specialized podosomes, which release matrix metalloproteinases and characterize collectively invading cancer cells[41]. These invadopodia were more evident in the presence of BME, as well as being evident under TEM.
Considered as a whole, our data could contribute to clarifying the role of EMT in PDAC progression, provide additional correlative evidence that PDAC cells express EMT markers, and point to relevant differences in the phenotype of PDAC cells grown in 3D-spheroids. In fact, under these experimental conditions, PDAC cells are characterized by functional adherens junctions and concomitant expression of mesenchymal markers, such as N-cadherin and COL-I, which are almost undetectable in PDAC cells grown in 2D-monolayers.
Our results support the use of 3D cultures in biomedical research to bridge the gap between traditional cell cultures and in vivo settings in order to more clearly understand the biology of PDAC[14-17,42]. Since 3D cultures seem to provide excellent information on PDAC cell phenotype[43,44], they could represent a pre-clinical model for identifying and validating tumor markers, as well as allowing for the study of new therapeutic tools for PDAC.
We would like to thank Karine Winter Beatty (University of Milan) for her revision of the text.
The functions of living tissues can be mimicked in three-dimensional (3D) cell cultures, thereby providing a method of decoding the information encoded in the tissue architecture. The authors analyzed the effect of 3D-arrangement on the expression of some key markers of epithelial-to-mesenchymal transition (EMT) in pancreatic adenocarcinoma (PDAC) cells cultured in either 2D-monolayers or 3D-spheroids.
Although 3D-cell cultures represent a well-established experimental condition to study the effect of 3D-arrangement on cell phenotype in different cell types, few studies have been performed using 3D-cell cultures of PDAC cells. Some discrepancies were described in the expression of E-cadherin in PDAC commercial cell lines and tissue fragments, increasing the relevance of studies aimed at characterizing the phenotype of PDAC cells in relation to the expression of EMT markers.
The overall information provided by this study supports the use of 3D-cultures in biomedical research to bridge the gap between traditional cell cultures and in vivo settings. This approach places cultured cells in an environment that more closely represents and mimics the complex 3D structure of living tissues, in order to more clearly understand the biology of PDAC. The results show that a 3D-cell culture model could provide deeper insight into understanding the biology of PDAC, thereby allowing for the detection of important differences in the phenotype of PDAC cells grown in 3D-spheroids. This study contributes to the clarification EMT’s role in PDAC progression, and provides additional correlative evidence of EMT marker expression in PDAC cells.
3D cultures offer a potential pre-clinical model for identifying and validating tumor markers, as well as allowing for the study of new molecular tools to inhibit signaling pathways and target EMT transcription factors.
This manuscript describes EMT phenomena in 3D-cell cultures using three kinds of pancreatic cancer cell lines. The authors investigated ultrastructural characterization of EMT with transmission electron microscopy and expression of EMT-associated proteins, such as αSMA and E-cadherin. A marked EMT phenomenon was observed in 3D-cell cultures compared to 2D cultures. The results are very interesting.
P- Reviewer: Clemens DL, Miyoshi E, Wei D S- Editor: Ma YJ L- Editor: Rutherford A E- Editor: Ma S
| 1. | Siegel R, Naishadham D, Jemal A. Cancer statistics, 2013. CA Cancer J Clin. 2013;63:11-30. [RCA] [PubMed] [DOI] [Full Text] [Cited by in Crossref: 9215] [Cited by in RCA: 9856] [Article Influence: 821.3] [Reference Citation Analysis (4)] |
| 2. | Li D, Xie K, Wolff R, Abbruzzese JL. Pancreatic cancer. Lancet. 2004;363:1049-1057. [RCA] [PubMed] [DOI] [Full Text] [Cited by in Crossref: 1481] [Cited by in RCA: 1545] [Article Influence: 73.6] [Reference Citation Analysis (0)] |
| 3. | Ghaneh P, Costello E, Neoptolemos JP. Biology and management of pancreatic cancer. Gut. 2007;56:1134-1152. [RCA] [PubMed] [DOI] [Full Text] [Cited by in Crossref: 84] [Cited by in RCA: 204] [Article Influence: 11.3] [Reference Citation Analysis (1)] |
| 4. | Rhim AD, Mirek ET, Aiello NM, Maitra A, Bailey JM, McAllister F, Reichert M, Beatty GL, Rustgi AK, Vonderheide RH. EMT and dissemination precede pancreatic tumor formation. Cell. 2012;148:349-361. [RCA] [PubMed] [DOI] [Full Text] [Cited by in Crossref: 1400] [Cited by in RCA: 1667] [Article Influence: 128.2] [Reference Citation Analysis (0)] |
| 5. | Thiery JP. Epithelial-mesenchymal transitions in tumour progression. Nat Rev Cancer. 2002;2:442-454. [RCA] [PubMed] [DOI] [Full Text] [Cited by in Crossref: 4877] [Cited by in RCA: 5118] [Article Influence: 222.5] [Reference Citation Analysis (0)] |
| 6. | Kalluri R, Weinberg RA. The basics of epithelial-mesenchymal transition. J Clin Invest. 2009;119:1420-1428. [RCA] [PubMed] [DOI] [Full Text] [Cited by in Crossref: 6575] [Cited by in RCA: 7914] [Article Influence: 494.6] [Reference Citation Analysis (0)] |
| 7. | Hotz B, Arndt M, Dullat S, Bhargava S, Buhr HJ, Hotz HG. Epithelial to mesenchymal transition: expression of the regulators snail, slug, and twist in pancreatic cancer. Clin Cancer Res. 2007;13:4769-4776. [RCA] [PubMed] [DOI] [Full Text] [Cited by in Crossref: 299] [Cited by in RCA: 336] [Article Influence: 18.7] [Reference Citation Analysis (0)] |
| 8. | Celesti G, Di Caro G, Bianchi P, Grizzi F, Basso G, Marchesi F, Doni A, Marra G, Roncalli M, Mantovani A. Presence of Twist1-positive neoplastic cells in the stroma of chromosome-unstable colorectal tumors. Gastroenterology. 2013;145:647-57.e15. [RCA] [PubMed] [DOI] [Full Text] [Cited by in Crossref: 47] [Cited by in RCA: 46] [Article Influence: 3.8] [Reference Citation Analysis (0)] |
| 9. | Zhang K, Chen D, Jiao X, Zhang S, Liu X, Cao J, Wu L, Wang D. Slug enhances invasion ability of pancreatic cancer cells through upregulation of matrix metalloproteinase-9 and actin cytoskeleton remodeling. Lab Invest. 2011;91:426-438. [RCA] [PubMed] [DOI] [Full Text] [Full Text (PDF)] [Cited by in Crossref: 54] [Cited by in RCA: 56] [Article Influence: 4.0] [Reference Citation Analysis (0)] |
| 10. | Joseph MJ, Dangi-Garimella S, Shields MA, Diamond ME, Sun L, Koblinski JE, Munshi HG. Slug is a downstream mediator of transforming growth factor-beta1-induced matrix metalloproteinase-9 expression and invasion of oral cancer cells. J Cell Biochem. 2009;108:726-736. [RCA] [PubMed] [DOI] [Full Text] [Cited by in Crossref: 58] [Cited by in RCA: 71] [Article Influence: 4.4] [Reference Citation Analysis (0)] |
| 11. | Sun L, Diamond ME, Ottaviano AJ, Joseph MJ, Ananthanarayan V, Munshi HG. Transforming growth factor-beta 1 promotes matrix metalloproteinase-9-mediated oral cancer invasion through snail expression. Mol Cancer Res. 2008;6:10-20. [RCA] [PubMed] [DOI] [Full Text] [Cited by in RCA: 112] [Reference Citation Analysis (0)] |
| 12. | Côme C, Magnino F, Bibeau F, De Santa Barbara P, Becker KF, Theillet C, Savagner P. Snail and slug play distinct roles during breast carcinoma progression. Clin Cancer Res. 2006;12:5395-5402. [RCA] [PubMed] [DOI] [Full Text] [Cited by in Crossref: 186] [Cited by in RCA: 199] [Article Influence: 10.5] [Reference Citation Analysis (0)] |
| 13. | Cates JM, Byrd RH, Fohn LE, Tatsas AD, Washington MK, Black CC. Epithelial-mesenchymal transition markers in pancreatic ductal adenocarcinoma. Pancreas. 2009;38:e1-e6. [RCA] [PubMed] [DOI] [Full Text] [Full Text (PDF)] [Cited by in Crossref: 56] [Cited by in RCA: 61] [Article Influence: 3.8] [Reference Citation Analysis (0)] |
| 14. | Hanahan D, Weinberg RA. The hallmarks of cancer. Cell. 2000;100:57-70. [RCA] [PubMed] [DOI] [Full Text] [Cited by in Crossref: 51728] [Cited by in RCA: 47153] [Article Influence: 3368.1] [Reference Citation Analysis (5)] |
| 15. | Bissell MJ. Architecture Is the Message: The role of extracellular matrix and 3-D structure in tissue-specific gene expression and breast cancer. Pezcoller Found J. 2007;16:2-17. [PubMed] |
| 16. | Kunz-Schughart LA, Knuechel R. Tumor-associated fibroblasts (part I): Active stromal participants in tumor development and progression? Histol Histopathol. 2002;17:599-621. [RCA] [PubMed] [DOI] [Full Text] [Cited by in Crossref: 241] [Cited by in RCA: 236] [Article Influence: 8.7] [Reference Citation Analysis (0)] |
| 17. | Eritja N, Dolcet X, Matias-Guiu X. Three-dimensional epithelial cultures: a tool to model cancer development and progression. Histol Histopathol. 2013;28:1245-1256. [RCA] [PubMed] [DOI] [Full Text] [Cited by in RCA: 6] [Reference Citation Analysis (0)] |
| 18. | Parker RI, Hagan-Burke S. Useful effect size interpretations for single case research. Behav Ther. 2007;38:95-105. [PubMed] |
| 19. | Yang S, Wang X, Contino G, Liesa M, Sahin E, Ying H, Bause A, Li Y, Stommel JM, Dell’antonio G. Pancreatic cancers require autophagy for tumor growth. Genes Dev. 2011;25:717-729. [RCA] [PubMed] [DOI] [Full Text] [Cited by in Crossref: 1005] [Cited by in RCA: 1192] [Article Influence: 85.1] [Reference Citation Analysis (0)] |
| 20. | David JM, Rajasekaran AK. Dishonorable discharge: the oncogenic roles of cleaved E-cadherin fragments. Cancer Res. 2012;72:2917-2923. [RCA] [PubMed] [DOI] [Full Text] [Cited by in Crossref: 110] [Cited by in RCA: 138] [Article Influence: 10.6] [Reference Citation Analysis (0)] |
| 21. | Ferber EC, Kajita M, Wadlow A, Tobiansky L, Niessen C, Ariga H, Daniel J, Fujita Y. A role for the cleaved cytoplasmic domain of E-cadherin in the nucleus. J Biol Chem. 2008;283:12691-12700. [RCA] [PubMed] [DOI] [Full Text] [Full Text (PDF)] [Cited by in Crossref: 126] [Cited by in RCA: 122] [Article Influence: 7.2] [Reference Citation Analysis (0)] |
| 22. | Lee JM, Dedhar S, Kalluri R, Thompson EW. The epithelial-mesenchymal transition: new insights in signaling, development, and disease. J Cell Biol. 2006;172:973-981. [RCA] [PubMed] [DOI] [Full Text] [Full Text (PDF)] [Cited by in Crossref: 1482] [Cited by in RCA: 1597] [Article Influence: 84.1] [Reference Citation Analysis (0)] |
| 23. | Nelson WJ, Nusse R. Convergence of Wnt, beta-catenin, and cadherin pathways. Science. 2004;303:1483-1487. [RCA] [PubMed] [DOI] [Full Text] [Cited by in Crossref: 1944] [Cited by in RCA: 2018] [Article Influence: 96.1] [Reference Citation Analysis (0)] |
| 24. | Marambaud P, Shioi J, Serban G, Georgakopoulos A, Sarner S, Nagy V, Baki L, Wen P, Efthimiopoulos S, Shao Z. A presenilin-1/gamma-secretase cleavage releases the E-cadherin intracellular domain and regulates disassembly of adherens junctions. EMBO J. 2002;21:1948-1956. [RCA] [PubMed] [DOI] [Full Text] [Cited by in Crossref: 557] [Cited by in RCA: 558] [Article Influence: 24.3] [Reference Citation Analysis (0)] |
| 25. | van Es JH, Barker N, Clevers H. You Wnt some, you lose some: oncogenes in the Wnt signaling pathway. Curr Opin Genet Dev. 2003;13:28-33. [RCA] [PubMed] [DOI] [Full Text] [Cited by in Crossref: 183] [Cited by in RCA: 170] [Article Influence: 7.7] [Reference Citation Analysis (0)] |
| 26. | Nakajima S, Doi R, Toyoda E, Tsuji S, Wada M, Koizumi M, Tulachan SS, Ito D, Kami K, Mori T. N-cadherin expression and epithelial-mesenchymal transition in pancreatic carcinoma. Clin Cancer Res. 2004;10:4125-4133. [RCA] [PubMed] [DOI] [Full Text] [Cited by in Crossref: 291] [Cited by in RCA: 347] [Article Influence: 17.4] [Reference Citation Analysis (0)] |
| 27. | Joo YE, Rew JS, Park CS, Kim SJ. Expression of E-cadherin, alpha- and beta-catenins in patients with pancreatic adenocarcinoma. Pancreatology. 2002;2:129-137. [RCA] [PubMed] [DOI] [Full Text] [Cited by in Crossref: 68] [Cited by in RCA: 76] [Article Influence: 3.3] [Reference Citation Analysis (0)] |
| 28. | Yilmaz M, Christofori G. Mechanisms of motility in metastasizing cells. Mol Cancer Res. 2010;8:629-642. [RCA] [PubMed] [DOI] [Full Text] [Cited by in Crossref: 333] [Cited by in RCA: 340] [Article Influence: 22.7] [Reference Citation Analysis (0)] |
| 29. | Funel N, Costa F, Pettinari L, Taddeo A, Sala A, Chiriva-Internati M, Cobos E, Colombo G, Milzani A, Campani D. Ukrain affects pancreas cancer cell phenotype in vitro by targeting MMP-9 and intra-/extracellular SPARC expression. Pancreatology. 2010;10:545-552. [RCA] [PubMed] [DOI] [Full Text] [Cited by in Crossref: 14] [Cited by in RCA: 13] [Article Influence: 0.9] [Reference Citation Analysis (0)] |
| 30. | Gagliano N, Volpari T, Clerici M, Pettinari L, Barajon I, Portinaro N, Colombo G, Milzani A, Dalle-Donne I, Martinelli C. Pancreatic cancer cells retain the epithelial-related phenotype and modify mitotic spindle microtubules after the administration of ukrain in vitro. Anticancer Drugs. 2012;23:935-946. [RCA] [PubMed] [DOI] [Full Text] [Cited by in Crossref: 8] [Cited by in RCA: 8] [Article Influence: 0.7] [Reference Citation Analysis (0)] |
| 31. | Rajasekaran SA, Gopal J, Espineda C, Ryazantsev S, Schneeberger EE, Rajasekaran AK. HPAF-II, a cell culture model to study pancreatic epithelial cell structure and function. Pancreas. 2004;29:e77-e83. [PubMed] |
| 32. | Deer EL, González-Hernández J, Coursen JD, Shea JE, Ngatia J, Scaife CL, Firpo MA, Mulvihill SJ. Phenotype and genotype of pancreatic cancer cell lines. Pancreas. 2010;39:425-435. [RCA] [PubMed] [DOI] [Full Text] [Full Text (PDF)] [Cited by in Crossref: 751] [Cited by in RCA: 728] [Article Influence: 48.5] [Reference Citation Analysis (0)] |
| 33. | Bronsert P, Enderle-Ammour K, Bader M, Timme S, Kuehs M, Csanadi A, Kayser G, Kohler I, Bausch D, Hoeppner J. Cancer cell invasion and EMT marker expression: a three-dimensional study of the human cancer-host interface. J Pathol. 2014;234:410-422. [RCA] [PubMed] [DOI] [Full Text] [Cited by in Crossref: 198] [Cited by in RCA: 247] [Article Influence: 22.5] [Reference Citation Analysis (0)] |
| 34. | Hwang S, Zimmerman NP, Agle KA, Turner JR, Kumar SN, Dwinell MB. E-cadherin is critical for collective sheet migration and is regulated by the chemokine CXCL12 protein during restitution. J Biol Chem. 2012;287:22227-22240. [RCA] [PubMed] [DOI] [Full Text] [Cited by in Crossref: 34] [Cited by in RCA: 35] [Article Influence: 2.7] [Reference Citation Analysis (0)] |
| 35. | Friedl P, Wolf K. Plasticity of cell migration: a multiscale tuning model. J Cell Biol. 2010;188:11-19. [RCA] [PubMed] [DOI] [Full Text] [Full Text (PDF)] [Cited by in Crossref: 976] [Cited by in RCA: 1015] [Article Influence: 63.4] [Reference Citation Analysis (0)] |
| 36. | Schacht V, Dadras SS, Johnson LA, Jackson DG, Hong YK, Detmar M. Up-regulation of the lymphatic marker podoplanin, a mucin-type transmembrane glycoprotein, in human squamous cell carcinomas and germ cell tumors. Am J Pathol. 2005;166:913-921. [RCA] [PubMed] [DOI] [Full Text] [Cited by in Crossref: 447] [Cited by in RCA: 465] [Article Influence: 23.3] [Reference Citation Analysis (0)] |
| 37. | Kato Y, Kaneko M, Sata M, Fujita N, Tsuruo T, Osawa M. Enhanced expression of Aggrus (T1alpha/podoplanin), a platelet-aggregation-inducing factor in lung squamous cell carcinoma. Tumour Biol. 2005;26:195-200. [RCA] [PubMed] [DOI] [Full Text] [Cited by in Crossref: 177] [Cited by in RCA: 177] [Article Influence: 8.9] [Reference Citation Analysis (0)] |
| 38. | Kimura N, Kimura I. Podoplanin as a marker for mesothelioma. Pathol Int. 2005;55:83-86. [RCA] [PubMed] [DOI] [Full Text] [Cited by in Crossref: 160] [Cited by in RCA: 155] [Article Influence: 7.8] [Reference Citation Analysis (0)] |
| 39. | Martín-Villar E, Scholl FG, Gamallo C, Yurrita MM, Muñoz-Guerra M, Cruces J, Quintanilla M. Characterization of human PA2.26 antigen (T1alpha-2, podoplanin), a small membrane mucin induced in oral squamous cell carcinomas. Int J Cancer. 2005;113:899-910. [RCA] [PubMed] [DOI] [Full Text] [Cited by in Crossref: 213] [Cited by in RCA: 226] [Article Influence: 11.3] [Reference Citation Analysis (0)] |
| 40. | Wicki A, Lehembre F, Wick N, Hantusch B, Kerjaschki D, Christofori G. Tumor invasion in the absence of epithelial-mesenchymal transition: podoplanin-mediated remodeling of the actin cytoskeleton. Cancer Cell. 2006;9:261-272. [RCA] [PubMed] [DOI] [Full Text] [Cited by in Crossref: 432] [Cited by in RCA: 434] [Article Influence: 22.8] [Reference Citation Analysis (0)] |
| 41. | Linder S, Wiesner C, Himmel M. Degrading devices: invadosomes in proteolytic cell invasion. Annu Rev Cell Dev Biol. 2011;27:185-211. [RCA] [PubMed] [DOI] [Full Text] [Cited by in Crossref: 290] [Cited by in RCA: 297] [Article Influence: 21.2] [Reference Citation Analysis (0)] |
| 42. | Lehnert L, Trost H, Schmiegel W, Röder C, Kalthoff H. Hollow-spheres: a new model for analyses of differentiation of pancreatic duct epithelial cells. Ann N Y Acad Sci. 1999;880:83-93. [RCA] [PubMed] [DOI] [Full Text] [Cited by in Crossref: 14] [Cited by in RCA: 16] [Article Influence: 0.6] [Reference Citation Analysis (0)] |
| 43. | Lovitt CJ, Shelper TB, Avery VM. Advanced cell culture techniques for cancer drug discovery. Biology (Basel). 2014;3:345-367. [RCA] [PubMed] [DOI] [Full Text] [Full Text (PDF)] [Cited by in Crossref: 173] [Cited by in RCA: 182] [Article Influence: 16.5] [Reference Citation Analysis (1)] |
| 44. | Kunz-Schughart LA. Multicellular tumor spheroids: intermediates between monolayer culture and in vivo tumor. Cell Biol Int. 1999;23:157-161. [RCA] [PubMed] [DOI] [Full Text] [Cited by in Crossref: 175] [Cited by in RCA: 160] [Article Influence: 6.7] [Reference Citation Analysis (0)] |


