INTRODUCTION
Elastography is an imaging modality which evaluates the stiffness of organs. There are a considerable number of studies assessing the usefulness of elastography for superficial organs including the breast[1] and the thyroid[2] and for the liver in the field of digestive systems[3-6]. Recently, the clinical guidelines for elastography mainly focused on the liver and the breast were published from Japanese Society of Ultrasound in Medicine[7,8], European Federation of Societies for Ultrasound in Medicine and Biology[9], and World Federation for Ultrasound in Medicine and Biology[10,11]. In contrast, there are far fewer studies evaluating its usefulness for the pancreas. Because pancreas is a small organ locates deep in center of the human body, it is not easy to perform elastography for the pancreas with adequate accuracy and reproducibility. In addition to that, it is not easy to confirm if an elastogram of the pancreas truly reflects the histological structure because obtaining biopsy specimens from the pancreas is difficult. In 2015, clinical practice guidelines for elastography specialized in the pancreas were published from Japanese Society of Medical Ultrasonics[12]. The guidelines show us not only the recent studies but also technical knacks of performing elastography for the pancreas, and hence these guidelines are very useful for clinical practice.
Historically, clinical application of elastography had begun with strain elastography[13,14]. Strain elastography estimates the stiffness of target tissue by measuring the grade of strain generated by external pressure[15,16]. There is negative correlation between the grade of strain and the stiffness of target tissue: the greater the strain, the softer the stiffness of target tissue is. Because manual compression is ineffective for the pancreas, the strain must be generated by aortic pulsation. Ideally, the target tissue should be located in line between the probe and the aorta in order to obtain adequate strain for elastography: A fine elastogram can be easily obtained in the pancreatic body, except for the patients with severe arteriosclerosis. In contrast, a fine elastogram cannot be obtained often in the pancreatic head and tail.
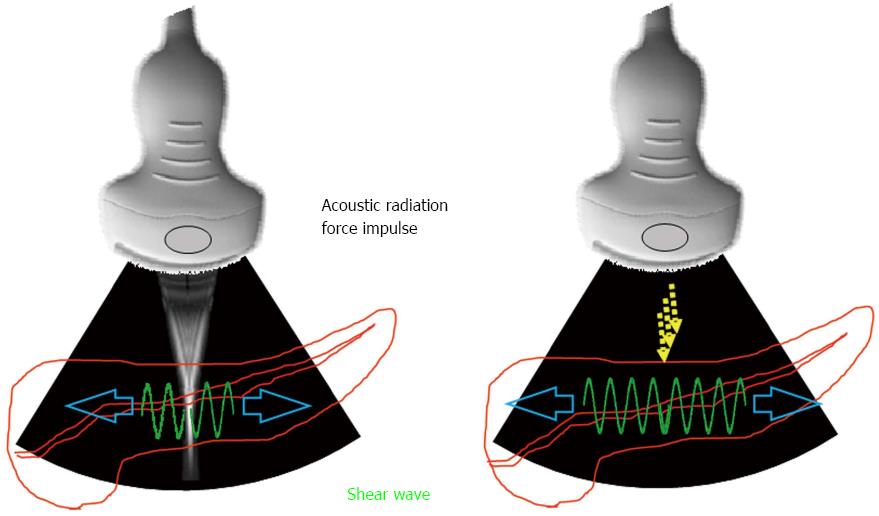
Shear wave elastography is another elastography based on a different principle. Shear wave elastography emits the focused ultrasound, so called acoustic radiation force impulse (ARFI), from the probe to the target tissue. Consequently, the transverse wave, so-called shear wave, is generated by ARFI, and the stiffness of the target tissue is estimated by measuring the propagation speed of shear wave (Figure 1). There is positive correlation between the propagation speed of shear wave (shear wave velocity) and the stiffness of target tissue: the faster the shear wave velocity, the harder the target tissue is. Theoretically, ARFI can be emitted to the entire pancreas wherever desired. However, passive strain of the pancreas caused by aortic pulsation can interfere with ARFI, especially in the pancreatic body. The strength of ARFI is limited to ensure safety[17], therefore, adequate shear wave may not be generated for a hard pancreatic tumor. In addition to that, no one knows if ARFI is used with contrast enhanced material in safety[18-20]. Shear wave elastography cannot be performed by endoscopic ultrasound (EUS) to date.
Figure 1 Measurement principle of shear wave elastography.
Acoustic radiation force impulse is emitted from the probe to the target tissue. Accordingly, the transverse wave, so-called shear wave, is generated. The propagation speed of shear wave is measured by the detection pulse transmitted from the probe.
In the past, biopsy specimens had been difficult to obtain from the pancreas. Recently, a novel technique, EUS guided-fine needle aspiration (EUS-FNA) was established, and now it is frequently performed for the pancreas in clinical practice[21-26]. However, the specimens obtained by EUS-FNA from the pancreas are much smaller compared to those obtained by fine needle biopsy from the liver. Also, EUS-FNA can cause serious adverse events such as severe pancreatitis[26-28] and needle track seeding[29]. Thus, it is still crucial to develop a non-invasive imaging modality as elastography for the pancreas. For the widespread clinical application, elastography for the pancreas must meet conditions such as adequate reproducibility, operator independency, and accuracy as high as it can reflect histological structure. However, there are little studies investigating these issues.
Although there are still a considerable number of issues remained to be solved, elastography for the pancreas is a promising imaging modality because of its non-invasive nature. For the better understanding of elastography for the pancreas for readers who are not experts of the pancreas, this report introduces only the elastographies which have already been reported in the literature. Thus, we should add that other promising elastographic modalities are also available, which are not introduced in this report.
ELASTOGRAPHY FOR THE PANCREAS
US-elastography - Strain elastography
US-elastography is a non-invasive imaging examination which can be performed by not only physicians but also medical technicians. Therefore, US-elastography seems to be an appropriate imaging modality for screening numerous asymptomatic. Because periodical screening of high-risk group, even though they are asymptomatic, is known to be necessary for early detection of pancreatic cancer[30], US-elastography can be a candidate for this periodical screening strategy.
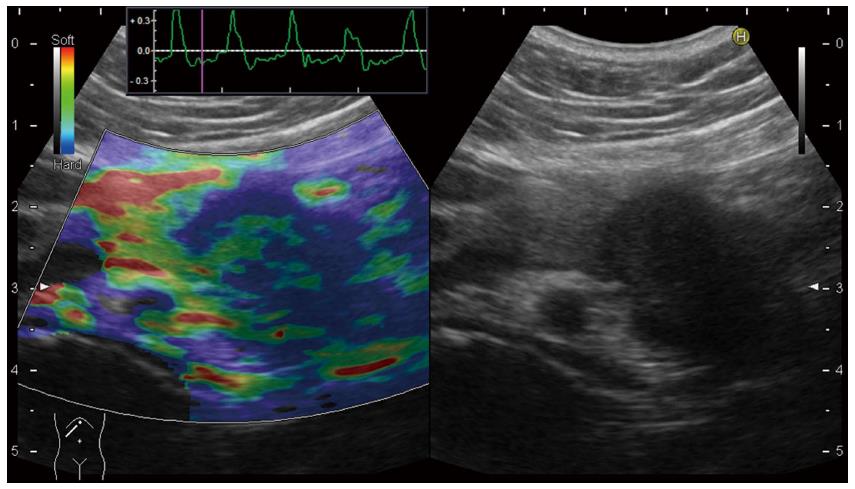
Historically, clinical application of US-elastography had begun with Real-time Tissue ElastographyTM (RTE) produced by Hitachi Aloka[13,14]. In the conventional RTE, only qualitative diagnosis using color map was possible (Figure 2). In the color map of RTE, the hardest tissue is displayed as blue, and the softest tissue is displayed as red. In RTE, it is known that elastogram cannot be obtained, or some artifacts will be seen for fluid component as cyst, therefore, pancreatic cystic lesions cannot be evaluated by RTE.
Figure 2 Qualitative diagnosis in US-Real-time Tissue ElastographyTM.
A hypoechoic tumor was seen at the pancreatic tail in B-mode (right). In Real-time Tissue ElastographyTM, blue color is seen on the tumor, green color is seen on non-tumorous area of the pancreas, and red color is seen at ventral side of the pancreas (left).
Uchida et al[31] published the first report evaluating the usefulness of US-elastography for the pancreas in 2009. They reviewed elastograms performed for 10 normal pancreas, 5 pancreatic ductal adenocarcinomas, 2 endocrine tumors, and 5 chronic pancreatitis, and reported the typical color map observed in US-RTE as follows: homogeneous color was observed in normal pancreas, markedly hard area with soft spots was observed in pancreatic ductal adenocarcinoma, uniform and soft comparable to parenchyma was observed in neuroendocrine tumor, and mixture of various colors was observed in chronic pancreatitis. Moreover, they performed US-RTE for 53 pancreatic tumors prospectively, and reported that diagnostic accuracy of B-mode alone was about 70%-80%, while that of combination with US-RTE was more than 90%.
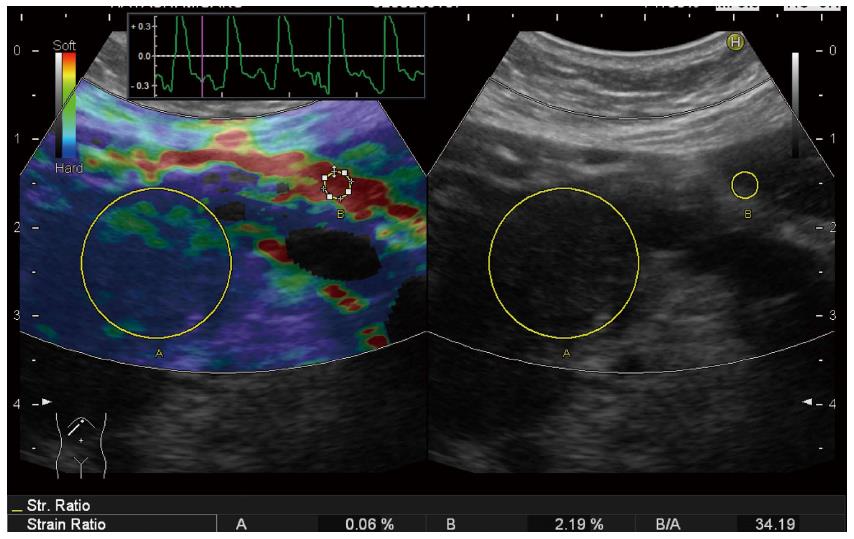
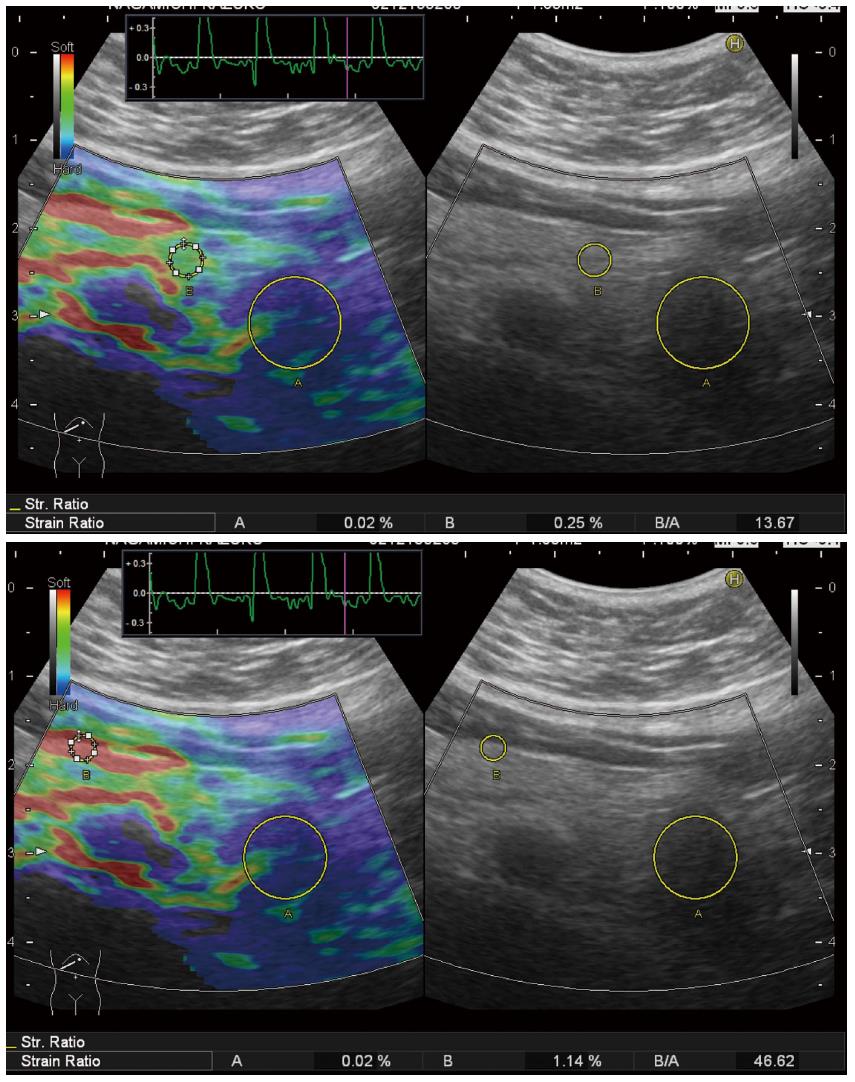
Because qualitative diagnosis using color map was subjective and highly operator dependent, quantitative diagnosis using strain ratio was established since the second-generation RTE (Figure 3). Strain ratio is defined as the ratio of the strain of reference tissue (B) divided by the strain of target tissue (A), so that the strain of target tissue can be digitalized. Strain ratio is the conversion of the theory called ‘‘fat lesion ratio’’ reported in the breast, which means the ratio of the strain of fat around the mammary gland divided by the strain of target tissue. This theory is based on the idea that stiffness of fat is almost equal in different individuals[32]. However, there is no consensus where to set reference area for the pancreas instead of fat around the mammary gland for the breast. Some investigators set reference area on non-tumorous area inside pancreatic parenchyma[33,34], and the other investigators set reference area on red area around the pancreas which was estimated as fat[35,36] (Figure 4) . However, there is no evidence if red area around pancreas is really fat. It is known that strain ratios calculated for the same target tissue quite differ according to wherever the reference area is set.
Figure 3 Quantitative diagnosis in US-Real-time Tissue ElastographyTM.
A hypoechoic tumor is seen at the pancreatic tail in B-mode (right). Region of interest (ROI) [A] is set on the tumor, and ROI [B] is set on read area around the pancreas (left). By setting ROI [A] and [B], strain [A], strain [B], and strain ration [B/A] were calculated automatically and displayed at the bottom of the screen (left).
Figure 4 Setting the different reference area in a case of pancreatic tail tumor.
Strain ratio quite differs according to the reference area: When the reference area is set on non-tumorous area of the pancreas, strain ration is calculated as 13.67 (upper). When the reference area was set on read area around the pancreas, strain ration is calculated as 46.62.
Kawada et al[33] performed the second-generation US-RTE for consecutive 36 solid pancreatic tumors. They reported that strain ration was higher in ductal adenocarcinomas compared to that in benign tumors, and different color patterns were observed between ductal adenocarcinomas of < 25 mm and those of ≥ 25 mm. The cutoff levels of strain ratio optimal for differential diagnosis between malignancy and benignancy are quite different in each report[34-36], indicating RTE is highly operator dependent and lacks adequate reproducibility. Because the pancreas locates deep in center of the body, patients’ body shape and body position during examination may affect measuring the strain ratio. In order to minimize such effects associated with patients’ body shape and body position, Kawada et al[37] compared the strain ratios obtained from the same pancreatic cancer patients with the same body position during examination before and after chemo-radiation therapy. They concluded that treatment effect evaluated histologically after chemo-radiation was greater in the group with much reduced strain ratio than that in the group with less reduced strain ratio.
EUS was used in most reports evaluating RTE for the pancreas, as described later. A fine B-mode image is required for a fine elastogram, and generally a fine B-mode image is obtained within 6 cm in depth from the body surface in US. Therefore, elastogram cannot be obtained if the pancreas locates deep from the body surface, for example, in the obese. These problems will occur less frequently in EUS because the distance between the probe and the pancreas is shorter in EUS compared to that in US. In addition to that, B-mode image is easily affected by gastrointestinal gas in US, while it occurs infrequently in EUS. However, US-RTE is still considered to be a promising imaging examination for the selective patients due to its non-invasive nature.
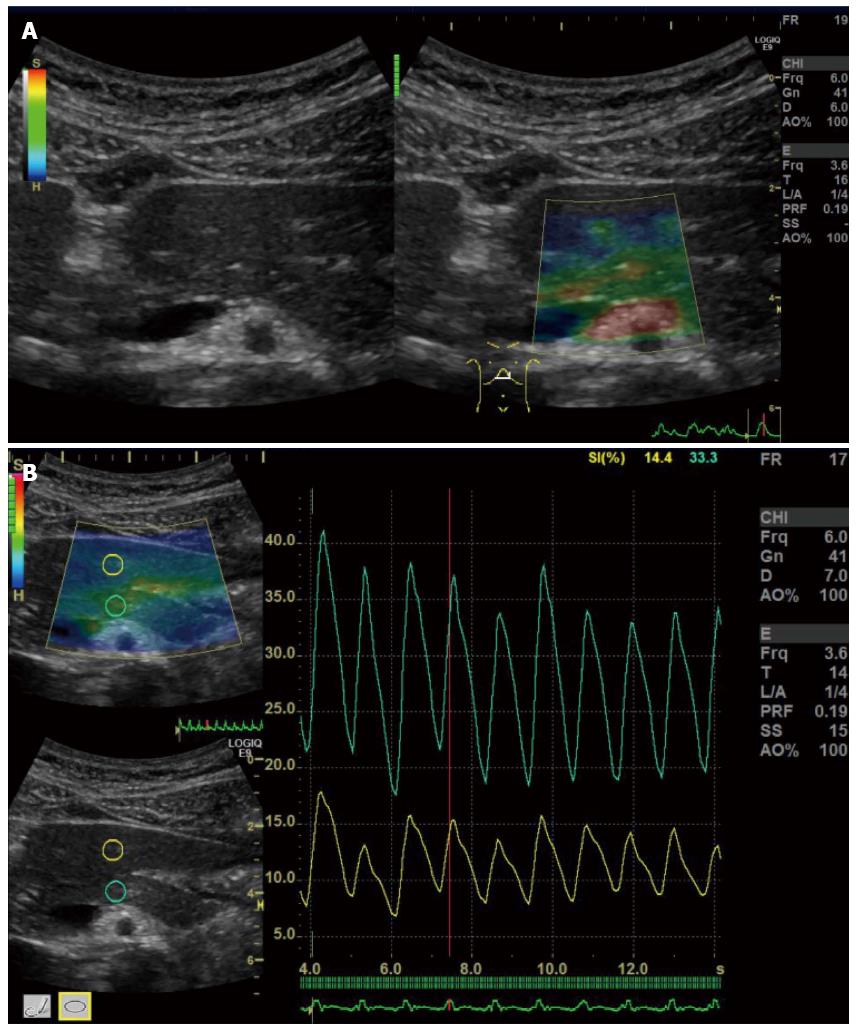
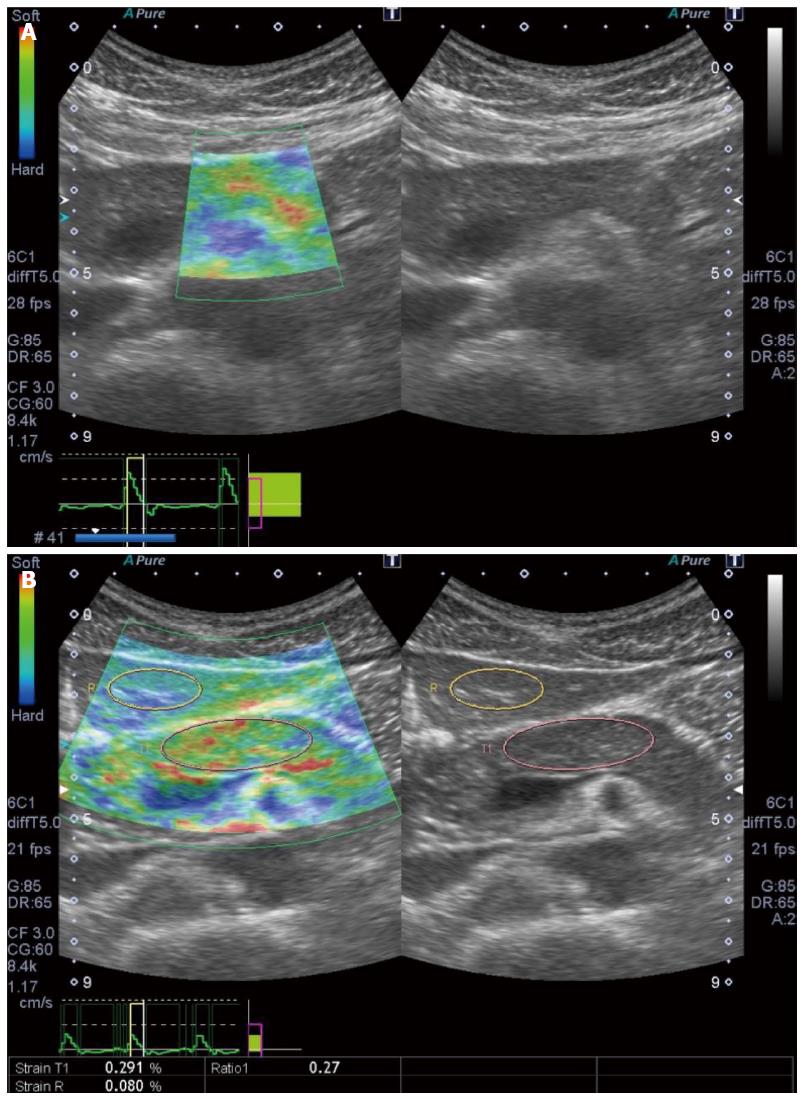
There are also other promising US-elastographies, which are ElastographyTM (GE) (Figure 5), and ElastographyTM (Toshiba) (Figure 6). However, there are no studies evaluating the usefulness of these instruments to date. Further information of these instruments is available in the guidelines[12]. These instruments are not available in EUS.
Figure 5 ElastographyTM.
A: Elastography (GE) is performed for a normal pancreas; B: Strain ration can be calculated by setting the reference area.
Figure 6 ElastographyTM (Toshiba).
A: Elastography (Toshiba) is performed for a normal pancreas; B: Strain ration can be calculated by setting the reference area.
US-elastography - Shear wave elastograhy
Because manual compression is not effective for the pancreas which locates deep in center of the body, the strain must be generated by aortic pulsation. Therefore, a fine elastogram cannot be always obtained depending on the location of the pancreas in strain elastography. In contrast, emission of ARFI is possible for entire pancreas wherever desired in shear wave elastography. Therefore, shear wave elastography is considered as a break-through in the history of elastography for the pancreas.
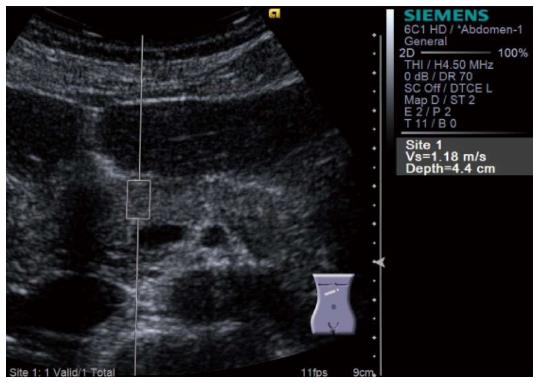
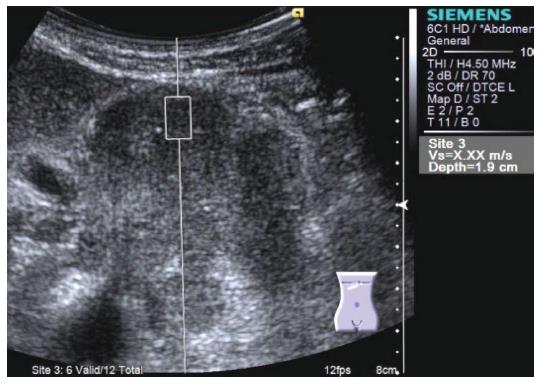
Virtual TouchTM Quantification (VTQ) produced by Siemens is a representative instrument of shear wave elastography. VTQ shows the stiffness of target tissue digitally by measuring shear wave velocity (SWV). SWV is displayed on the right side of the screen in m/s (Figure 7). In case of measurement failure, X,XX m/s is displayed on the screen instead of digits (Figure 8).
Figure 7 Virtual Touch QuantificationTM (Siemens) performed for the pancreatic head.
Region of interest is set on the pancreatic head. Subsequently, acoustic radiation force impulse is emitted by pressing the button, and shear wave velocity (m/s) is displayed in the right side of the screen in a few seconds.
Figure 8 Virtual TouchTM Quantification (Siemens) performed for a large tumor at the pancreatic body.
Shear wave velocity cannot be measured because the tumor is too hard. X,XX m/s is displayed in the right side of the screen instead of digits.
The first report evaluating the usefulness of VTQ for the pancreas was published in 2009[38]. In this case report, D’Onofrio et al[38] reported that a pancreatic tumor which was diagnosed as solid pancreatic tumor by US and CT in advance was finally diagnosed as serous cystic neoplasm by VTQ. In this case, X,XX m/s was always displayed on the screen during VTQ which indicated the tumor was not solid but cystic.
Yashima et al[39] subjected 46 patients with chronic pancreatitis and 52 normal pancreas, and measured SWV at the head, the body and the tail of the pancreas for 10 times in each case. The success rates of > 60% for measuring SWV at the head, the body and the tail of the pancreas were 69%, 75%, and 42%, respectively. They also determined the cutoff of SWV optimal for diagnosing chronic pancreatitis as 1.40 m/s by ROC analysis, and reported that sensitivity, specificity, PPV, and NPV for diagnosing chronic pancreatitis were 75%, 72%, 69%, and 78%, respectively. Two years later, the improved success rates of 100% for measuring SWV at the head, the body, and the tail of the pancreas were reported to be 80%, 83%, and 68%, respectively by Kawada et al[40]. They also determined the factors associated with the stiffness of the pancreas (> 1.40 m/s) as severe alcohol intake (OR = 3.87, P = 0.005) and deeper depth of the pancreas from the body surface ≥ 4.2 cm, OR = 0.10, P = 0.002) by multivariate analysis. Also, they reported that the stiffness of non-tumorous pancreas tended to be higher in patients with pancreatic ductal adenocarcinoma compared to that in patients without pancreatic ductal adenocarcinoma. The clinical implication of VTQ would be enormous if VTQ could identify the high-risk group for pancreatic cancer by measuring SWV of the pancreas because VTQ can be performed even for asymptomatic due to its non-invasive nature.
Recently, series of studies evaluating the usefulness of VTQ for the pancreas were published[41-46]. A study reported the usefulness of VTQ for differential diagnosis between malignant and benign pancreatic tumors[41], and another reported the usefulness of VTQ for diagnosis of acute pancreatitis[42]. There is also a study reporting the possibility of discriminating serous cyst fluid from mucinous one[43]. As already mentioned in this text, RTE cannot evaluate cystic lesions, therefore, it is interesting if VTQ can really evaluate cystic lesions, too. In addition to these, there are studies reporting that the stiffness of the pancreas measured preoperatively could predict the incidence of post-operative pancreatic juice fistula. Harada et al[44] measured the stiffness of non-tumorous pancreas preoperatively for 62 patients who subsequently underwent pancreatectomy. They reported that there were positive correlation between SWV and histological grade of fibrosis [Spearman’s rank correlation coefficient (ρ) = 0.660, P < 0.0001]. Also, they reported that post-operative pancreatic juice fistula was observed more frequently in patients with lower stiffness of the pancreas (SWV < 1.54 m/s) than in patients with higher stiffness of the pancreas (63% vs 17%, P < 0.001).
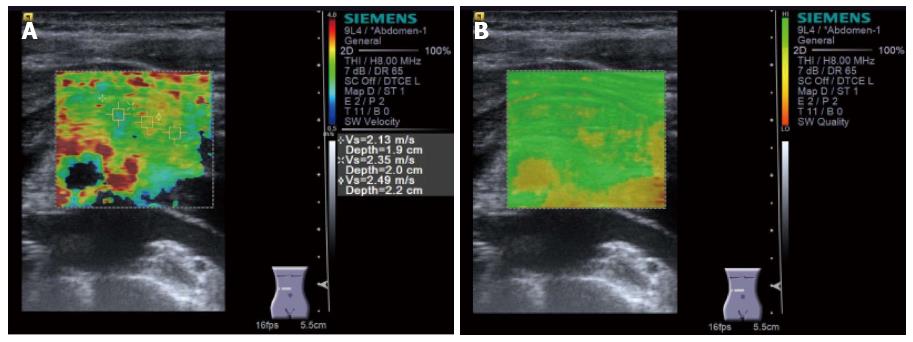
Shear wave elastography had begun with the measurement of SWV, subsequently Virtual TouchTM Imaging and Quantification (VTIQ, Siemens) was developed. In VTIQ, the stiffness of organ can be displayed on the screen in color map (Figure 9). VTIQ is available in Japan since March 2012, and only linear probe can be used in VTIQ to date. There are several reports evaluating the usefulness of VTIQ for the other organs[47-50], however, there are none for the pancreas.
Figure 9 Virtual TouchTM IQ (Siemens) performed for a pancreatic body tumor.
Because only linear probe can be used, Virtual TouchTM IQ (VTIQ) cannot be performed for the case in which the pancreas locates deep from the body surface. Shear wave velocity can be measured post hoc at the point wherever desired (upper). In quality mode, the degree of confidence in measurement is seen for each point (lower). Green color shows the point where shear wave velocity is measured with high confidence.
ElastPQ produced by Philip is another instrument for shear wave elastography. In ElastPQ, SWV is shown in kPa. There are a report evaluating the correlation between VTQ and ElastPQ for the liver[51], however, there are none for the pancreas.
Shear wave elastography seems to be appropriate for the pancreas for which it is not always easy to obtain adequate strain from aortic pulsation. There are more and more studies reporting the usefulness of shear wave elastography for the pancreas in recent years[40-46]. Further development of shear wave elastography, such as availability in EUS, is required.
EUS-elastography - Strain elastography
Hirooka et al[13] had first reported the clinical usefulness of EUS-elastography for the pancreas in 2005, there are a considerable number of reports related to EUS-elastography for the pancreas[52-65]. There are also several meta-analyses related to EUS-elastography for the pancreas[52-55]. Because RTE is a single instrument in which EUS-elastography can be performed, RTE is evaluated in all reports regarding EUS-elastography for the pancreas. Recently, another EUS-elastographic instrument, ELSTTM, was produced by Olympus. ELST is considered to be almost the same as RTE because the technology used in ELST was provided by Hitachi-Aloka.
Most reports regarding EUS-elastography for the pancreas are associated with the differential diagnosis between benign and malignant solid pancreatic tumors. Several meta-analyses related to the differential diagnosis of pancreatic tumors have been reported since 2012[52-55]. In summary, sensitivity of EUS-elastography for the differential diagnosis of pancreatic tumors is reported to be excellent ranging from 95% to 99%, while its specificity is reported to be inadequate ranging from 67% to 76%. It is assumed that most benign pancreatic tumors are tumor forming pancreatitis, and benign pancreatitis with severe fibrosis can be as hard as malignant ductal adenocarcinoma. EUS-elastography cannot be a surrogate examination for EUS-FNA, however, EUS-elastography may be a crucial examination for the selective cases in which EUS-FNA cannot be performed[66]. The criteria for differential diagnosis between malignant and benign pancreatic tumors differ from report to report.
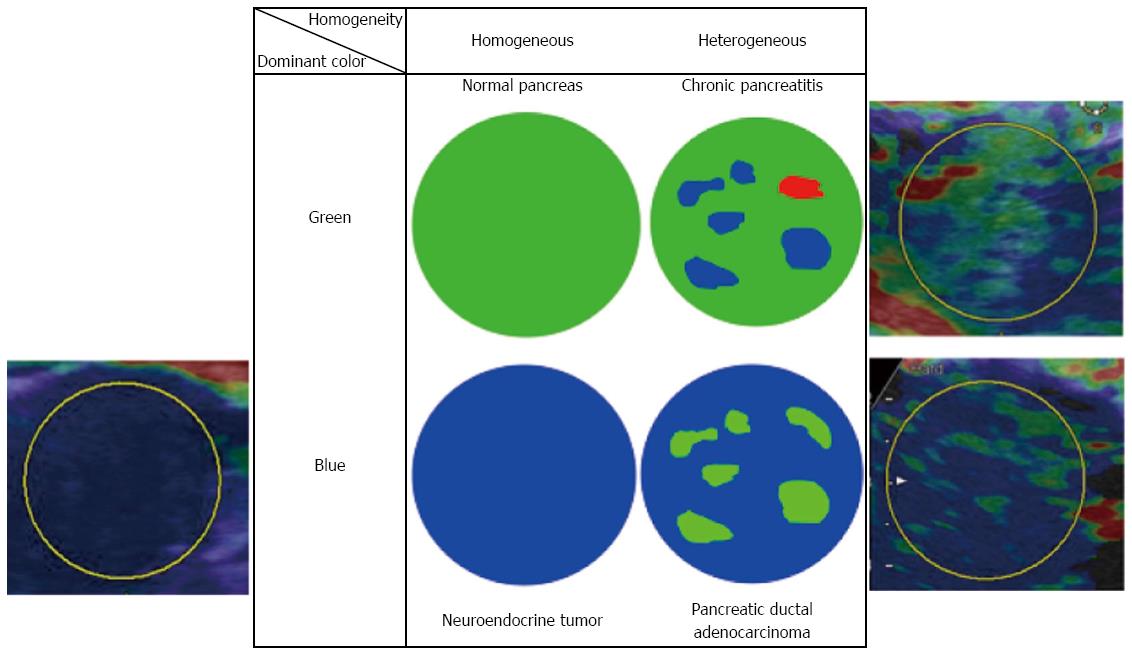
Despite the qualitative diagnostic criteria for distinguishing malignancy from benignancy differ from report to report, most of them consist of the following two factors: (1) the dominant color within color map; and (2) the homogeneity of color map, as shown in Figure 10. In RTE, the softest tissue within ROI is displays as red while the hardest tissue within ROI is displayed as blue, and the remaining tissue is displayed as a coordinated color between red and blue according to the stiffness of the tissue. Thus, we should keep in mind that the color map observed in RTE is not an absolute one but will be changed depending on the size of ROI.
Figure 10 A representative qualitative diagnostic criteria in Real-time Tissue ElastographyTM (Hitachi-Aloka).
Dominant color and homogeneity of color are evaluated in most reports. The representative histology estimated by each combination of color and homogeneity are shown.
Iglesias-Garcia et al[56] subjected 77 ductal adenocarcinomas, 42 tumor forming pancreatitis, and 10 endocrine tumors, and classified them according to the combination of the dominant color within color map (blue or green) and the homogeneity of color map (homogeneous or heterogeneous). When the combination of ‘‘green’’ and ‘‘heterogeneous’’ were determined as benign tumor forming pancreatitis, ‘‘blue’’ and ‘‘homogeneous’’ were determined as endocrine tumor, and ‘‘blue’’ and ‘‘heterogeneous’’ were determined as ductal adenocarcinoma, sensitivity, specificity, PPV, and NPV were 100%, 85.5%, 90.7%, and 100%, respectively. These excellent diagnostic accuracies were also shown with good concordance rate between two blinded investigators. Giovannini et al[57] conducted a multicenter study subjecting 121 patients with pancreatic tumors (92 malignant and 29 benign). In their study, pancreatic tumors were classified according to the following scoring system: Score 1, homogeneous green corresponding to normal tissue; Score 2, heterogeneous soft tissue (green, yellow, and red) corresponding to inflammatory tissue; Score 3, mixed color or honeycombed corresponding to indeterminate; Score 4, small green central area surrounded by mainly blue; Score 5, mainly blue with heterogeneous green and red corresponding advanced malignant lesion[57]. When score 1 and 2 were determined as benign and score 4 and 5 as malignant, sensitivity and specificity were 92.3% and 80%, respectively, and kappa coefficient was shown to be 0.785.
One of the quantitative diagnostic methods frequently used for EUS-elastography is a strain ratio analysis. Itokawa et al[34] subjected 72 ductal adenocarcinomas and 7 tumor forming pancreatitis, and reported that strain ratio was significantly higher in ductal adenocarcinomas compared to that in tumor forming pancreatitis (39.08 ± 20.54 vs 23.66 ± 12.65, P < 0.05). Iglesias-Garcia et al[35] subjected 86 pancreatic tumors including 49 ductal adenocarcinomas, 27 tumor forming pancreatitis, 6 endocrine carcinomas, and 2 metastatic carcinomas. They reported when cutoff of strain ratio optimal for distinguishing malignancy from benignancy was determined as 6.04, sensitivity and specificity were 100% and 92.9%, respectively. Dawwas et al[36] subjected 74 ductal adenocarcinomas, 11 endocrine carcinomas, 2 metastatic carcinomas, and 17 tumor forming pancreatitis, and reported when cutoff was determined as 4.65, sensitivity and specificity were 100% and 16.7%, respectively. As shown above, optimal cutoff values of strain ratio quite differ from report to report. It is assumed that cutoff value was affected by where to set the reference area: non-tumorous pancreas was determined as reference area in the former report, whereas red area around the pancreas was determined as reference area in the latter two reports.
Another quantitative diagnostic method is a strain histogram analysis. In the strain histogram analysis, the stiffness of tissue is converted into 256-grade gray scale or digits, and gray scale map or gray scale histogram is shown on the screen. Săftoiu et al[58] conducted multicenter study subjecting 258 pancreatic tumors, and performed strain histogram analysis. When cutoff of strain histogram was determined as 175 calculated by ROC analysis (AUC = 0.854, P < 0.0001), sensitivity, specificity, PPV and NPV for distinguishing malignancy from benignancy were 93.4%, 66.0%, 92.5%, 68.9%, respectively. Opačić et al[59] performed strain histogram analysis subjecting 105 pancreatic tumors, and reported when cutoff was determined as 86, sensitivity and specificity were 100% and 45%, respectively. Cutoff values also quite differ from report to report in strain histogram analysis.
The other quantitative diagnostic method is a neural network analysis[57,58]. The neural network analysis is a method developed by Săftoiu et al[58] and is performed by computer which can avoid arbitrary analysis. However, the neural network analysis is not prevalent among other investigators.
Next, we are moving on diffuse pancreatic diseases. Itoh et al[62] performed EUS-elastography preoperatively for the proximal side of the pancreatic tumor in order to exclude possible effects of obstructive pancreatitis, and compared the elastograms with microscopic findings of the resected specimens. They reported when using 4 parameters of mean, standard deviation, skewness, kurtosis, there were significant correlation between 4 parameters and grade of fibrosis evaluated pathologically (r = -0.75, -0.54, 0.69, and 0.67, respectively). Iglesias-Garcia et al[63] subjected 191 chronic pancreatitis, and compared strain ratio with Rosemont classification, a well-known diagnostic criteria for chronic pancreatitis evaluated by EUS. They reported that there was positive correlation between strain ratio and Rosemont classification (r = 0.813, P < 0.0001). They reported when cutoff for diagnosing chronic pancreatitis was determined as 2.25 by ROC analysis (AUC = 0.949), sensitivity was shown to be 91.1%. Janssen et al[64] found that stiffness of the normal pancreas was increasing with aging. They reported that the value of strain histogram measured in normal pancreas was significantly lower in individuals of ≥ 60 years compared to that in individuals of < 60 years, although it was significantly higher in individuals of ≥ 60 years compared to that in patients with chronic pancreatitis (110.2 vs 80.0 vs 32.4, respectively, P < 0.001). A recent study reported that EUS-elastography could predict pancreatic exocrine dysfunction in patients with chronic pancreatitis[65]. Iglesias-Garcia et al[56] hypothesized that pancreatic exocrine function was depend on the grade of pancreatic fibrosis, and measured strain ratio in 115 patients with chronic pancreatitis. They reported that there was significant correlation between strain ratio and pancreatic exocrine dysfunction evaluated by 13C-mixed triglyceride breath test.
Thus, investigations of EUS-RTE were proceeded mainly through establishing the diagnostic criteria for differential diagnosis between malignant and benign pancreatic tumors[52-61]. Because EUS is a detailed examination, investigators might often encounter a situation in which a known pancreatic tumor must be evaluated if it was malignant or not. It is important to take advantage of each modality: US-elastography for screening and EUS-elastography for detailed examination.
FUTURE PERSPECTIVES
The goal of elastography for the pancreas is to assure accurate elastogram enough to reflect histological structure. Also, elastography for the pancreas must be operator-independent and satisfy the adequate reproducibility. The following facts that (1) the pancreas is a small organ locates deep in center of the body; (2) obtaining the biopsy specimens from the pancreas is not easy; and (3) the pancreas is strongly affected by aortic pulsation, make difficult to achieve the goal. There may be another breakthrough by developing an instrument based on a novel principle beyond shear wave elastography in the future.
Although there are several issues remained to be solved, elastography may be a promising imaging modality for early detection of chronic pancreatitis. It is known that patients with chronic pancreatitis are at risk for pancreatic cancer, therefore, chronic pancreatitis should be diagnosed within reversible stage so that it can be cured by therapeutic intervention. At the current moment, EUS is considered to be the best imaging modality which can detect early chronic pancreatitis[67,68]. However, the diagnostic criteria used in EUS, such as hyperechoic foci and stranding, are associated with calcification which are irreversible change. In contrast, elastography may detect earlier signs of chronic pancreatitis, such as parenchymal edema, only if they can be recognized as change of tissue stiffness.
Also, elastography may contribute to early detection of pancreatic cancer. Early detection of pancreatic cancer is important because better prognosis cannot be achieved without its early detection. As described in the text, US-elastography can pick up the high-risk patients for pancreatic cancer from numerous asymptomatic because US-elastography can be performed as physical check-up. If diffuse or focal stiffness is detected by US-elastography, this person can undergo further detailed examination for the pancreas, which may detect early pancreatic cancer.


