Published online Jun 7, 2015. doi: 10.3748/wjg.v21.i21.6434
Peer-review started: December 16, 2014
First decision: January 22, 2015
Revised: February 28, 2015
Accepted: March 31, 2015
Article in press: March 31, 2015
Published online: June 7, 2015
Processing time: 178 Days and 1.3 Hours
While in chronic diseases, such as diabetes, mortality rates slowly increases with age, in oncological series mortality usually changes dramatically during the follow-up, often in an unpredictable pattern. For instance, in gastric cancer mortality peaks in the first two years of follow-up and declines thereafter. Also several risk factors, such as TNM stage, largely affect mortality in the first years after surgery, while afterward their effect tends to fade. Temporal trends in mortality were compared between a gastric cancer series and a cohort of type 2 diabetic patients. For this purpose, 937 patients, undergoing curative gastrectomy with D1/D2/D3 lymphadenectomy for gastric cancer in three GIRCG (Gruppo Italiano Ricerca Cancro Gastrico = Italian Research Group for Gastric Cancer) centers, were compared with 7148 type 2 diabetic patients from the Verona Diabetes Study. In the early/advanced gastric cancer series, mortality from recurrence peaked to 200 deaths per 1000 person-years 1 year after gastrectomy and then declined, becoming lower than 40 deaths per 1000 person-years after 5 years and lower than 20 deaths after 8 years. Mortality peak occurred earlier in more advanced T and N tiers. At variance, in the Verona diabetic cohort overall mortality slowly increased during a 10-year follow-up, with ageing of the type 2 diabetic patients. Seasonal oscillations were also recorded, mortality being higher during winter than during summer. Also the most important prognostic factors presented a different temporal pattern in the two diseases: while the prognostic significance of T and N stage markedly decrease over time, differences in survival among patients treated with diet, oral hypoglycemic drugs or insulin were consistent throughout the follow-up. Time variations in prognostic significance of main risk factors, their impact on survival analysis and possible solutions were evaluated in another GIRCG series of 568 patients with advanced gastric cancer, undergoing curative gastrectomy with D2/D3 lymphadenectomy. Survival curves in the two different histotypes (intestinal and mixed/diffuse) were superimposed in the first three years of follow-up and diverged thereafter. Likewise, survival curves as a function of site (fundus vs body/antrum) started to diverge after the first year. On the contrary, survival curves differed among age classes from the very beginning, due to different post-operative mortality, which increased from 0.5% in patients aged 65-74 years to 9.9% in patients aged 75-91 years; this discrepancy later disappeared. Accordingly, the proportional hazards assumption of the Cox model was violated, as regards age, site and histology. To cope with this problem, multivariable survival analysis was performed by separately considering either the first two years of follow-up or subsequent years. Histology and site were significant predictors only after two years, while T and N, although significant both in the short-term and in the long-term, became less important in the second part of follow-up. Increasing age was associated with higher mortality in the first two years, but not thereafter. Splitting survival time when performing survival analysis allows to distinguish between short-term and long-term risk factors. Alternative statistical solutions could be to exclude post-operative mortality, to introduce in the model time-dependent covariates or to stratify on variables violating proportionality assumption.
Core tip: In gastric cancer patients mortality from recurrence peaked in the first two years after curative gastrectomy and then declined. The prognostic significance of risk factors was not stable, as the effect of T and N decreased with time, while the effect of histology became apparent after two years. Advancing age was associated with increased post-operative mortality. Hence, the proportional hazards assumption of the Cox model was violated. A possible solution was to split survival analysis in the first two years of follow-up and subsequent years. By comparison, overall mortality and prognostic significance of risk factors was rather stable in a cohort of type 2 diabetic patients.
- Citation: Verlato G, Marrelli D, Accordini S, Bencivenga M, Di Leo A, Marchet A, Petrioli R, Zoppini G, Muggeo M, Roviello F, de Manzoni G. Short-term and long-term risk factors in gastric cancer. World J Gastroenterol 2015; 21(21): 6434-6443
- URL: https://www.wjgnet.com/1007-9327/full/v21/i21/6434.htm
- DOI: https://dx.doi.org/10.3748/wjg.v21.i21.6434
Despite the declining incidence, gastric cancer is currently the third leading cause of cancer death worldwide[1]. Prediction of prognosis after surgical resection for primary gastric adenocarcinoma is based mainly on the American Joint Committee on Cancer (AJCC) staging system[2] which takes into account depth of tumour invasion, pathological nodal status and the presence of distant metastasis as the only prognostic factors. Certainly, disease burden at the diagnosis is the most important predictor of cancer related-death, as up to 70% of deaths from cancer recurrence occur in the first two years after gastrectomy[3,4], mainly in patients with tumours infiltrating serosa, with extensive nodal involvement or systemic metastases.
However, after the first two years mortality rates remarkably decrease. In a Dutch-American study[4] 5-year disease-specific survival from the day of surgery presented a median improvement of 7.2%, 19.1%, and 31.6% respectively, in patients surviving 1, 2, or 3 years after surgery. Therefore, according to the US Gastric Cancer Collaborative[5] survival estimates following surgical resection of gastric adenocarcinoma can be considered dynamic: “the probability of survival increases with time already survived”.
The improvement in prognosis, recorded in gastric cancer patients surviving the first years of follow-up, is particularly large in patients with advanced stages[5,6].
In the Surveillance, Epidemiology, and End Results (SEER 17) database, five-year conditional survival (the probability to survive in the next five years) increased from 61% at baseline to 85% after 5 years in patients with localized tumors, from 34% to 79% in patients with metastases to regional lymph nodes, and from 2% to 64% in patients with distant metastases[6].
In the US Gastric Cancer Collaborative[5] the prognostic significance of T and N status was of paramount importance in the first three years after surgery: indeed three-year survival was respectively 77%, 59%, 43%, 27% in T1, T2, T3, T4, and 65%, 38% in N0, N1. However after 5 years of follow-up depth of tumor invasion and nodal status at baseline were no longer related to prognosis: indeed conditional survival in the next three years was about 78%-87%, irrespective of T or N tier[5].
In a Japanese study patients with early recurrence had more advanced T and N status, and a larger tumor size than patients with late recurrence[3]. However only depth of tumor invasion was independently associated with timing of recurrence.
Thus, in advanced gastric cancer patients, who survive over the first years but still present a notable risk of recurrence compared to early gastric cancers, factors other than TNM stage should be evaluated to correctly predict prognosis.
As stated above, the trend in mortality changes over time and is often unpredictable, therefore analyzing mortality in the oncological field is particular difficult. Parametric models are not feasible, such as the Weibull model which assumes a monotonous increase or decrease in mortality rate over time[7]. Hence, the Cox model, which does not make a priori assumption on the temporal pattern of mortality, is usually the only choice for cancer patients. However, also the Cox model is often difficult to apply to patients with gastric cancer, due to violation of the proportional hazards assumption.
On the contrary, survival analysis encounters less problems in chronic degenerative diseases, such as diabetes, where mortality usually increases during follow-up due to ageing of the population under study.
These topics were investigated in two homogeneous GIRCG series (Gruppo Italiano di Ricerca sul Cancro Gastrico; Italian Research Group for Gastric Cancer), undergoing curative gastrectomy for gastric cancer: (1) temporal trends in mortality, either in whole series or as a function of disease stage, were inspected in a cohort of patients from Padua/Siena/Verona with early or advanced gastric cancer, undergoing curative gastrectomy with limited/extended/superextended (D1/D2/D3) lymphadenectomy[8]. Temporal trend in this gastric cancer series was compared with trend recorded in a cohort of diabetic patients, enrolled in the frame of the Verona Diabetes Study[9]; and (2) problems in survival analysis and possible solutions were investigated in a cohort of patients from Siena/Verona with advanced gastric cancer, operated on with curative gastrectomy and D2/D3 lymphadenectomy[10].
The lack of pre-operative chemotherapy and the adequate staging in both gastric cancer cohorts provided a unique opportunity to investigate both the hazard function over time and the temporal pattern of prognostic significance of main risk factors.
Between 1988 and 2002, 1086 patients underwent gastrectomy for gastric cancer in three GIRCG centers: Padua (n = 270), Siena (n = 371) and Verona (n = 445)[8]. After excluding 1 neuroendocrine tumor, 1 T0 tumor, 7 multicentric tumors, 40 patients dying from postoperative causes, 100 macroscopic or microscopic residual tumors, 937 patients were considered for the study.
As regards T and N status, coded according to the UICC/AJCC TNM 6th edition (1997), 261 patients were classified as T1, 359 as T2, 285 as T3, 32 as T4, while N status was N0, N1, N2, N3 respectively in 404, 299, 142, 92 patients.
Median follow-up in surviving patients was 106 mo (range: 36-216 mo): 3 patients were lost to follow-up. 515 patients died, 432 from tumor recurrence, 83 from other causes.
An Epanechnikov kernel function was used to calculate the weighted kernel-density estimate required to produce a smoothed hazard-function over time[11].
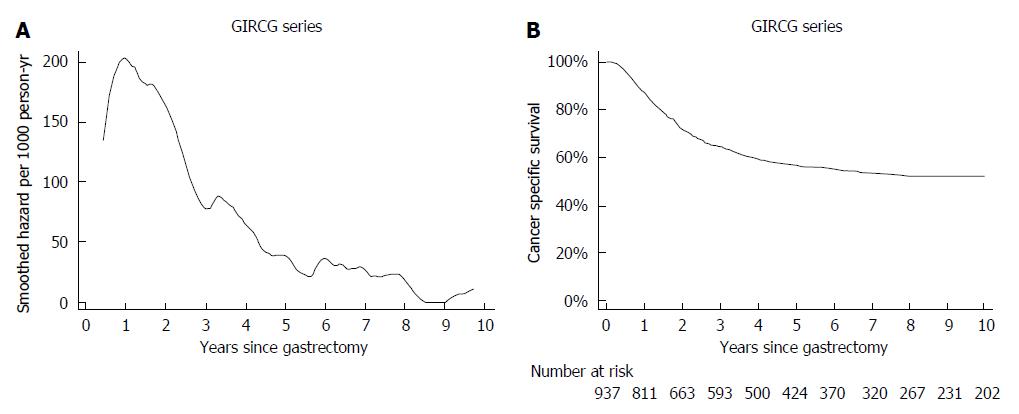
In this GIRCG series mortality from recurrence peaked to 200 deaths per 1000 person-years after 1 year of follow-up and then declined, becoming lower than 40 deaths per 1000 person-years after 5 years and lower than 20 deaths per person-years after 8 years (Figure 1A). This pattern could be inferred also by a shrewd inspection of the corresponding survival curve, which declined very steeply between 6 and 24 mo of follow-up, becoming rather flat thereafter (Figure 1B).
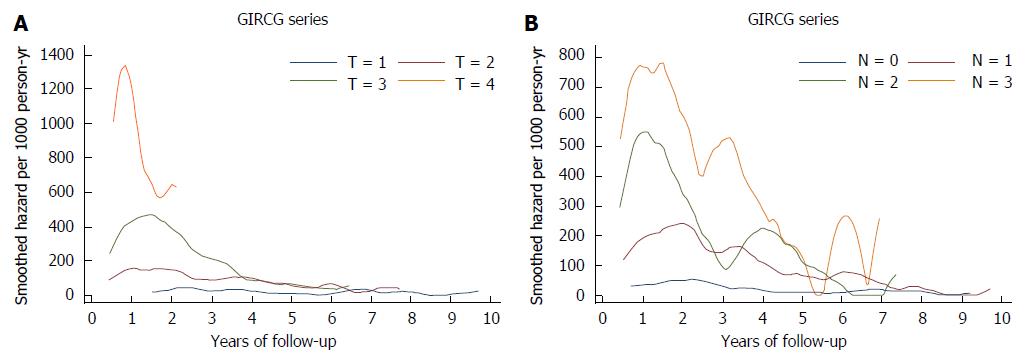
As shown in Figure 2, mortality from recurrence varied widely as a function of T and N status in the first two years of follow-up, and tended to converge thereafter. Interestingly the mortality peak occurred earlier in more advanced T and N tiers.
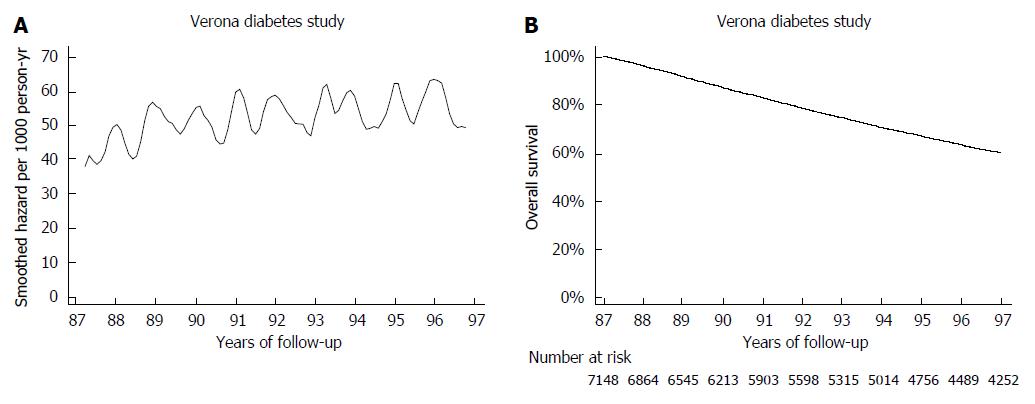
The mortality pattern in the gastric cancer series was compared with the pattern observed in 7148 type 2 diabetic patients from the Verona Diabetes Study. Briefly the Verona Diabetes Study[9] is a population-based monocentric survey, which identified 7148 type 2 diabetic patients in the Verona Social Health Unit on the 31th December 1986, using three different sources of ascertainment (Diabetes Clinic, Family Physicians and Drug Prescription Database) with an estimated 75% completeness of ascertainment[12]. At baseline, 860 patients (12.1%) were treated with diet, 5821 (81.8%) with oral hypoglycemic drugs, 437 (6.1%) with insulin. From 1987 to 1996 2896 patients died, the overall follow-up amounting to 56410 person-years[13]. It can be appreciated that mortality slowly increased during the 10-year follow-up, with ageing of the type 2 diabetic cohort. Seasonal oscillations were also recorded: mortality rates was higher by about 10 deaths/1000 person-years during winter with respect to summer (Figure 3A). Interestingly, these oscillations were too small to be detected in the corresponding survival curve.
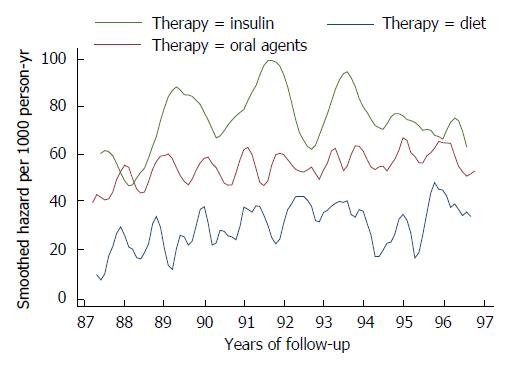
When hazard function was analyzed as a function of treatment, an important marker of disease progression, seasonal oscillations in overall mortality could be clearly detected in all groups but the insulin-treated group, where a very large bandwidth had to be used to smooth the estimated hazard function, due to the small size and the high mortality. Mortality rates as a function of treatment remained separated throughout the follow-up (Figure 4).
Of course, the comparison between the two series has some limitations. First of all, gastric cancer series represents an incident cohort, while the type 2 diabetic patients from the Verona Diabetes Study represents a prevalent cohort. Second, while mortality from gastric cancer is more easy to assess and usually corrected reported in death certificates[14], mortality from diabetes is often a matter of debate, as diabetes is an important risk factor for cardiovascular diseases, and even for certain tumors[13]. As a consequence, mortality from diabetes is often under-reported in death certificates[14]. For these reasons, we chose to analyze mortality from recurrence in gastric cancer patients and overall mortality in type 2 diabetic patients.
With all these limitations in mind, a clear difference was detected between mortality pattern in patients with gastric cancer, a disease with a very high lethality but which nevertheless can be cured, and mortality in patients with diabetes, a disease with much lower lethality but which cannot be cured. Overall mortality pattern was more stable in diabetic patients, as well as the prognostic significance of risk factors over time.
The series comprised 791 patients undergoing gastrectomy with at least D2 lymphadenectomy for advanced gastric cancer in Verona or Siena[10]. Of these 445 patients were operated in Verona from January 1992 to May 2011 and 346 in Siena from January 1994 to June 2011. After excluding 19 subjects with Bormann IV tumour, 2 subjects with neuroendocrine tumours, 75 subjects with early gastric cancer, 127 subjects with non-curative resections, 568 subjects (312 from Verona, 256 from Siena) were left for the analysis.
Tumour invasion (pT) and lymph node status (pN) followed the UICC pathological tumour node metastasis (pTNM) criteria, 7th edition.
Three hundred and fifty-one patients (61.8%) were male, and mean age ± SD was 66.4 ± 11.7 years, ranging from 24 to 92 years. 274 patients underwent D2 lymphadenectomy and 294 D3 lymphadenectomy, and nearly all (539/565 = 95.4%) could be adequately staged, as they had at least 15 lymph nodes retrieved. None of the patients received preoperative chemotherapy.
Patients were followed-up till December 2011. Median follow-up in surviving patients was 89 mo (range, 7-240 mo).
In survival analysis both post-operative deaths and death from recurrence were considered as terminal events. Deaths caused by surgical and non-surgical complications were coded as post-operative deaths, and occurred in the first 38 d after surgery. Survival analysis was repeated by considering only death from recurrence.
Both the log-rank test and the Wilcoxon (-Breslow-Gehan) test were used to evaluate significance of differences among survival curves. The latter test places more weight to the events occurring at the beginning of follow-up, when there are more subjects at risk. The Wilcoxon test is preferred to the log-rank test when the hazard functions do not vary in a proportional way over time[7].
To test whether prognostic significance of the main risk factors changed over time, the proportional-hazards assumption of the Cox model was tested on the basis of Schoenfeld residuals. In addition, the proportionality assumption was checked by graphic methods: it was verified whether -ln[-ln[survival]] curves for each category of risk factors were parallel, when plotted vs ln[analysis time].
During the follow-up 315 (55.5%) patients died, 18 (3.2%) from post-operative causes, 242 (42.6%) from cancer recurrence and 53 (9.3%) from other causes. Cause of death was missing in 2 patients and timing of death in 3 patients.
One hundred and sixty-five deaths from recurrence (68.75%) occurred in the first two years of follow-up, 220 (91.7%) in the first four years, and 234 (97.5%) in the first six years. The highest hazard of death from recurrence was observed in the first 2 years of follow-up. No death from recurrence was observed after 12 years.
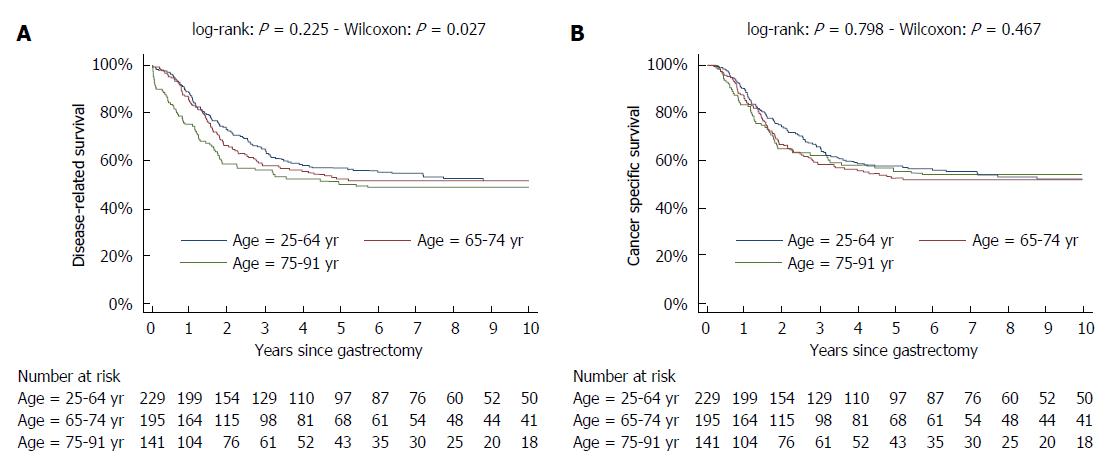
Survival curves were spread as a function of age in the first years, but not afterwards (Figure 5A). This was mainly due to different post-operative mortality, which was low in patients aged 25-64 years (1.3% = 3/231) or 65-74 years (0.5% = 1/196) but substantial in patients aged 75-92 years (9.9% = 14/141) (P < 0.001). Indeed when post-operative mortality was not considered, survival curves were nearly superimposed (Figure 5B).
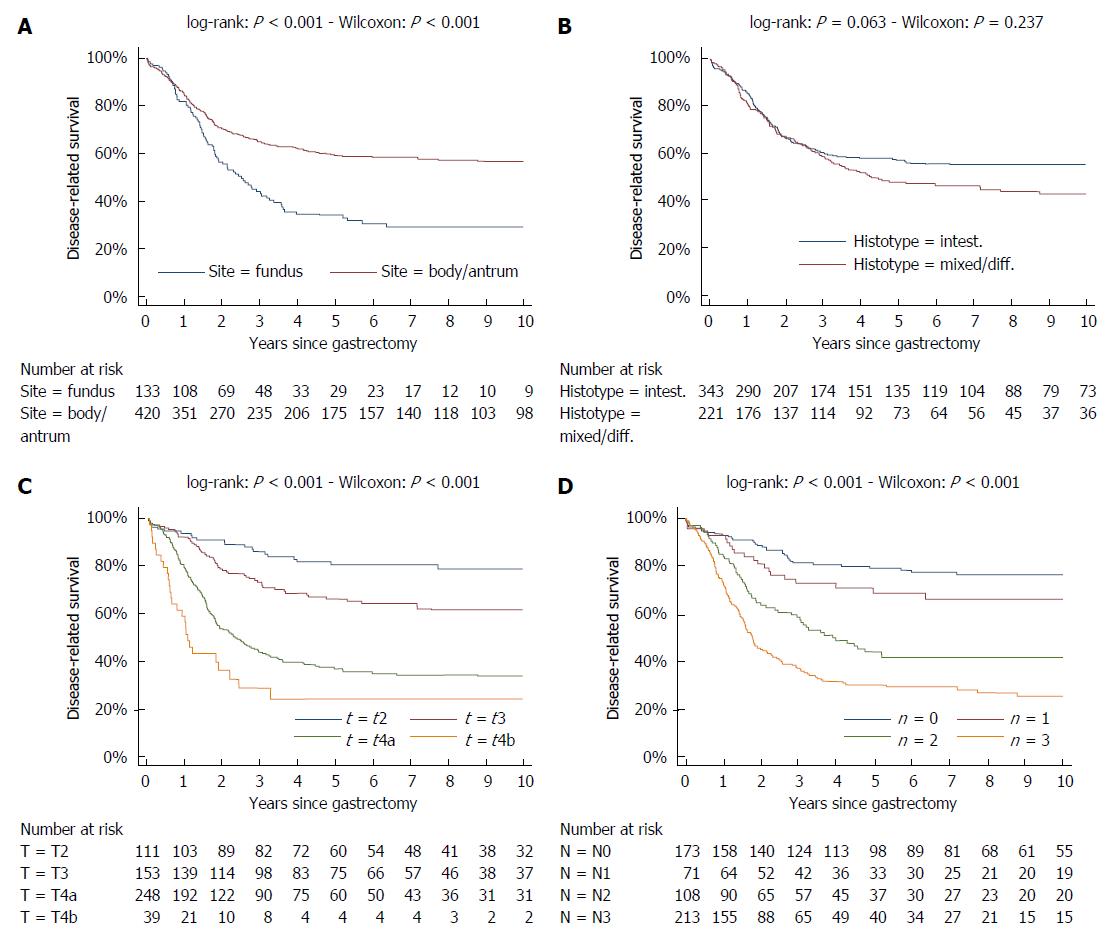
At variance survival curves of the two different histotypes (intestinal and mixed/diffuse) were superimposed in the first three years, but substantially diverged thereafter. Likewise, survival curves of the two different sites (fundus vs body/antrum) diverged after the first year (Figure 6).
Hence, survival curves as a function of age were significantly different according to the Wilcoxon test, which places more weight to first part of follow-up, but not according to the log-rank test. On the contrary, differences among survival curves of different histotypes were nearly significant when evaluated by the log-rank test, but not when reassessed by the Wilcoxon test.
At variance, survival curves of different T and N tiers were well separated throughout the follow-up (Figure 6).
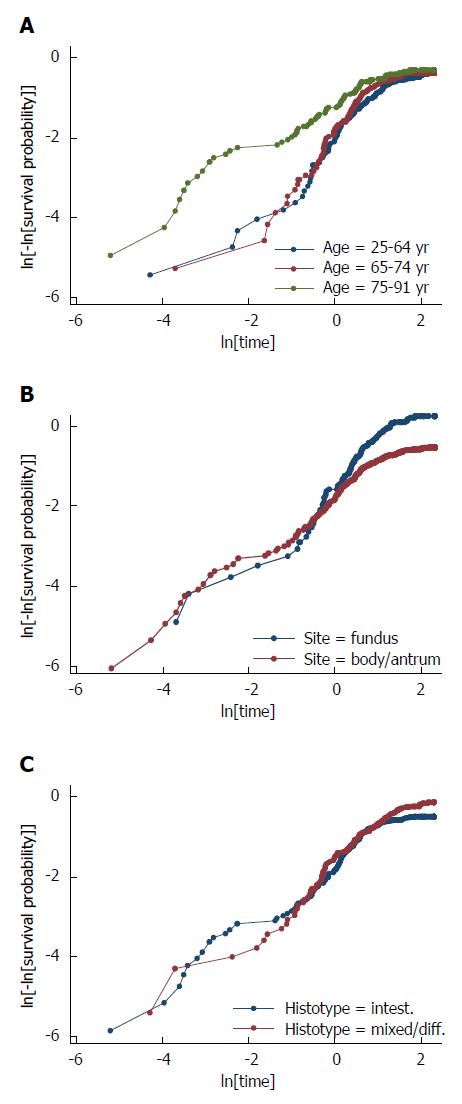
First of all, the proportional hazards assumption was checked by graphic methods: it was verified whether -ln[-ln(survival)] curves for each category of risk factors were parallel, when plotted vs ln(analysis time). It can be appreciated that the proportional-hazards assumption was violated for age, site, histology as the curves were not parallel (Figure 7). As regards age, the curves were initially well separated and converged at the end of the follow-up. The reverse pattern was observed when considering either site or histology: the curves, initially superimposed, diverged at the end of follow-up. Parallel curves were observed as regards T and N status, except for the very beginning of the follow-up.
Proportional hazards assumption was also verified by applying a Cox regression model and then the test based on Schoenfeld residuals, which turned out to be significant both as a whole (P = 0.001) and as regards centre (P = 0.027), age (P = 0.005 for age 75-91 years with respect to age < 65 years), site (P = 0.007) and histology (P = 0.011). Hence, the proportional hazards assumptions of the Cox model were violated, as regards centre, age, site and histology. Hence the Cox model, which assumes the hazard ratio to be constant over time, was not feasible over the whole follow-up.
Interestingly, when considering as terminal event only death from recurrence but not post-operative death, the test based on Schoenfeld residuals was still fully significant as regards centre (P = 0.014), site (P = 0.023) and histology (P = 0.025), but not as regards age (P = 0.060 for age 75-91 years with respect to age < 65 years).
To distinguish between short-term and long-term risk factors, multivariable survival analysis was performed by considering either only the first two years of follow-up or only the subsequent years (Table 1). If one considers only the first 24 mo, site and histology were not significant predictors of mortality, while T and N exerted a strong effect. Histology and site were significant predictors only after two years, while T and N, although significant also in the long-term, lost a great deal of their prognostic significance. Increasing age was associated with higher mortality in the first two years, but not thereafter. Female sex was protecting both in the first two years and thereafter, although significant only in the former period.
| First 2 years of follow-up | Subsequent years | |||
| HR (95%CI) | P value | HR (95%CI) | P value | |
| Centre (Siena vs Verona) | 0.62 (0.44-0.88) | 0.006 | 1.82 (1.06-3.14) | 0.029 |
| Sex (women vs men) | 0.69 (0.49-0.97) | 0.028 | 0.79 (0.48-1.30) | 0.345 |
| Age | < 0.001 | 0.586 | ||
| 65-74 yr vs < 65 yr | 1.67 (1.14-2.44) | 1.18 (0.68-2.04) | ||
| ≥ 75 yr vs < 65 yr | 2.28 (1.50-3.46) | 0.81 (0.38-1.72) | ||
| Site (body/antrum vs fundus) | 0.84 (0.60-1.18) | 0.318 | 0.30 (0.18-0.51) | < 0.001 |
| Histology (mix/diff vs intest) | 0.80 (0.57-1.12) | 0.198 | 1.91 (1.09-3.36) | 0.023 |
| T stage | < 0.001 | 0.043 | ||
| T3 vs T2 | 1.69 (0.82-3.50) | 1.25 (0.59-2.68) | ||
| T4a vs T2 | 3.13 (1.60-6.13) | 2.21 (1.10-4.44) | ||
| T4b vs T2 | 5.14 (2.34-11.27) | 3.26 (0.87-12.17) | ||
| N stage | < 0.001 | 0.007 | ||
| N1 vs N0 | 1.49 (0.70-3.14) | 0.92 (0.35-2.40) | ||
| N2 vs N0 | 3.47 (1.94-6.22) | 2.55 (1.29-5.03) | ||
| N3 vs N0 | 5.28 (3.09-9.04) | 2.36 (1.22-4.57) | ||
| Lymphadenectomy: D3 vs D2 | 0.94 (0.66-1.33) | 0.717 | 0.92 (0.54-1.57) | 0.753 |
The main results of the present study are: (1) mortality from recurrence peaked 1 year after curative gastrectomy in gastric cancer patients and then declined. Mortality peak occurred earlier in more advanced T and N tiers. At variance, in the Verona diabetic cohort overall mortality slowly increased during a 10-year follow-up, with ageing of the type 2 diabetic patients. Seasonal oscillations were also recorded, mortality being higher during winter; (2) depth of tumor invasion and nodal metastases gave a baseline snapshot of tumor progression at the time of diagnosis or tumor excision. In gastric cancer they are the most important predictors of mortality throughout the follow-up, but their prognostic significance tends to fade with time. On the contrary, biological intrinsic tumor characteristics, such as Lauren histotype, exerts a delayed effect on survival. The effect of age on mortality is even more limited in time, being mainly restricted to the post-operative period; and (3) accordingly, in gastric cancer series the proportional hazards assumption of the Cox model was violated, as regards age, site and histology. To cope with this problem, multivariable survival analysis was separately performed by considering only the first two years of follow-up or only the subsequent years.
Hazard function over time can give additional information with respect to survival function. For instance, it allows to detect seasonal oscillations in overall mortality in type 2 diabetic patients. An excess mortality during winter has been recorded also in the general population, especially in elderly men[15]. Recently a GIRCG study recommended to focus oncological follow-up after radical surgery for gastric cancer in the first 3 years, although only 3.2% of patients with recurrence could be treated with potentially radical intent[16]. The pattern of mortality over time seems to support this statement, as mortality from recurrence peaked at 200 deaths per 1000 person-years after 1 year of follow-up and decreased below 90 deaths after 3 years.
Depth of tumor invasion and nodal metastases give a baseline snapshot of tumor progression at the time of diagnosis or tumor excision. They are the most important predictors of mortality throughout the follow-up, but their prognostic significance tends to fade with time. The effect of age on mortality is even more limited in time, being mainly restricted to the post-operative period.
On the contrary, biological intrinsic tumor characteristics, such as Lauren histotype, can affect prognosis in the short term by determining more advanced tumor stage, but they also display a delayed effect on survival. Indeed as regards tumor histology, in the first years of follow-up its prognostic significance is usually masked by N status, as Lauren diffuse cancers are more prone to give lymph node metastases. For instance, in the Verona series Lauren histology was an independent prognostic factor when N classification was based on site (TNM 1987) but not when based on number of positive nodes (TNM 1997)[17].
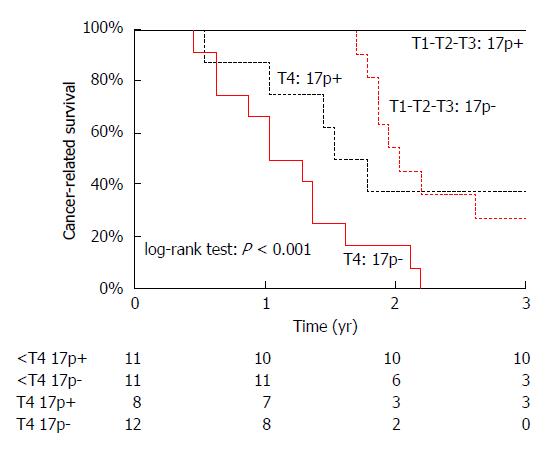
A similar pattern was recorded in adenocarcinoma arising from the ampulla of Vater, where “depth of invasion was the most important prognostic variable in the first 2 years of follow-up”, while allelic losses (LOH) at chromosome 17p, containing the TP53 gene, became the most important variable thereafter[18] (Figure 8). Indeed, “when considering only the first 20 mo of follow-up, statistical significance was retained by T stage (P < 0.001), but not by chromosome 17p LOH (P = 0.060); the reverse pattern was observed when excluding the first 20 mo of follow-up (P = 0.542 for T stage and P < 0.001 for chromosome 17p LOH)”[18].
In the present series of gastric cancer patients the proportional hazards assumption of the Cox model was violated, as regards centre, age, site and histology.
Several solutions are available[7] but none seems fully satisfactory: (1) the Cox model could be stratified by those variables which do not satisfy the proportional hazards assumption. As a drawback, these variables are virtually excluded from survival analysis; indeed their impact on survival cannot be estimated nor significance of interactions with other variables. In the present series, it would be practical to stratify by centre, but not by age, site or histology, as the latter variables could be useful to tailor treatment for patient subgroups; (2) post-operative mortality could be excluded from the analysis. This would be particularly suited for age, as post-operative mortality preferentially affects older people, and this hampers the proportional hazards assumption. However, post-operative mortality is necessary to evaluate different treatments, such as survival after different surgical procedures[19,20] or chemoradiotherapy[21], or the quality of surgical procedures[8]; and (3) time-dependent covariates could be used, but they are somewhat difficult to interpret. Alternatively follow-up can be split into an early and a late period, and two separate Cox models can be employed for each period.
Survival analysis is simpler in patients affected by chronic degenerative diseases, such as diabetes, where the trend in mortality is rather stable over time. Hence parametric models could be suited for these patients, such as the Weibull model, assuming a monotonous increase or decrease in mortality rate over time[7]. Indeed in the Verona Diabetes Study observed deaths in different time intervals were not significantly different from expected deaths according to the Weibull model[22].
It can be concluded that in gastrointestinal cancer biological characteristics, such as histology or genetic features, exerts a delayed effect on prognosis. On the contrary, the actual spread of the tumor has an immediate effect on survival.
According to the Authors’ opinion methodological research in the surgical field is necessary in order to develop new statistical methods to compare groups with non-proportional hazards.
P- Reviewer: Ananiev J, Qi F S- Editor: Qi Y L- Editor: A E- Editor: Wang CH
| 1. | Ferlay J, Soerjomataram I, Ervik M, Dikshit R, Eser S, Mathers C, Rebelo M, Parkin DM, Forman D, Bray F. GLOBOCAN 2012: Estimated Cancer Incidence, Mortality and Prevalence Worldwide in 2012. Available from: http://globocan.iarc.fr. |
| 2. | Edge SB, Byrd DR, Compton CC, Fritz AG, Greene FL, Trotti A, editors . AJCC Cancer Staging Handbook. 7th ed. New York: Springer-Verlag 2010; . |
| 3. | Otsuji E, Kobayashi S, Okamoto K, Hagiwara A, Yamagishi H. Is timing of death from tumor recurrence predictable after curative resection for gastric cancer? World J Surg. 2001;25:1373-1376. [PubMed] |
| 4. | Dikken JL, Baser RE, Gonen M, Kattan MW, Shah MA, Verheij M, van de Velde CJ, Brennan MF, Coit DG. Conditional probability of survival nomogram for 1-, 2-, and 3-year survivors after an R0 resection for gastric cancer. Ann Surg Oncol. 2013;20:1623-1630. [RCA] [PubMed] [DOI] [Full Text] [Cited by in Crossref: 40] [Cited by in RCA: 63] [Article Influence: 4.8] [Reference Citation Analysis (0)] |
| 5. | Kim Y, Ejaz A, Spolverato G, Squires MH, Poultsides G, Fields RC, Bloomston M, Weber SM, Votanopoulos K, Acher AW. Conditional survival after surgical resection of gastric cancer: a multi-institutional analysis of the US Gastric Cancer Collaborative. Ann Surg Oncol. 2015;22:557-564. [RCA] [PubMed] [DOI] [Full Text] [Cited by in Crossref: 48] [Cited by in RCA: 55] [Article Influence: 5.0] [Reference Citation Analysis (0)] |
| 6. | Wang SJ, Emery R, Fuller CD, Kim JS, Sittig DF, Thomas CR. Conditional survival in gastric cancer: a SEER database analysis. Gastric Cancer. 2007;10:153-158. [RCA] [PubMed] [DOI] [Full Text] [Cited by in Crossref: 91] [Cited by in RCA: 91] [Article Influence: 5.1] [Reference Citation Analysis (0)] |
| 7. | Marubini E, Valsecchi MG. Analysing Survival Data from Clinical Trials and Observational Studies. New York: John Wiley Sons 1995; . |
| 8. | Verlato G, Roviello F, Marchet A, Giacopuzzi S, Marrelli D, Nitti D, de Manzoni G. Indexes of surgical quality in gastric cancer surgery: experience of an Italian network. Ann Surg Oncol. 2009;16:594-602. [RCA] [PubMed] [DOI] [Full Text] [Cited by in Crossref: 51] [Cited by in RCA: 46] [Article Influence: 2.9] [Reference Citation Analysis (0)] |
| 9. | Muggeo M, Verlato G, Bonora E, Bressan F, Girotto S, Corbellini M, Gemma ML, Moghetti P, Zenere M, Cacciatori V. The Verona diabetes study: a population-based survey on known diabetes mellitus prevalence and 5-year all-cause mortality. Diabetologia. 1995;38:318-325. [RCA] [PubMed] [DOI] [Full Text] [Cited by in Crossref: 100] [Cited by in RCA: 90] [Article Influence: 3.0] [Reference Citation Analysis (0)] |
| 10. | de Manzoni G, Verlato G, Bencivenga M, Marrelli D, Di Leo A, Giacopuzzi S, Cipollari C, Roviello F. Impact of super-extended lymphadenectomy on relapse in advanced gastric cancer. Eur J Surg Oncol. 2015;41:534-540. [RCA] [PubMed] [DOI] [Full Text] [Cited by in Crossref: 30] [Cited by in RCA: 36] [Article Influence: 3.6] [Reference Citation Analysis (0)] |
| 11. | Silverman BW. Density Estimation for Statistics and Data Analysis. London: Chapman Hall 1992; . |
| 12. | Verlato G, Muggeo M. Capture-recapture method in the epidemiology of type 2 diabetes: a contribution from the Verona Diabetes Study. Diabetes Care. 2000;23:759-764. [RCA] [PubMed] [DOI] [Full Text] [Cited by in Crossref: 26] [Cited by in RCA: 28] [Article Influence: 1.1] [Reference Citation Analysis (0)] |
| 13. | Verlato G, Zoppini G, Bonora E, Muggeo M. Mortality from site-specific malignancies in type 2 diabetic patients from Verona. Diabetes Care. 2003;26:1047-1051. [RCA] [PubMed] [DOI] [Full Text] [Cited by in Crossref: 108] [Cited by in RCA: 101] [Article Influence: 4.6] [Reference Citation Analysis (0)] |
| 14. | Goldacre MJ. Cause-specific mortality: understanding uncertain tips of the disease iceberg. J Epidemiol Community Health. 1993;47:491-496. [RCA] [PubMed] [DOI] [Full Text] [Cited by in Crossref: 74] [Cited by in RCA: 85] [Article Influence: 2.7] [Reference Citation Analysis (0)] |
| 15. | Rau R, Doblhammer G. Seasonal mortality in Denmark: the role of sex and age. Demographic Res. 2003;9:197-222. [RCA] [DOI] [Full Text] [Cited by in Crossref: 14] [Cited by in RCA: 14] [Article Influence: 0.6] [Reference Citation Analysis (0)] |
| 16. | Baiocchi GL, Marrelli D, Verlato G, Morgagni P, Giacopuzzi S, Coniglio A, Marchet A, Rosa F, Capponi MG, Di Leo A. Follow-up after gastrectomy for cancer: an appraisal of the Italian research group for gastric cancer. Ann Surg Oncol. 2014;21:2005-2011. [RCA] [PubMed] [DOI] [Full Text] [Cited by in Crossref: 11] [Cited by in RCA: 32] [Article Influence: 2.9] [Reference Citation Analysis (0)] |
| 17. | de Manzoni G, Verlato G, Guglielmi A, Laterza E, Tomezzoli A, Pelosi G, Di Leo A, Cordiano C. Classification of lymph node metastases from carcinoma of the stomach: comparison of the old (1987) and new (1997) TNM systems. World J Surg. 1999;23:664-669. [RCA] [PubMed] [DOI] [Full Text] [Cited by in Crossref: 29] [Cited by in RCA: 32] [Article Influence: 1.2] [Reference Citation Analysis (0)] |
| 18. | Iacono C, Verlato G, Zamboni G, Scarpa A, Montresor E, Capelli P, Bortolasi L, Serio G. Adenocarcinoma of the ampulla of Vater: T-stage, chromosome 17p allelic loss, and extended pancreaticoduodenectomy are relevant prognostic factors. J Gastrointest Surg. 2007;11:578-588. [RCA] [PubMed] [DOI] [Full Text] [Cited by in Crossref: 15] [Cited by in RCA: 16] [Article Influence: 0.9] [Reference Citation Analysis (0)] |
| 19. | de Manzoni G, Verlato G, Guglielmi A, Laterza E, Genna M, Cordiano C. Prognostic significance of lymph node dissection in gastric cancer. Br J Surg. 1996;83:1604-1607. [RCA] [PubMed] [DOI] [Full Text] [Cited by in Crossref: 91] [Cited by in RCA: 93] [Article Influence: 3.2] [Reference Citation Analysis (0)] |
| 20. | De Manzoni G, Verlato G, Roviello F, Di Leo A, Marrelli D, Morgagni P, Pasini F, Saragoni L, Tomezzoli A. Subtotal versus total gastrectomy for T3 adenocarcinoma of the antrum. Gastric Cancer. 2003;6:237-242. [RCA] [PubMed] [DOI] [Full Text] [Cited by in Crossref: 25] [Cited by in RCA: 28] [Article Influence: 1.3] [Reference Citation Analysis (0)] |
| 21. | Zanoni A, Verlato G, Giacopuzzi S, Weindelmayer J, Casella F, Pasini F, Zhao E, de Manzoni G. Neoadjuvant concurrent chemoradiotherapy for locally advanced esophageal cancer in a single high-volume center. Ann Surg Oncol. 2013;20:1993-1999. [RCA] [PubMed] [DOI] [Full Text] [Cited by in Crossref: 32] [Cited by in RCA: 33] [Article Influence: 2.5] [Reference Citation Analysis (0)] |
| 22. | Verlato G, Muggeo G. The Weibull regression model is suitable to analyze survival in NIDDM patients from Verona. 33rd annual meeting of the EDESG (European Diabetes Epidemiology Study Group). France: Abbaye des Vaux de Cernay 1998; . |


