Published online Apr 21, 2015. doi: 10.3748/wjg.v21.i15.4509
Peer-review started: November 17, 2014
First decision: December 11, 2014
Revised: December 31, 2014
Accepted: February 12, 2015
Article in press: February 13, 2015
Published online: April 21, 2015
Processing time: 156 Days and 23.4 Hours
AIM: To explore the feasibility of non-invasive quantitative estimation of portal venous pressure by contrast-enhanced ultrasound (CEUS) in a canine model.
METHODS: Liver fibrosis was established in adult canines (Beagles; n = 14) by subcutaneous injection of carbon tetrachloride (CCl4). CEUS parameters, including the area under the time-intensity curve and intensity at portal/arterial phases (Qp/Qa and Ip/Ia, respectively), were used to quantitatively assess the blood flow ratio of the portal vein/hepatic artery at multiple time points. The free portal venous pressures (FPP) were measured by a multi-channel baroreceptor using a percutaneous approach at baseline and 8, 16, and 24 wk after CCl4 injections in each canine. Liver biopsies were obtained at the end of 8, 16, and 24 wk from each animal, and the stage of the fibrosis was assessed according to the Metavir scoring system. A Pearson correlation test was performed to compare the FPP with Qp/Qa and Ip/Ia.
RESULTS: Pathologic examination of 42 biopsies from the 14 canines at weeks 8, 16, and 24 revealed that liver fibrosis was induced by CCl4 and represented various stages of liver fibrosis, including F0 (n = 3), F1 (n = 12), F2 (n = 14), F3 (n = 11), and F4 (n = 2). There were significant differences in the measurements of Qp/Qa (19.85 ± 3.30 vs 10.43 ± 1.21, 9.63 ± 1.03, and 8.77 ± 0.96) and Ip/Ia (1.77 ± 0.37 vs 1.03 ± 0.12, 0.83 ± 0.10, and 0.69 ± 0.13) between control and canine fibrosis at 8, 16, and 24 wk, respectively (all P < 0.001). There were statistically significant negative correlations between FPP and Qp/Qa (r = -0.707, P < 0.001), and between FPP and Ip/Ia (r = -0.759, P < 0.001) in the canine fibrosis model. Prediction of elevated FPP based on Qp/Qa and Ip/Ia was highly sensitive, as assessed by the area under the receiver operating curve (0.866 and 0.895, respectively).
CONCLUSION: CEUS is a potential method to accurately, but non-invasively, estimate portal venous pressure through measurement of Qp/Qa and Ip/Ia parameters.
Core tip: The measurement of portal pressure plays an important role in the evaluation of liver disease progression. Contrast-enhanced ultrasound techniques can provide hemodynamic parameters of blood circulation and tissue perfusion. The introduction of the area under the time-intensity curve and intensity at portal/arterial phase parameters has obvious advantages over absolute values, such as peak intensity, as the approach reduces other sources of interference. These parameters were negatively correlated with free portal pressure, supporting the use of contrast-enhanced ultrasound as a method to non-invasively estimate portal pressure.
- Citation: Zhai L, Qiu LY, Zu Y, Yan Y, Ren XZ, Zhao JF, Liu YJ, Liu JB, Qian LX. Contrast-enhanced ultrasound for quantitative assessment of portal pressure in canine liver fibrosis. World J Gastroenterol 2015; 21(15): 4509-4516
- URL: https://www.wjgnet.com/1007-9327/full/v21/i15/4509.htm
- DOI: https://dx.doi.org/10.3748/wjg.v21.i15.4509
Portal hypertension is a severe complication of chronic liver disease and cirrhosis that causes many clinical abnormalities due to hemodynamic changes in portal pressure. Measurement of portal venous pressure therefore plays an important role in the evaluation of liver disease progression[1].
There are two reliable methods for accurately evaluating portal pressure: hepatic venous pressure gradient (HVPG) and free portal pressure (FPP) measurements[2]. However, both methods are performed under invasive procedures and cannot be routinely used for assessing and monitoring the progression of chronic liver disease. Therefore, a non-invasive and more reliable method to quantitatively evaluate portal pressure would present distinct advantages for patient evaluation over time.
Conventional grey scale ultrasound is the first-line imaging modality in the screening of portal hypertension[3-5]. The enlargement of the portal vein is a simple indicator for a clinical diagnosis of portal hypertension. Doppler ultrasound can provide valuable parameters for the evaluation of portal hypertension, such as velocity of the portal blood flow, direction of the portal flow, hepatic vein waveforms, pulsatility index, and resistance index of hepatic and splenic arteries. However, all of these parameters have a poor linear relationship with portal venous pressure. Thus, the unreliability and non-reproducibility of the ultrasound technique limits its clinical utility for the assessment of portal hypertension status.
Newly-developed ultrasound contrast agents and contrast-enhanced ultrasound (CEUS) techniques now provide hemodynamic parameters regarding blood circulation and tissue perfusion. As microbubble-based ultrasound contrast agent is neither discharged from the capillaries nor diffused into the interstitium, the signal intensity of CEUS is related to the concentration of the agent within the blood vessel. Investigators have found that several CEUS features, such as the arrival time of the contrast agent to the hepatic vein and the quantitative analysis of the enhancement level of the liver parenchyma, may be useful for indirect assessment of liver cirrhosis and portal hypertension[6-9].
To validate a new imaging technique for the measurement of portal pressure, a large animal model with chronic liver disease is necessary. The canine animal model, where liver fibrosis and cirrhosis is induced by carbon tetrachloride (CCl4), is often currently used to study hemodynamic changes of portal hypertension. Furthermore, the canine model is similar to human liver cirrhosis in serologic and pathologic physiology. Studies have demonstrated that canines develop liver fibrosis with elevation of portal pressure within 3-6 mo after injection of CCl4[10].
In this study, portal pressure was quantitatively estimated with CEUS in the hepatic fibrosis canine model and compared to catheter-based portal pressure measurement as the gold standard.
The study was reviewed and approved by the Beijing Friendship Hospital Institutional Review Board (Beijing, China). All procedures involving animals were reviewed and approved by the Institutional Animal Care and Use Committee of Beijing Friendship Hospital (IACUC protocol number: 12-5001). Animals were housed in the animal facility at the Beijing Friendship Hospital and maintained under constant conditions at room temperature (20 ± 2 °C) and a relative humidity of 65% ± 10%. Animals were fed commercial canine food with access to tap water, and were quarantined for a two-week period before the study began.
Healthy adult Beagles (n = 14; 7 males and 7 females; weight: 10.5-14.5 kg) were obtained from the Beijing Rixin Technology Company (Beijing, China). To establish the liver fibrosis model, the animals received a subcutaneous injection of 60% CCl4 olive oil emulsion on the dorsal area of the body at a dose of 1.0-1.5 mL/kg every 7 d. Penicillin (40 U/g, i.m., q.d.) was administered on the first three consecutive days to prevent infection. After the injection, all animals were fed with granule feedstuff mixed with 10% lard. The amount of granule feedstuff was 15 g/kg per day for the first three days, but then left uncontrolled between the fourth and seventh days. The animal experiment lasted six months.
CEUS was performed with an IU22 system (Philips Healthcare, Amsterdam, Netherlands) and a 2-5 MHz broadband convex array transducer. Real-time harmonic contrast imaging with a mechanical index of 0.06 was utilized. The depth of the image was maintained at 8-10 cm, and all parameters were consistent for all animals. The second-generation contrast agent SonoVue (Bracco Diagnostic Inc., Milan, Italy), which contains sulfur hexafluoride-filled microbubbles, was used for CEUS imaging of the liver and renal parenchyma.
The animals were anesthetized with pentobarbital sodium (30 mg/kg) through a 20-gauge catheter in an auricular vein after fasting for 12 h. All imaging was performed in the supine position. After conventional B-mode and color Doppler imaging was performed, the probe was placed in the subcostal position to display the portal vessels in the liver-kidney section. A bolus of SonoVue (0.5 mL) was then administered and immediately followed by an injection of normal saline (5 mL). The time for the agent to arrive at the kidney and liver was recorded with the timer on the ultrasound system. The real-time contrast imaging clips were stored in the built-in hard drive for later measurement and analysis.
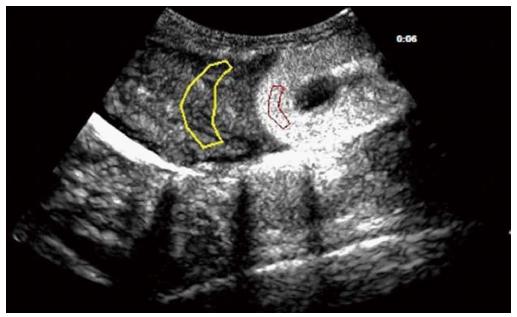
In the liver-kidney section, the regions of interest (ROIs) were set on the hepatic parenchyma and the renal cortex (Figure 1). The ROIs were carefully placed on each section of the liver in order to avoid intrahepatic large vessels. Time-intensity curves (TICs) of CEUS for both ROIs were generated simultaneously with QLAB software on the IU22 system. The quality of the fit for the TICs was over 80%.
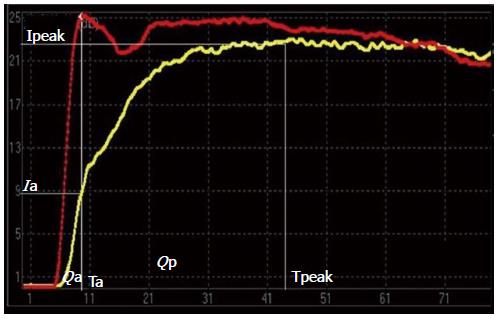
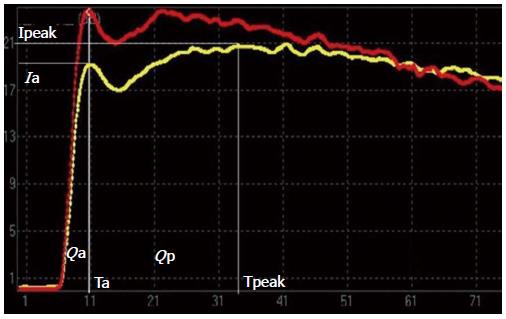
Because the liver has two independent blood supply systems (the hepatic artery and the portal vein) the arterial and portal phases cannot be clearly differentiated on the TIC of hepatic parenchyma. Thus, the computed tomography (CT) method for the evaluation of portal hypertension was adapted [i.e., the time to maximum adjacent organ (splenic or renal cortical) enhancement as the demarcation point for the hepatic artery and portal vein phases][11]. The time point when peak renal intensity was reached was used as the demarcation between the hepatic arterial and portal venous phases on the TIC. The TIC parameters for liver-kidney sectional imaging were defined as follows: (1) time of the hepatic arterial phase (Ta): the time when the renal intensity had reached the peak on the TIC; (2) intensity of the hepatic arterial phase (Ia): intensity at the time of Ta on the TIC of the hepatic parenchyma; (3) intensity of the hepatic parenchyma (Ipeak): maximum intensity from the TIC of the hepatic parenchyma; (4) peak time of the hepatic parenchyma (Tpeak): time when the TIC arrived at Ipeak; (5) intensity of the portal venous phase (Ip): Ipeak-Ia, representing the continuously increasing intensity during the portal venous phase; (6) Qp/Qa: area under the curve of the portal venous phase/hepatic arterial phase =∫TaTpeak I(t)dt/∫0Ta I(t)dt representing the proportion of portal vein and hepatic arterial perfusion; and (7) Ip/Ia: intensity of the portal venous phase/hepatic arterial phase.
All animals underwent portal pressure measurements immediately following CEUS. Free portal venous pressure (FPP) was measured with a multi-channel physiologic signal acquisition system equipped with a baroreceptor (RM6240; Chengdu Instrument Factory, Chengdu, China). Measurements were made with a percutaneous approach at the baseline and 8, 16, and 24 wk after the induction of liver fibrosis in each canine. Under general anesthesia, a 21-gauge needle over a guide wire was inserted into the right branch of the portal vein. The needle core was removed and connected to the baroreceptor. The pressure tracing was recorded for 45-60 s in order to obtain a stable measurement and demonstrate respiration fluctuation. FPP was defined as the mean of five consecutive waveforms.
After the FPP measurement, all animals underwent percutaneous biopsy of the right lobe of the liver under ultrasound guidance in the same experiment. Two core specimens > 1.5 cm in length were obtained from each animal with an 18-gauge needle biopsy device (BARD Magnum; BARD Inc., Tempe, AZ, Unites States). Biopsies were pathologically evaluated, and hepatic fibrosis was classified according to the Metavir scoring system as follows: F0, no fibrosis; F1, portal fibrosis without septa; F2, portal fibrosis and few septa; F3, numerous septa without cirrhosis; and F4, cirrhosis[12].
Quantitative variables are expressed as the mean ± SD. The repeated measures analysis of variance was utilized to compare FPP and CEUS parameters at multiple time points in all canines. A Pearson correlation test was used to compare Ip/Ia and Qp/Qa with FPP for all canines. P < 0.05 was considered statistically significant.
Pathologic examination of liver biopsies (n = 42) obtained from animals at 8, 16, and 24 wk revealed that different stages of liver fibrosis were successfully created in 14 canines. Fibrosis in the canine liver biopsies was staged according to the Metavir scoring system as follows: F0 (n = 3), F1 (n = 12), F2 (n = 14), F3 (n = 11), and F4 (n = 2) (Table 1). Although all stages of fibrosis were represented, cirrhosis was evident in only two cases.
| Stage | 8th wk | 16th wk | 24th wk | Total |
| F0 | 3 | 0 | 0 | 3 |
| F1 | 9 | 3 | 0 | 12 |
| F2 | 2 | 8 | 4 | 14 |
| F3 | 0 | 3 | 8 | 11 |
| F4 | 0 | 0 | 2 | 2 |
| Total | 14 | 14 | 14 | 42 |
The values of FPP increased gradually in the 14 canines over the 24-wk period. There were significant differences for FPP at 8, 16, and 24 wk compared to baseline FPP values from the canines (P < 0.001) (Table 2).
| Time in weeks | FPP in cm H2O | Qp/Qa | Ip/Ia |
| Normal | 10.26 ± 2.12 | 19.85 ± 3.30 | 1.77 ± 0.37 |
| 8 | 18.31 ± 3.17 | 11.32 ± 0.92 | 1.04 ± 0.12 |
| 16 | 28.20 ± 2.57 | 9.43 ± 0.85 | 0.85 ± 0.07 |
| 24 | 36.30 ± 2.21 | 7.27 ± 0.81 | 0.66 ± 0.13 |
| P | < 0.001 | < 0.001 | < 0.001 |
The TICs obtained from baseline and at 24 wk (F4) of induced fibrosis are presented in Figures 2 and 3. The duration of the hepatic arterial phase was shorter in liver fibrosis than the duration of the portal venous phase of the baseline liver (Figure 2). In the liver fibrosis model, the duration of the hepatic arterial phase increased while the duration of portal venous phase decreased (Figure 3). Qp/Qa and Ip/Ia declined in the canine model, and there were significant differences at 8, 16, and 24 wk compared to the baseline (Table 2).
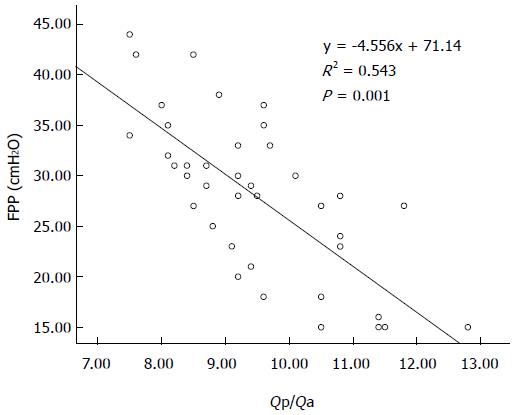
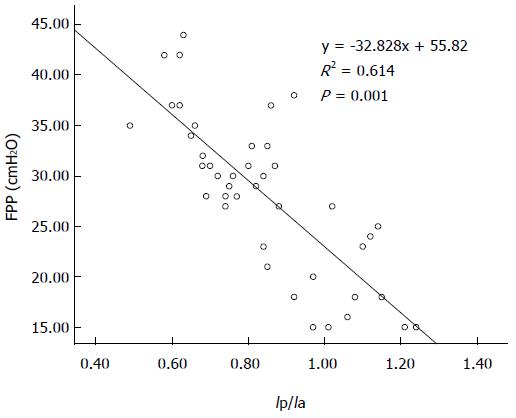
There was a statistically significant negative correlation between FPP and Qp/Qa (r = -0.707; P < 0.001), and between FPP and Ip/Ia (r = -0.759; P < 0.001) in the canine model. Linear regression equations were y = -4.556x + 71.14 and y = -32.828x + 55.82, respectively (Figures 4 and 5).
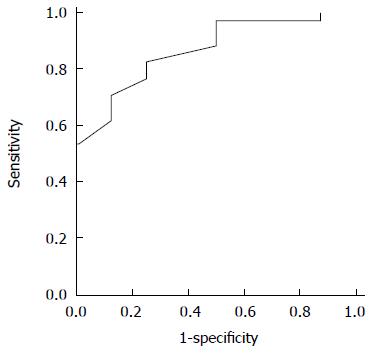
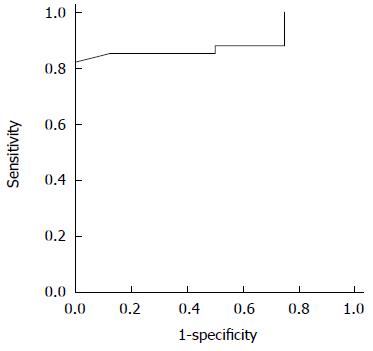
The utility of the CEUS measurements in the prediction of elevated FPP was evaluated by the area under the receiver operating characteristic curves: Qp/Qa was 0.866 for elevated portal pressure (FPP ≥ 18 cm H2O) and 0.895 for Ip/Ia (Figures 6 and 7). The sensitivity and specificity of Qp/Qa were 76 and 86%, and 85 and 87%, respectively, for Ip/Ia. These results indicated that Qp/Qa and Ip/Ia were favorable predictors for elevated portal pressure in liver fibrosis.
There are two reliable methods for accurately evaluating portal pressure: HVPG and FPP measurements. Measurement of the HVPG has been accepted as the gold standard for assessing the degree of portal hypertension[13-16]. The HVPG displays the difference in pressure between a free position and a wedged position in the hepatic vein. It also actually reflects the sinusoidal pressure, but it is not routinely performed due to its invasive nature and the special equipment and technical expertise that are required. While FPP is a measurement that directly reflects the portal pressure, it is also obtained intraoperatively and, therefore, not feasible for repeated assessment in a clinical setting. In addition, FPP cannot be used to determine the portal pressure in the early stages of liver disease and so is inappropriate for monitoring disease progression. In this study, ultrasound-guided transportal puncture was used to measure FPP. This method is simple, easy to perform, and can be conducted repeatedly over the course of disease progression. Furthermore, the baroreceptor used in this study is more sensitive than the traditional catheter. FPP in the canine model increased gradually as the experiment progressed and FPP was successfully measured in all canines.
CEUS provides hemodynamic information on blood circulation and tissue perfusion. Several previous studies have suggested that the severity of portal hypertension in patients with chronic liver disease is strongly correlated with a variety of CEUS features, such as arrival time and transit time of the hepatic vein[17,18]. However, other investigators question the approach, and suggest that CEUS has no clear diagnostic value, particularly for mild and moderately elevated portal pressure[19]. The CEUS methodology has recently expanded the potential for hemodynamic studies performed in the United States[20]. The Ip/Ia and Qp/Qa proposed in this study are new CEUS features for evaluating the blood flow ratio of the portal vein/hepatic artery. Quantitative analysis of CEUS is affected by many factors, including probe frequency, mechanical index, analysis software, concentration of the agent, and the area, shape, depth, and position of the ROI. In order to reduce the influence of these other factors, the introduction of Ip/Ia and Qp/Qa parameters, which are obtained from the same area, has obvious advantages over such absolute values as peak intensity. The ratio eliminates the influences mentioned above and reflects the theoretic significance of hepatic parenchymal perfusion parameter ratio changes.
Both the portal vein and the hepatic artery feed the hepatic blood supply. Scholars believe that there is a significant correlation between intrahepatic blood flow and portal pressure[21]. Current research indicates that the initiating factor in portal hypertension is increased resistance in the portal vein. Over the course of chronic liver disease, various factors lead to increased intrahepatic vascular resistance, such as the deposition of collagen fibers, the elastic decline of liver sinusoidal endothelial cells, the transformation of stellate cells into fibroblasts, and microthrombosis in the distal vein[22,23]. Moreover, intrahepatic hemodynamic changes, such as arteriovenous or portovenous shunting and the arterialization of capillary beds in the liver, also contribute to high portal pressure[24-26]. All of the above factors lead to a reduction in the amount of portal blood flow. Meanwhile, a compensatory increase in the blood flow of the hepatic artery, due to the buffer response, increases the proportion of the blood flow in the hepatic artery[27,28]. The histopathologic changes in the canine model induced by CCl4 are similar to human liver fibrosis and cirrhosis. Previous studies in canine models revealed that, in the early stages of liver fibrosis, the possible cause of elevated portal pressure was increased resistance of the blood stream due to sinusoid capillarization and activation of hepatic stellate cells[10]. Our data, wherein Qp/Qa and Ip/Ia declined, support these findings; the blood flow ratio of the portal vein/hepatic artery decreased, while the portal pressure increased, which is consistent with the histopathologic and hemodynamic changes of increasing portal pressure as mentioned previously. As liver fibrosis progressed and portal pressure increased, the TIC pattern from the liver parenchyma later in the experiment was almost the same as that of the renal cortex as, under these conditions, liver parenchyma infusion is mainly from the hepatic artery.
In the present study, established CT methods were adapted for evaluation of portal hypertension. Some investigators who have previously used CT perfusion imaging concluded that, as the portal pressure increased, hepatic arterial blood flow increases while the portal venous blood flow decreases[11,29]. The correlation between the parameters of spiral CT perfusion imaging and portal vein pressure in normal canines has been evaluated, and the results demonstrated that portal pressure was negatively correlated with portal venous perfusion[30]. Although CT has certain advantages in the evaluation of portal hypertension, the technique also has limitations. First, the frame rate is too low, making boundaries for the hepatic artery and portal venous perfusion phase inaccurate. Second, the iodinated contrast agent will diffuse from the capillary walls into the tissue space and impact the accuracy of portal venous perfusion phase detection. In contrast, CEUS has high temporal resolution, with a frame rate of 10 frames per second or more, and can more accurately distinguish enhanced phase, speed, and intensity between the hepatic artery and the portal vein.
The present study has some limitations. First, the number of experimental animals was limited. Second, measurements were conducted under anesthesia, meaning that respiratory motion artifacts of CEUS images may have affected the accuracy of the TICs. This particular issue was overcome in part by maintaining a low breathing amplitude in order to limit the range of movement, leading to a TIC quality of fit of over 80%. Finally, few biopsies were staged as F4. In the future, more biopsies representing each stage should be obtained in order to rigorously assess the utility of the CEUS measurements.
In conclusion, CEUS is a potential method to quantitatively and non-invasively estimate portal venous pressure via determination of Qp/Qa and Ip/Ia parameters. Animal experiments demonstrated that Qp/Qa and Ip/Ia were favorable predictors for elevated portal pressure in liver fibrosis, which can provide the basis for effectively measuring portal pressure levels during the progression of chronic liver disease. More measurements in larger cohorts are needed in order to confirm these preliminary results, as well as to further demonstrate clinical utility.
Portal hypertension is a severe complication of chronic liver disease and cirrhosis that directly leads to many clinical complications due to hemodynamic changes in portal pressure. Hepatic venous pressure gradient and free portal pressure (FPP) measurements are currently the two most reliable methods for accurately evaluating portal pressure, but are only performed under invasive procedures. Therefore, a non-invasive method to evaluate portal pressure over time would present distinct clinical advantages. The hepatic blood supply is fed by both the portal vein and hepatic artery. Current research indicates that the initiating factor in portal hypertension is increased resistance of the portal vein, which leads to a reduction in the amount of portal blood flow. Contrast-enhanced ultrasound (CEUS) techniques can provide the hemodynamic parameters of blood circulation and tissue perfusion. Thus, the aim of this study was to verify whether there is a significant correlation between CEUS parameters and portal pressure.
The authors aimed to establish a canine liver fibrosis model and investigate the feasibility of a non-invasive quantitative estimation of portal pressure with CEUS during the development of liver fibrosis. The intensity and area under the curve of the portal venous phase/hepatic arterial phase (Ip/Ia and Qp/Qa, respectively) parameters used in this study are new CEUS features for evaluating the blood flow ratio of the portal vein/hepatic artery.
The introduction of Ip/Ia and Qp/Qa parameters has obvious advantages over such absolute values as peak intensity, as this approach reduces the influence of numerous factors that affect CEUS. This study demonstrates for the first time a statistically significant negative correlation of FPP with Ip/Ia and Qp/Qa in the progression of liver fibrosis in a canine model.
Based on the results of the correlation of FPP with Ip/Ia and Qp/Qa, this study supports CEUS as a potential method to non-invasively estimate portal pressure via the measurement of Qp/Qa and Ip/Ia parameters.
CEUS is the use of intravenous microbubble contrast agents in ultrasonography. The use of such contrast agents has been shown to improve the characterization of the vasculature inside the organ of interest and provide the hemodynamic parameters of blood circulation and tissue perfusion. The Ip/Ia and Qp/Qa proposed in this study are CEUS parameters for evaluating the blood flow ratio of the portal vein/hepatic artery.
This manuscript demonstrates new methods for CEUS detection of fibrosis in vivo. This is a non-invasive method combined with computed tomography and known parameters, such as FPP, Qp/Qa, and Ip/Ia. Previous publications have demonstrated that portal pressure was negatively correlated with portal hypertension. However, accuracy could be improved. In this study, the authors introduce CEUS with a higher temporal resolution to resolve the problem. The paper is well-written and includes crucial information concerning fibrosis.
P- Reviewer: El Raziky M, Weng SY S- Editor: Yu J L- Editor: Rutherford A E- Editor: Liu XM
| 1. | Halpern EJ. Science to practice: Noninvasive assessment of portal hypertension--can US aid in the prediction of portal pressure and monitoring of therapy? Radiology. 2006;240:309-310. [PubMed] |
| 2. | Groszmann RJ, Wongcharatrawee S. The hepatic venous pressure gradient: anything worth doing should be done right. Hepatology. 2004;39:280-282. [RCA] [PubMed] [DOI] [Full Text] [Cited by in Crossref: 406] [Cited by in RCA: 390] [Article Influence: 18.6] [Reference Citation Analysis (0)] |
| 3. | Bolognesi M, Sacerdoti D, Merkel C, Bombonato G, Gatta A. Noninvasive grading of the severity of portal hypertension in cirrhotic patients by echo-color-Doppler. Ultrasound Med Biol. 2001;27:901-907. [RCA] [PubMed] [DOI] [Full Text] [Cited by in Crossref: 52] [Cited by in RCA: 52] [Article Influence: 2.2] [Reference Citation Analysis (0)] |
| 4. | Bolognesi M, Sacerdoti D, Merkel C, Gerunda G, Maffei-Faccioli A, Angeli P, Jemmolo RM, Bombonato G, Gatta A. Splenic Doppler impedance indices: influence of different portal hemodynamic conditions. Hepatology. 1996;23:1035-1040. [RCA] [PubMed] [DOI] [Full Text] [Cited by in Crossref: 74] [Cited by in RCA: 74] [Article Influence: 2.6] [Reference Citation Analysis (0)] |
| 5. | Kawanaka H, Kinjo N, Anegawa G, Yoshida D, Migoh S, Konishi K, Ohta M, Yamaguchi S, Tomikawa M, Hashizume M. Abnormality of the hepatic vein waveforms in cirrhotic patients with portal hypertension and its prognostic implications. J Gastroenterol Hepatol. 2008;23:e129-e136. [RCA] [PubMed] [DOI] [Full Text] [Cited by in Crossref: 15] [Cited by in RCA: 18] [Article Influence: 1.1] [Reference Citation Analysis (0)] |
| 6. | Albrecht T, Blomley MJ, Cosgrove DO, Taylor-Robinson SD, Jayaram V, Eckersley R, Urbank A, Butler-Barnes J, Patel N. Non-invasive diagnosis of hepatic cirrhosis by transit-time analysis of an ultrasound contrast agent. Lancet. 1999;353:1579-1583. [RCA] [PubMed] [DOI] [Full Text] [Cited by in Crossref: 183] [Cited by in RCA: 163] [Article Influence: 6.3] [Reference Citation Analysis (0)] |
| 7. | Blomley MJ, Lim AK, Harvey CJ, Patel N, Eckersley RJ, Basilico R, Heckemann R, Urbank A, Cosgrove DO, Taylor-Robinson SD. Liver microbubble transit time compared with histology and Child-Pugh score in diffuse liver disease: a cross sectional study. Gut. 2003;52:1188-1193. [RCA] [PubMed] [DOI] [Full Text] [Cited by in Crossref: 101] [Cited by in RCA: 88] [Article Influence: 4.0] [Reference Citation Analysis (0)] |
| 8. | Lim AK, Taylor-Robinson SD, Patel N, Eckersley RJ, Goldin RD, Hamilton G, Foster GR, Thomas HC, Cosgrove DO, Blomley MJ. Hepatic vein transit times using a microbubble agent can predict disease severity non-invasively in patients with hepatitis C. Gut. 2005;54:128-133. [RCA] [PubMed] [DOI] [Full Text] [Cited by in Crossref: 110] [Cited by in RCA: 101] [Article Influence: 5.1] [Reference Citation Analysis (0)] |
| 9. | Li N, Ding H, Fan P, Lin X, Xu C, Wang W, Xu Z, Wang J. Intrahepatic transit time predicts liver fibrosis in patients with chronic hepatitis B: quantitative assessment with contrast-enhanced ultrasonography. Ultrasound Med Biol. 2010;36:1066-1075. [RCA] [PubMed] [DOI] [Full Text] [Cited by in Crossref: 22] [Cited by in RCA: 21] [Article Influence: 1.4] [Reference Citation Analysis (0)] |
| 10. | Zhang RP, Zhang WH, Xue DB, Wei YW. [Morphology of portal hypertension at the early stage of liver damage induced by CCl4: an experimental study with dogs]. Zhonghua Yixue Zazhi. 2004;84:1118-1121. [PubMed] |
| 11. | Miles KA, Hayball MP, Dixon AK. Functional images of hepatic perfusion obtained with dynamic CT. Radiology. 1993;188:405-411. [PubMed] |
| 12. | Bedossa P, Poynard T. An algorithm for the grading of activity in chronic hepatitis C. The METAVIR Cooperative Study Group. Hepatology. 1996;24:289-293. [PubMed] |
| 13. | Baik SK, Park DH, Kim MY, Choi YJ, Kim HS, Lee DK, Kwon SO, Kim YJ, Park JW, Chang SJ. Captopril reduces portal pressure effectively in portal hypertensive patients with low portal venous velocity. J Gastroenterol. 2003;38:1150-1154. [RCA] [PubMed] [DOI] [Full Text] [Cited by in Crossref: 43] [Cited by in RCA: 46] [Article Influence: 2.2] [Reference Citation Analysis (0)] |
| 14. | Kim MY, Baik SK, Park DH, Lim DW, Kim JW, Kim HS, Kwon SO, Kim YJ, Chang SJ, Lee SS. Damping index of Doppler hepatic vein waveform to assess the severity of portal hypertension and response to propranolol in liver cirrhosis: a prospective nonrandomized study. Liver Int. 2007;27:1103-1110. [RCA] [PubMed] [DOI] [Full Text] [Cited by in Crossref: 56] [Cited by in RCA: 61] [Article Influence: 3.4] [Reference Citation Analysis (0)] |
| 15. | Lebrec D. Methods to evaluate portal hypertension. Gastroenterol Clin North Am. 1992;21:41-59. [PubMed] |
| 16. | Baik SK, Jeong PH, Ji SW, Yoo BS, Kim HS, Lee DK, Kwon SO, Kim YJ, Park JW, Chang SJ. Acute hemodynamic effects of octreotide and terlipressin in patients with cirrhosis: a randomized comparison. Am J Gastroenterol. 2005;100:631-635. [RCA] [PubMed] [DOI] [Full Text] [Cited by in Crossref: 81] [Cited by in RCA: 87] [Article Influence: 4.4] [Reference Citation Analysis (0)] |
| 17. | Kim MY, Suk KT, Baik SK, Kim HA, Kim YJ, Cha SH, Kwak HR, Cho MY, Park HJ, Jeon HK. Hepatic vein arrival time as assessed by contrast-enhanced ultrasonography is useful for the assessment of portal hypertension in compensated cirrhosis. Hepatology. 2012;56:1053-1062. [RCA] [PubMed] [DOI] [Full Text] [Cited by in Crossref: 78] [Cited by in RCA: 72] [Article Influence: 5.5] [Reference Citation Analysis (0)] |
| 18. | Maruyama H, Ishibashi H, Takahashi M, Imazeki F, Yokosuka O. Effect of signal intensity from the accumulated microbubbles in the liver for differentiation of idiopathic portal hypertension from liver cirrhosis. Radiology. 2009;252:587-594. [RCA] [PubMed] [DOI] [Full Text] [Cited by in Crossref: 31] [Cited by in RCA: 30] [Article Influence: 1.9] [Reference Citation Analysis (0)] |
| 19. | Tang A, Kim TK, Heathcote J, Guindi M, Jang HJ, Karshafian R, Burns PN, Wilson SR. Does hepatic vein transit time performed with contrast-enhanced ultrasound predict the severity of hepatic fibrosis? Ultrasound Med Biol. 2011;37:1963-1969. [RCA] [PubMed] [DOI] [Full Text] [Cited by in Crossref: 13] [Cited by in RCA: 12] [Article Influence: 0.9] [Reference Citation Analysis (0)] |
| 20. | Berzigotti A, Nicolau C, Bellot P, Abraldes JG, Gilabert R, García-Pagan JC, Bosch J. Evaluation of regional hepatic perfusion (RHP) by contrast-enhanced ultrasound in patients with cirrhosis. J Hepatol. 2011;55:307-314. [RCA] [PubMed] [DOI] [Full Text] [Cited by in Crossref: 34] [Cited by in RCA: 37] [Article Influence: 2.6] [Reference Citation Analysis (0)] |
| 21. | Zhang L, Yin J, Duan Y, Yang Y, Yuan L, Cao T. Assessment of intrahepatic blood flow by Doppler ultrasonography: relationship between the hepatic vein, portal vein, hepatic artery and portal pressure measured intraoperatively in patients with portal hypertension. BMC Gastroenterol. 2011;11:84. [RCA] [PubMed] [DOI] [Full Text] [Full Text (PDF)] [Cited by in Crossref: 17] [Cited by in RCA: 19] [Article Influence: 1.4] [Reference Citation Analysis (0)] |
| 22. | Richter S, Mücke I, Menger MD, Vollmar B. Impact of intrinsic blood flow regulation in cirrhosis: maintenance of hepatic arterial buffer response. Am J Physiol Gastrointest Liver Physiol. 2000;279:G454-G462. [PubMed] |
| 23. | Gülberg V, Haag K, Rössle M, Gerbes AL. Hepatic arterial buffer response in patients with advanced cirrhosis. Hepatology. 2002;35:630-634. [RCA] [PubMed] [DOI] [Full Text] [Cited by in Crossref: 105] [Cited by in RCA: 116] [Article Influence: 5.0] [Reference Citation Analysis (1)] |
| 24. | Blomley MJ, Albrecht T, Cosgrove DO, Jayaram V, Eckersley RJ, Patel N, Taylor-Robinson S, Bauer A, Schlief R. Liver vascular transit time analyzed with dynamic hepatic venography with bolus injections of an US contrast agent: early experience in seven patients with metastases. Radiology. 1998;209:862-866. [PubMed] |
| 25. | Sugimoto H, Kaneko T, Hirota M, Tezel E, Nakao A. Earlier hepatic vein transit-time measured by contrast ultrasonography reflects intrahepatic hemodynamic changes accompanying cirrhosis. J Hepatol. 2002;37:578-583. [RCA] [PubMed] [DOI] [Full Text] [Cited by in Crossref: 53] [Cited by in RCA: 57] [Article Influence: 2.5] [Reference Citation Analysis (0)] |
| 26. | Kim MY, Baik SK, Lee SS. Hemodynamic alterations in cirrhosis and portal hypertension. Korean J Hepatol. 2010;16:347-352. [RCA] [PubMed] [DOI] [Full Text] [Full Text (PDF)] [Cited by in Crossref: 60] [Cited by in RCA: 72] [Article Influence: 5.1] [Reference Citation Analysis (0)] |
| 27. | Eipel C, Abshagen K, Vollmar B. Regulation of hepatic blood flow: the hepatic arterial buffer response revisited. World J Gastroenterol. 2010;16:6046-6057. [RCA] [PubMed] [DOI] [Full Text] [Full Text (PDF)] [Cited by in CrossRef: 339] [Cited by in RCA: 368] [Article Influence: 24.5] [Reference Citation Analysis (2)] |
| 28. | Ho H, Sorrell K, Bartlett A, Hunter P. Modeling the hepatic arterial buffer response in the liver. Med Eng Phys. 2013;35:1053-1058. [RCA] [PubMed] [DOI] [Full Text] [Cited by in Crossref: 26] [Cited by in RCA: 29] [Article Influence: 2.2] [Reference Citation Analysis (0)] |
| 29. | Van Beers BE, Leconte I, Materne R, Smith AM, Jamart J, Horsmans Y. Hepatic perfusion parameters in chronic liver disease: dynamic CT measurements correlated with disease severity. AJR Am J Roentgenol. 2001;176:667-673. [PubMed] |
| 30. | Lin YW, Chen WJ, Zhang QY. Correlation between hepatic CT perfusion imaging and portal vein pressure in normal Beagles. Shiyong Yixue Zazhi. 2011;27:1737-1739. |


