Published online May 14, 2014. doi: 10.3748/wjg.v20.i18.5493
Revised: January 3, 2014
Accepted: February 26, 2014
Published online: May 14, 2014
Processing time: 197 Days and 15.9 Hours
AIM: To investigate the mechanism by which miR-204-3p inhibits the growth of hepatocellular carcinoma (HCC) tumor endothelial cells (TECs).
METHODS: Flow cytometry was used to identify HCCTECs and analyze their purity. Differentially expressed miRNAs in HCC TECs as compared to normal hepatic sinusoidal endothelial cells (HSECs) were examined using the HmiOA v4 Human miRNA OneArray® microarray. miR-204-3p showed the most significant decrease in expression and was further studied. Over-expression of miR-204-3p was achieved using lentiviral transduction into TECs of HCC. The biological changes in HCC TECs before and after transduction were detected using MTT and apoptosis assays. The association between miR-204-3p and fibronectin 1 (FN1) was determined using the dual luciferase activity assay. Changes in FN1 protein expression before and after transduction were detected using Western blot analysis.
RESULTS: Microarray results showed that compared to normal HSECs, 15 miRNAs were differentially expressed in HCC TECs, including 6 miRNAs with increased expression and 9 miRNAs with decreased expression. Among them, miR-204-3p showed the most significant decrease in expression (log2 = -1.233477, P = 0.000307). Over-expression of miR-204-3p in HCC TECs via lentiviral transduction significantly inhibited the proliferation of HCC TECs and promoted apoptosis. Results from the dual luciferase activity experiment showed that the luciferase intensity in the wild type FN1 group was significantly inhibited (P < 0.05), while that in the mutant FN1 group was not obviously affected. This observation indicated that FN1 was one of the potential targets of miR-204-3p. After over-expression of miR-204-3p in HCC TECs, Western blot analysis showed that the expression of FN1 protein was significantly inhibited.
CONCLUSION: MiR-204-3p acts on its potential target gene, FN1, and inhibits its expression, thus blocking the adhesion function of FN1 in promoting the growth of TECs.
Core tip: This study first employed a microarray to detect differentially expressed miRNAs in hepatocellular carcinoma (HCC) tumor endothelial cells (TECs), as compared to hepatic sinusoidal endothelial cells with the goal of identifying specific miRNAs that play important roles in the angiogenesis of HCC. Our study proved that fibronectin 1 (FN1) is a potential target gene of miR-204-3p, suggesting that FN1 regulates the growth of HCC TECs via the miR-204-3p/FN1 signaling pathway. The underlying mechanism was also investigated to provide new targets and a theoretical basis for the anti-angiogenic gene therapy of HCC.
- Citation: Cui ZH, Shen SQ, Chen ZB, Hu C. Growth inhibition of hepatocellular carcinoma tumor endothelial cells by miR-204-3p and underlying mechanism. World J Gastroenterol 2014; 20(18): 5493-5504
- URL: https://www.wjgnet.com/1007-9327/full/v20/i18/5493.htm
- DOI: https://dx.doi.org/10.3748/wjg.v20.i18.5493
Hepatocellular carcinoma (HCC) is a solid malignancy with rich blood supply. Its growth, invasion, and metastasis are all closely associated with angiogenesis, and regulation of tumor angiogenesis can therefore control tumor growth[1]. During the progression of tumors from the avascular stage to the vascular stage, angiogenesis is regulated by angiogenic growth factors and their inhibitors, and once this balance is disturbed, angiogenesis can be accelerated[2]. Although significant progress has been achieved in studies focusing on HCC treatment, effective treatment methods are still missing, and the prognosis remains poor. Anti-angiogenic therapy targeting tumor neovasculature is a new route for HCC treatment. Therefore, the identification of specific molecular markers of tumor vascular endothelial cells can provide a new basis for the diagnosis and targeted therapy of HCC[3,4]. MicroRNAs (miRNAs) are non-coding, small RNAs that regulate gene expression at the post-transcriptional level. They regulate the expression of downstream target genes at the protein level, thus playing important regulatory roles in cellular pathways. Abnormal expression of miRNA target genes is associated with many diseases, such as cancer and cardiovascular disorders[5-7]. Current studies on miRNAs are mostly focused on tumor cells. Thus far, no studies have described miRNAs in tumor endothelial cells (TECs) of human HCC. Therefore, this study first employed a microarray to detect differentially expressed miRNAs in HCC TECs as compared to normal hepatic sinusoidal endothelial cells (HSECs) with the goal of identifying specific miRNAs that play important roles in the angiogenesis of HCC. Of the identified differentially expressed miRNAs, miRNA-204-3p had the most significant decrease in expression and was further studied to investigate its role in the growth of TECs of HCC. Fibronectin 1 (FN1), a target gene of miR-204-3p, might participate in the miR-204-3p-mediated regulation of TEC growth. FN1 is an important component of the extracellular matrix and a multi-functional, glycoprotein macromolecule that participates in the processes of cellular adhesion, migration, and damage repair[8,9]; it also plays important roles in resistance to infection and the maintenance of microvascular integrity[10,11]. In addition, FN1 binds to the cell surface integrin receptor to initiate cell adhesion-mediated drug resistance (CAMDR)[12]. This study transduced TECs with a lentiviral vector to over-express miR-204-3p and showed that the expression of FN1 protein was significantly inhibited. Our study proved that FN1 is a potential target gene of miR-204-3p, suggesting that FN1 regulates the growth of HCC TECs via the miR-204-3p/FN1 signaling pathway. The underlying mechanism was also investigated to provide new targets and a theoretical basis for the anti-angiogenic gene therapy of HCC.
TECs of human HCC, human HSECs, and 293T cells were purchased from Shanghai Xinran Biotechnology (Shanghai, China) and cultured in DMEM (Dulbecco’s Modified Eagle’s Medium) high-glucose medium supplemented with 10% fetal bovine serum.
After TECs were collected and washed twice with phosphate-buffered saline (PBS), human IgG (1 μg/L × 105 cells) was added to block the cells at room temperature for 15 min. After centrifugation, the cells were aliquoted into flow cytometry tubes. Different fluorescence-coupled antibodies were added to each tube and incubated at 4 °C for 30-45 min. After PBS washes and centrifugation, the cells were resuspended in 100-200 μL PBS for flow cytometric analysis.
Total RNA samples were analyzed using electrophoresis to ensure that the bands of the samples were clear and complete without smearing and diffusion. The OD230, OD260, and OD280 of the total RNA samples were determined using a NanoDrop instrument. The samples were required to meet the criteria of OD260/280 > 1.8 and OD260/230 > 1.5. The required amount of total RNA samples was greater than 5 μg.
The RNA samples that passed the quality control were used for reverse transcription and RNA fluorescence labeling reactions. After microarray hybridization and washing, the hybridized microarray was scanned using a laser confocal scanner. Background subtraction and normalization of the hybridization signals were then performed. Genes with greater than 2 folds of differential expression were listed in a table, followed by statistical analysis.
The primers were synthesized as follows: forward, 5’-AGC TGT ACA AGT AAG CCT GAT CAT GTA CCC ATA GG-3’ and reverse, 5’-GGG AGA GGG GCT TAG CTT ATG GGA CAG TTA TGG GC-3’. A recombinant viral plasmid encoding lentiviral particles and two helper packaging and pseudotyping plasmids were prepared. Endotoxin-free, high-purity extraction of these plasmids was performed, and the plasmids were co-transfected into 293T cells according to the instruction manual provided with Lipofectamine 2000 (Invitrogen). Eight hours after transfection, the culture medium was replaced with complete culture medium. After another 48 h of culture, the cell culture supernatant rich in lentiviral particles was collected and concentrated to obtain a high-titer, concentrated lentiviral solution. The virus titer was determined and calibrated in 293T cells.
The experimental cells were divided into 3 groups: the CON group consisted of normal TECs without lentiviral infection, the NC group consisted of normal TECs infected with negative control viruses, and the micro-up group included normal TECs infected with the miR-204-3p-up virus containing the target gene. Cells under good culture conditions from each experimental group were inoculated into 6-well plates one day prior to viral infection. On the day of infection, lentiviruses were added into each group of cells to perform the infection experiments. Three days after infection, the expression of GFP was observed under a fluorescence microscope, and the percentage of cells with positive fluorescence was more than 90%. When cells became confluent, they were harvested and examined.
Cells from each group in logarithmic phase were digested with trypsin and resuspended in complete culture medium. Cells were counted using a hemocytometer, and the cell density used for inoculation was determined according to the growth rate (usually 2000 cells/well). Each group had 3-5 duplicate wells with 100 μL of cell suspension in each well; a total of 5 96-well plates were used, and the observation was continued for 5 d. When adding cells to the tissue culture plates, the cell number in each well was consistent. After cells were plated, they were cultured at 37 °C in a 5% CO2 incubator. During the period starting from the second day of plating to 4 h before the termination of culture, 10 μL of 5 mg/mL MTT was added to each well without changing the medium. After 4 h, the culture medium was discarded, and 100 μL DMSO was added to each well to stop the reaction. After vortexing for 5-10 min, the OD value was detected at 490 nm using a microplate reader, and the results were statistically plotted.
Cell culture supernatant from each group was collected into 5 mL centrifuge tubes after the cells were infected for 4 d. Cells were washed once with D-Hanks and digested with trypsin; the digestion was stopped by the addition of culture supernatant. Cells were harvested and collected into the same 5 mL centrifuge tube, and each group had three duplicate wells. After washing with PBS, 1 mL 1 × binding buffer, and 1 mL 1 × staining buffer, cell suspensions were collected, stained with 5 μL annexin V-APC, and transferred into flow cytometry tubes for detection.
The primer sequence for synthesizing the 3’-untranslated region (3’-UTR) sequence of the FN1 gene was 5’-GCTCTAGATTCTAGAGC-3’. The plasmid containing the chemically synthesized target gene was digested with XbaI. PCR was used to isolate the target gene from the plasmid. The target vector was digested with enzymes, and the digested product was recovered after electrophoresis to perform exchange. The product was then transformed into competent bacterial cells. The forward PCR primer sequence was 5’-GAGGAGTTGTGTTTGTGGAC-3’, and the reverse primer sequence was 5’-GACGATAGTCATGCCCCGCG-3’. The resulting clones were first identified by colony PCR, and the PCR positive clones were sequenced. Subsequently, the sequences were compared and analyzed, and the clones with the correct sequence were kept as the successfully constructed target plasmids.
Cultured 293T cells were inoculated into 24-well culture plates one day prior to plasmid transfection. Twenty-four hours after transfection, the expression of the intracellular fluorescent marker gene (GFP) was observed under a fluorescence microscope. Cells were then processed using the Dual-Glo™ Luciferase Assay System (E2920, Promega) and luciferase expression was measured. Firefly/Renilla luminescence represented the ratio between the firefly luciferase value and the Renilla luciferase value of the same sample well, which indicated the activity of firefly luciferase (i.e., the expression level).
Protein samples were lysed in sample lysis buffer to a final concentration of 0.5-1 mg/mL. After boiling in a 100 °C water bath for 3 min, the samples were electrophoresed on pre-made SDS-polyacrylamide gels. After destaining and washing, the nitrocellulose (NC) membrane was incubated with specific primary antibodies, followed by overnight incubation in a shaker at 4 °C. After washing with TBST (Tris-buffered saline and Tween 20) 3 times, the membrane was transferred into a solution with diluted enzyme-labeled secondary antibodies. The membrane was washed, exposed and developed in a dark room.
Statistical analyses was performed using the SPSS 13.0 software. All experiments were independently repeated three times. Comparison between the two groups of data was performed using Student’s t test. A P value < 0.05 indicated that the difference was statistically significant.
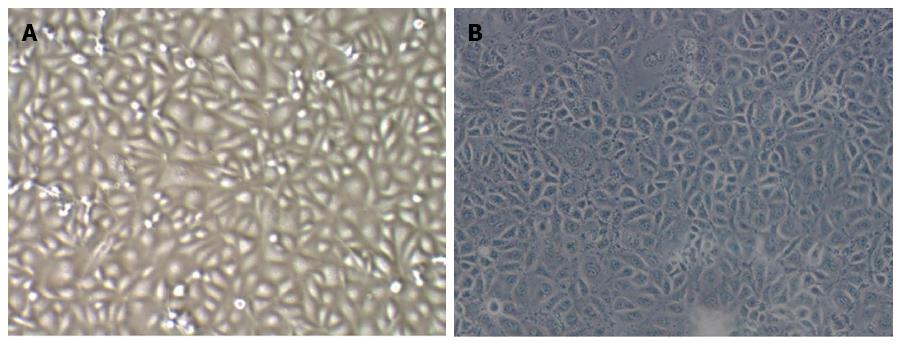
Observation under the microscope revealed that TECs showed a thin and long “filamentous rod-shaped” morphology, while HSECs showed a typical “cobblestone-like” morphology (Figure 1).
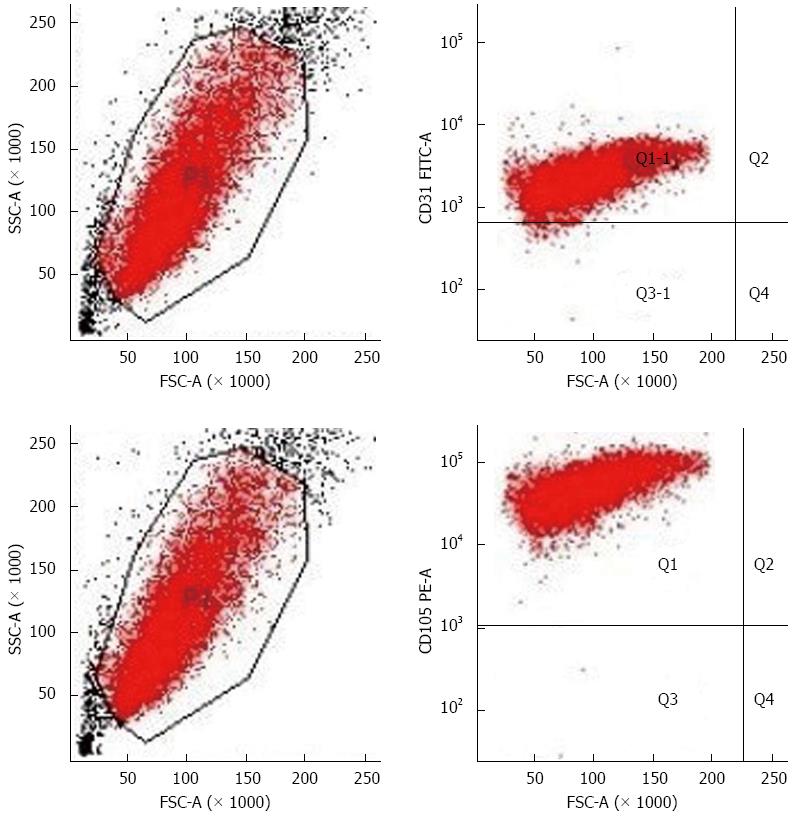
Currently, the main molecular markers used for sorting vascular endothelial cells are CD31 and CD105. However, since CD31 can cross-react with hematopoietic cells, CD105 becomes the best choice for sorting HCC TECs[13]. Flow cytometry results showed that the positive rates of CD105 and CD31 expression were 100% and 98.7%, respectively, which excluded the possibility of hepatoma cell, macrophage, and fibroblast contamination (Figure 2).
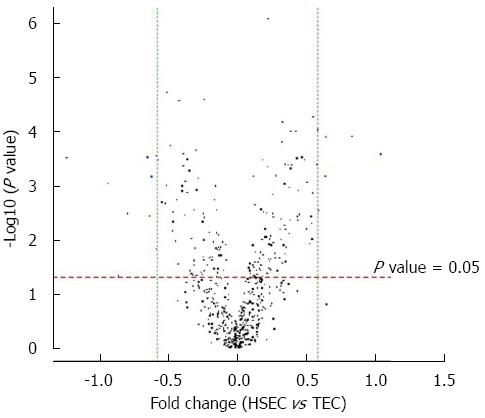
The volcano plot shows the distribution of differential expressed probes while dotted line in red and green representing the cut-off, a measurement of fold-change on the x-axis vs a measure of significance (negative logarithm of the P value) on the y-axis. The log2 scale of the expression signal values were plotted for all probes, excluding control and flagged probes (Figure 3).
For advanced data analysis, all biological replicates were pooled and calculated to identify differentially expressed genes based on the threshold of fold change and P value. The correlation of expression profiles between biological replicates and treatment conditions was demonstrated by unsupervised hierarchical clustering analysis. A subset of genes was selected for clustering analysis. An intensity filter was used to select genes where the difference between the maximum and minimum intensity values exceeds 75 among all microarrays. For this microarray project, the number of genes clustered was 108 (Figure 4).
There are 15 differentially expressed miRNAs in HCC TECs, including 6 miRNAs with increased expression and 9 miRNAs with decreased expression. Standard selection criteria to identify differentially expressed genes are established at log2|Fold change| ≥ 0.585 and P < 0.05 (Tables 1 and 2).
| Name | Normalized intensity | CV | Log2 (Ratio) | P value | ||
| HSEC | TEC | HSEC | TEC | TEC/HSEC | TEC/HSEC | |
| hsa-miR-1 | 68.257645 | 186.191599 | 0.029597 | 0.068251 | 1.447725 | 0.000086 |
| hsa-miR-3127-5p | 131.708413 | 205.954953 | 0.021898 | 0.041495 | 0.644981 | 0.000128 |
| hsa-miR-3146 | 126.901537 | 261.084309 | 0.090416 | 0.054737 | 1.040806 | 0.000266 |
| hsa-miR-3198 | 115.365033 | 179.95054 | 0.020914 | 0.063584 | 0.641394 | 0.000680 |
| hsa-miR-3673 | 71.141771 | 126.901537 | 0.023094 | 0.050363 | 0.834941 | 0.000125 |
| hsa-miR-4701-5p | 494.146893 | 744.766395 | 0.047938 | 0.083445 | 0.591848 | 0.002918 |
| Name | Normalized intensity | CV | Log2 (Ratio) | P value | ||
| HSEC | TEC | HSEC | TEC | TEC/HSEC | TEC/HSEC | |
| hsa-miR-1224-5p | 320.137967 | 213.236189 | 0.040860 | 0.040824 | -0.586241 | 0.000285 |
| hsa-miR-204-3p | 583.554793 | 305.8119 | 0.066696 | 0.115901 | -1.233477 | 0.000307 |
| hsa-miR-3178 | 638.353184 | 271.486074 | 0.084331 | 0.052030 | -0.932224 | 0.000313 |
| hsa-miR-3960 | 2801.44755 | 1866.07669 | 0.118070 | 0.118846 | -0.586164 | 0.014876 |
| hsa-miR-4488 | 1266.13124 | 816.538576 | 0.075747 | 0.081919 | -0.632834 | 0.003703 |
| hsa-miR-4497 | 5067.40908 | 2926.01657 | 0.111816 | 0.104477 | -0.792310 | 0.003316 |
| hsa-miR-4521 | 137.476665 | 89.455182 | 0.063787 | 0.037967 | -0.619950 | 0.000703 |
| hsa-miR-4649-5p | 8288.01626 | 5290.33783 | 0.045593 | 0.035977 | -0.647667 | 0.000935 |
| hsa-miR-933 | 1310.3545 | 721.882512 | 0.247288 | 0.215769 | -0.860121 | 0.047015 |
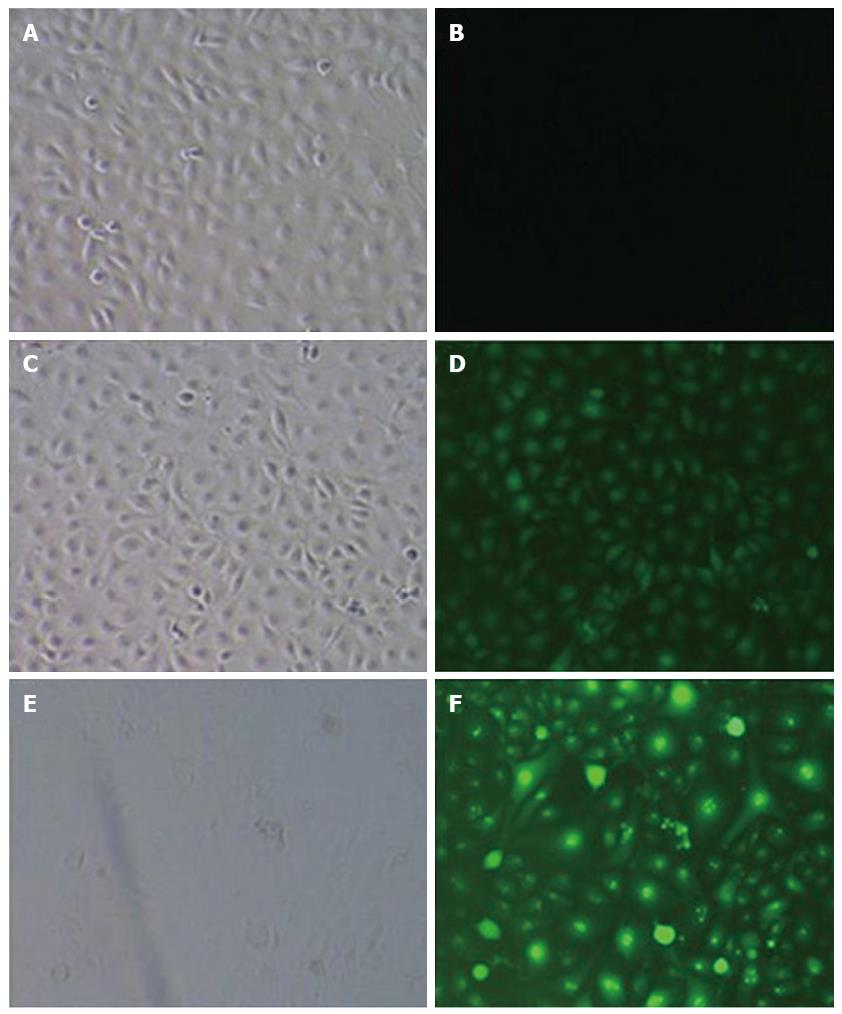
Three days after infection, the expression of GFP was observed under a fluorescence microscope. The results showed that the CON group had no green fluorescence, the NC group had green fluorescence that was not specific to the target gene, and the micro-up group contained green fluorescence as granules of the target gene; the percentage of cells with positive fluorescence was over 90% (Figure 5).
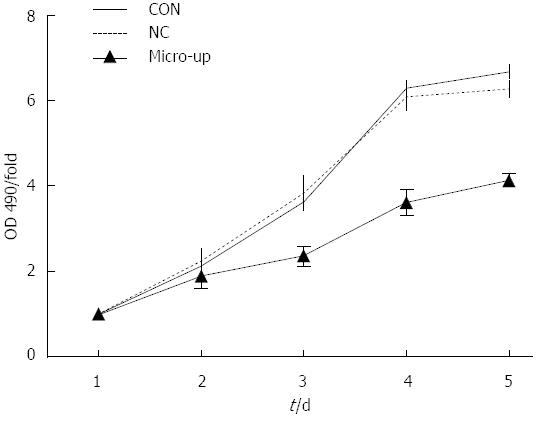
After 5 d of continuous observation, it was found that cell proliferation was significantly inhibited in the micro-up group, while cell proliferation in the CON and NC groups was not affected. On day 4, compared with the 2 control groups, the difference in proliferation inhibition in the micro-up group (3.61 ± 0.29) was the largest (P < 0.01), although there was no significant difference (P > 0.05) between the CON group (6.31 ± 0.14) and the NC group (6.11 ± 0.31) (Figure 6).
Four days after transduction, the confluence of each group of cells was approximately 90%. There was no significant difference between the CON group (1.54% ± 0.11%) and the NC group (1.61% ± 0.25%), while the micro-up group (4.09% ± 0.16%) showed significant apoptosis compared to the other groups (P < 0.01) (Figure 7).
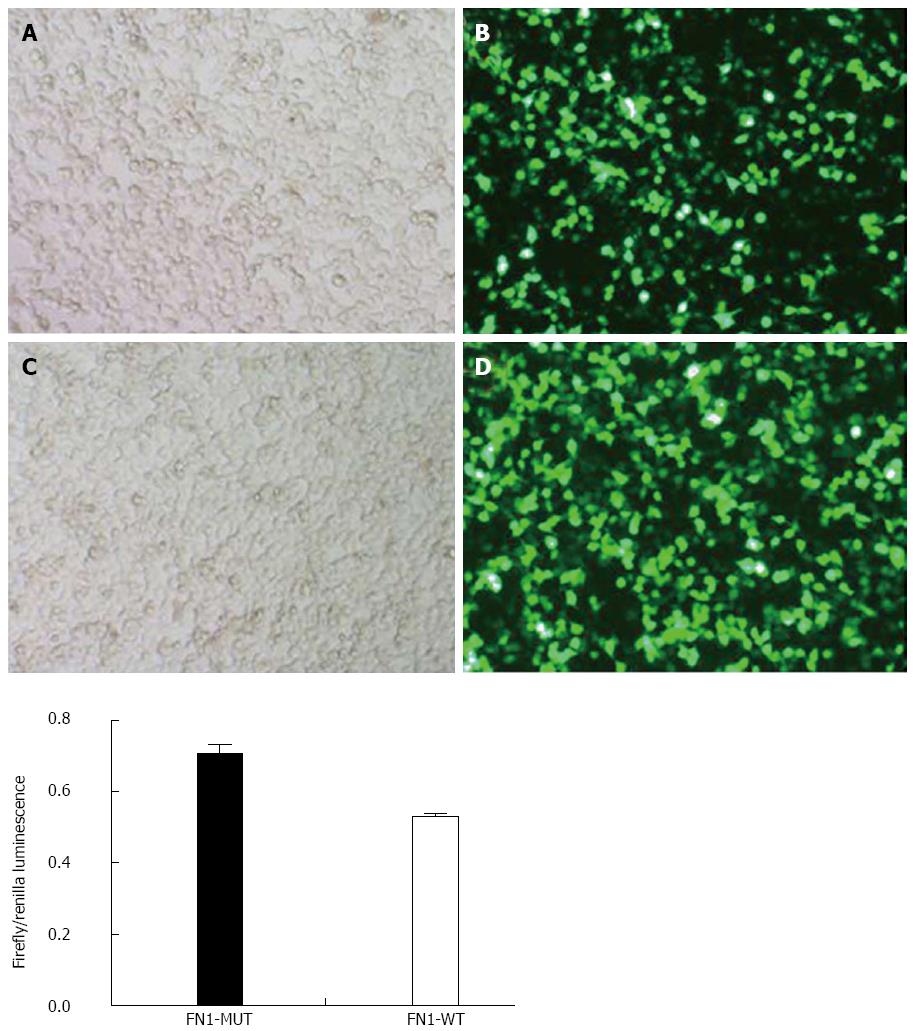
The luciferase activity in the wild type FN1 (FN1-WT) group (0.52 ± 0.01) was significantly lower than that in the FN1-MUT group (0.71 ± 0.02) (P < 0.05). This finding indicated that miR-204-3p had an inhibitory effect on FN1 expression, and the inhibitory effect was achieved through miR-204-3p binding to the FN1 3’UTR region, suggesting that FN1 is a target gene of miR-204-3p (Figure 8).
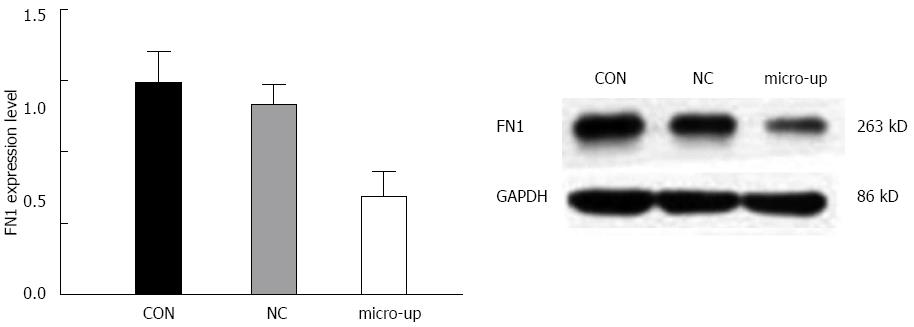
After infection, the expression of FN1 protein in TECs was significantly reduced, and there were significant differences between the groups (P < 0.01). In contrast, the FN1 protein expression in the CON and NC groups did not change significantly (Figure 9).
Tumorigenesis is a very complex process involving the regulation of multiple genes at multiple steps. Its mechanism has not been fully elucidated, and factors such as cell mutation and proliferation, signal transduction, and angiogenesis all have important influences[14]. Primary HCC is one of the most common malignant tumors of the digestive system. Surgical treatment by hepatectomy and liver transplantation is currently the only possible approach to cure HCC. However, surgical treatment has strict indications and contraindications. Radio- and chemotherapeutic technologies are the most widely used treatment approaches, although normal cells are inevitably damaged during these treatment processes due to the current lack of specific and effective therapies[15]. Therefore, the research and development of specifically targeted therapeutic drugs for HCC have become a top priority. The development of molecularly targeted drugs has become a new hope for the systemic treatment of HCC. HCC is a type of tumor with rich blood vessels. The selective inhibition or direct killing of HCC TECs as well as blocking tumor angiogenesis and blood supply as much as possible provides a new therapeutic method for HCC patients that is more effective and less toxic than the existing treatments. Thus, the identification of specific markers for HCC TECs and the investigation of specific targeted therapies against TECs have become new hot spots in the field of tumor therapy[16,17].
MiRNAs are non-coding, small RNAs that regulate gene expression at the post-transcriptional level. Their lengths are usually between 21-23 nucleotides. They can inhibit protein synthesis or induce mRNA degradation through complementary base-pairing with the 3’-UTR of the target mRNA, thus achieving negative regulation of target genes at the post-transcriptional level. MiRNAs can act not only as tumor suppressor genes to down-regulate the activity of proto-oncogenes[18] but also as oncogenes to down-regulate the activity of tumor suppressor genes, thus regulating the biological characteristics of tumors[19,20]. This study is the first to use a microarray analysis to detect the differentially expressed miRNAs between normal HSECs and HCC TECs. The results showed that there are 15 differentially expressed miRNAs in HCC TECs, including 6 miRNAs with increased expression and 9 miRNAs with decreased expression. These 15 differentially expressed miRNAs may participate in the regulation of proliferation and apoptosis of HCC TECs, thereby providing references for further investigation of the mechanism underlying miRNA regulation of the growth of HCC TECs. The verification and functional study of these screened, differentially expressed miRNAs are the focuses of our future studies. These small molecule substances may become new anti-angiogenesis targets for HCC[21].
We mentioned above that miRNAs participate in tumor occurrence and development through the regulation of downstream target genes. Therefore, the focus of this study was to select specific miRNAs and their target genes and to investigate the related functional mechanisms of the two. This study selected miR-204-3p, which showed significantly decreased differential expression, for the subsequent studies. The miR-204-3p-up lentiviral vector was constructed and used to infect HCC TECs. MTT assay showed that the proliferation of TECs in the micro-up group was significantly inhibited starting from the day 3, while the proliferation of untreated TECs and TECs treated with the negative control virus was not affected. The difference was most significant on day 4. Based on the initial MTT assay results, day 4 presented the most significant proliferation inhibition and was used as the time point for apoptosis detection. The results showed that TECs in the micro-up group demonstrated apoptosis with statistical significance. However, the apoptosis rate was only 4.09% ± 0.16%, and there were no significant large areas of apoptosis. It was speculated that miR-204-3p alone might not have obvious effects in promoting apoptosis in HCC TECs without the involvement of other miRNAs or signal molecules to jointly provide the regulatory effects. The specific mechanism underlying this observation still requires further investigation[7,22]. Mikhaylova et al[23] showed that compared with normal kidney tissues, the expression level of miR-203-3p in renal cell carcinoma was significantly decreased, and over-expression of miR-204-3p had a significant inhibitory effect on the growth and metastasis of the tumor. The results from this study, however, confirmed that miR-204-3p was also involved in regulating the growth of TECs, and miR-204-3p inhibited the proliferation and promoted the apoptosis of TECs of HCC through the regulation of specific target genes.
To further investigate the mechanism of action of miR-204-3p, we showed that FN1 was one of its target genes using the target gene prediction software. FN1 plays important roles in the proliferation, apoptosis, and metastasis of tumor cells[11,24]. Fibronectin proteins can mediate adhesion of many types of cells via the various integrin receptor domains on molecules and can also transduce specific signals, thus causing cells to produce specific physiological and pathological responses and affecting the proliferation, migration, differentiation, and apoptosis of cells. Studies have suggested that inhibition of tumor cell apoptosis by FN1 may be associated with increased bcl-2 expression[25,26]. Tumor growth requires blood vessels to provide oxygen and nutrients, and in the absence of blood supply, the diameter of a tumor cannot exceed 1.5 mm[27]. FN1 can be highly expressed in vascular endothelial cells, vascular smooth muscle, and perivascular matrix of many types of tumors[28]. Wijelath et al[29] showed that the full-length fibronectin protein molecule can form a structural and functional complex with vascular endothelial growth factor (VEGF) to promote angiogenesis and endothelial cell migration. This complex can protect VEGF from rapid degradation by proteolytic enzymes and significantly increase the migration capacity of endothelial cells. The expression of FN1 shows a positive correlation with that of VEGF and microvessel density (MVD)[30]. The luciferase assay results showed that the luciferase intensity in the FN1-WT group was significantly suppressed (P < 0.05), while that in the FN1-MUT group was basically not affected. This finding indicated that FN1 is one of the potential target genes of miR-204-3p and verified the authenticity of the target gene prediction software. Western blot was performed to examine the expression of fibronectin protein in HCC TECs before and after infection with miR-204-3p lentiviruses, as well as in TECs infected with negative control lentiviruses. The results showed that over-expression of miR-204-3p significantly inhibited the expression of fibronectin protein, which further verified the target gene prediction results and indicated that miR-204-3p inhibits the proliferation and promotes the apoptosis of HCC TECs through the silencing of its target gene, FN1.
This study, for the first time, examined the differentially expressed miRNAs in HCC TECs and HSECs and identified 15 specific miRNAs that may have regulatory functions in the proliferation and apoptosis of HCC TECs. These miRNAs can be used as specific targets to provide new ideas and directions for specific targeted therapies against TECs in the future. The miR-204-3p that showed significantly decreased differential expression was further studied. The experimental results confirmed that it plays important roles in the proliferation and apoptosis of TECs of HCC. The mechanism is through silencing of the expression of its target gene FN1, thus regulating the important function of FN1 in the proliferation, adhesion, and migration of vascular endothelial cells. Therefore, the 15 differentially expressed miRNAs headed by the miR-204-3p/target gene FN1 signaling pathway can be used as new targets for gene therapy and can provide effective and specific reference indicators for HCC anti-angiogenic therapy and prognosis evaluation.
MicroRNAs (miRNAs) are non-coding, small RNAs that regulate gene expression at the post-transcriptional level. These RNAs regulate the expression of downstream target genes at the protein level, thus playing important regulatory roles in cellular pathways. Abnormal expression of miRNA target genes is associated with many diseases, such as cancer and cardiovascular disorders.
Current studies on miRNAs are mostly focused on tumor cells. Thus far, no studies have described the miRNAs in tumor endothelial cells (TECs) of human hepatocellular carcinoma (HCC). The underlying mechanism was also investigated to provide new targets and a theoretical basis for the anti-angiogenic gene therapy of HCC.
This study first employed a microarray to detect the differentially expressed miRNAs in HCC TECs as compared to normal hepatic sinusoidal endothelial cells with the goal of identifying specific miRNAs that play important roles in the angiogenesis of HCC. Of the differentially expressed miRNAs, miRNA-204-3p had the most significant decrease in expression and was further studied to investigate its role in the growth of TECs of HCC. Fibronectin 1 (FN1), a target gene of miR-204-3p, might participate in the miR-204-3p-mediated regulation of TEC growth.
The 15 differentially expressed miRNAs headed by the miR-204-3p/target gene FN1 signaling pathway can be used as new targets for gene therapy and can provide effective and specific reference indicators for HCC anti-angiogenic therapy and prognosis evaluation.
MiRNAs are non-coding, small RNAs that regulate gene expression at the post-transcriptional level. Abnormal expression of miRNA target genes is associated with many diseases, such as cancer and cardiovascular disorders. FN1 is an important component of the extracellular matrix and a multi-functional macromolecule; it also plays important roles in resistance to infection and the maintenance of microvascular integrity.
The authors report that fifteen differentially expressed miRNAs were identified that may participate in the proliferation and metastasis of HCC TECs. Thus, this study proved that FN1 is a potential target gene of miR-204-3p, suggesting that FN1 regulates the growth of HCC TECs via the miR-204-3p/FN1 signaling pathway.
P- Reviewers: Hahm KB, Petmitr S S- Editor: Ma YJ L- Editor: Wang TQ E- Editor: Ma S
| 1. | Seaman S, Stevens J, Yang MY, Logsdon D, Graff-Cherry C, St Croix B. Genes that distinguish physiological and pathological angiogenesis. Cancer Cell. 2007;11:539-554. [RCA] [PubMed] [DOI] [Full Text] [Full Text (PDF)] [Cited by in Crossref: 335] [Cited by in RCA: 318] [Article Influence: 17.7] [Reference Citation Analysis (0)] |
| 2. | Hobert O. Gene regulation by transcription factors and microRNAs. Science. 2008;319:1785-1786. [RCA] [PubMed] [DOI] [Full Text] [Cited by in Crossref: 662] [Cited by in RCA: 653] [Article Influence: 38.4] [Reference Citation Analysis (0)] |
| 3. | Stefani G, Slack FJ. Small non-coding RNAs in animal development. Nat Rev Mol Cell Biol. 2008;9:219-230. [RCA] [PubMed] [DOI] [Full Text] [Cited by in Crossref: 1034] [Cited by in RCA: 1065] [Article Influence: 62.6] [Reference Citation Analysis (0)] |
| 4. | Kloosterman WP, Plasterk RH. The diverse functions of microRNAs in animal development and disease. Dev Cell. 2006;11:441-450. [PubMed] |
| 5. | Selbach M, Schwanhäusser B, Thierfelder N, Fang Z, Khanin R, Rajewsky N. Widespread changes in protein synthesis induced by microRNAs. Nature. 2008;455:58-63. [RCA] [PubMed] [DOI] [Full Text] [Cited by in Crossref: 2577] [Cited by in RCA: 2720] [Article Influence: 160.0] [Reference Citation Analysis (0)] |
| 6. | Kota J, Chivukula RR, O’Donnell KA, Wentzel EA, Montgomery CL, Hwang HW, Chang TC, Vivekanandan P, Torbenson M, Clark KR. Therapeutic microRNA delivery suppresses tumorigenesis in a murine liver cancer model. Cell. 2009;137:1005-1017. [RCA] [PubMed] [DOI] [Full Text] [Full Text (PDF)] [Cited by in Crossref: 1388] [Cited by in RCA: 1364] [Article Influence: 85.3] [Reference Citation Analysis (0)] |
| 7. | Juan D, Alexe G, Antes T, Liu H, Madabhushi A, Delisi C, Ganesan S, Bhanot G, Liou LS. Identification of a microRNA panel for clear-cell kidney cancer. Urology. 2010;75:835-841. [RCA] [PubMed] [DOI] [Full Text] [Cited by in Crossref: 167] [Cited by in RCA: 185] [Article Influence: 11.6] [Reference Citation Analysis (0)] |
| 8. | Hanahan D, Weinberg RA. Hallmarks of cancer: the next generation. Cell. 2011;144:646-674. [RCA] [PubMed] [DOI] [Full Text] [Cited by in Crossref: 51728] [Cited by in RCA: 47160] [Article Influence: 3368.6] [Reference Citation Analysis (5)] |
| 9. | Chandler EM, Seo BR, Califano JP, Andresen Eguiluz RC, Lee JS, Yoon CJ, Tims DT, Wang JX, Cheng L, Mohanan S. Implanted adipose progenitor cells as physicochemical regulators of breast cancer. Proc Natl Acad Sci USA. 2012;109:9786-9791. [RCA] [PubMed] [DOI] [Full Text] [Cited by in Crossref: 122] [Cited by in RCA: 116] [Article Influence: 8.9] [Reference Citation Analysis (0)] |
| 10. | Mammoto A, Connor KM, Mammoto T, Yung CW, Huh D, Aderman CM, Mostoslavsky G, Smith LE, Ingber DE. A mechanosensitive transcriptional mechanism that controls angiogenesis. Nature. 2009;457:1103-1108. [RCA] [PubMed] [DOI] [Full Text] [Full Text (PDF)] [Cited by in Crossref: 453] [Cited by in RCA: 402] [Article Influence: 25.1] [Reference Citation Analysis (0)] |
| 11. | Levental KR, Yu H, Kass L, Lakins JN, Egeblad M, Erler JT, Fong SF, Csiszar K, Giaccia A, Weninger W. Matrix crosslinking forces tumor progression by enhancing integrin signaling. Cell. 2009;139:891-906. [RCA] [PubMed] [DOI] [Full Text] [Cited by in Crossref: 2671] [Cited by in RCA: 3087] [Article Influence: 192.9] [Reference Citation Analysis (0)] |
| 12. | Pan CW, Shen ZJ, Wu TT, Tang XY, Wang M, Sun J, Shao Y. Cell adhesion to fibronectin induces mitomycin C resistance in bladder cancer cells. BJU Int. 2009;104:1774-1779. [RCA] [PubMed] [DOI] [Full Text] [Cited by in Crossref: 14] [Cited by in RCA: 17] [Article Influence: 1.1] [Reference Citation Analysis (0)] |
| 13. | Dallas NA, Samuel S, Xia L, Fan F, Gray MJ, Lim SJ, Ellis LM. Endoglin (CD105): a marker of tumor vasculature and potential target for therapy. Clin Cancer Res. 2008;14:1931-1937. [PubMed] |
| 14. | Yoder MC, Mead LE, Prater D, Krier TR, Mroueh KN, Li F, Krasich R, Temm CJ, Prchal JT, Ingram DA. Redefining endothelial progenitor cells via clonal analysis and hematopoietic stem/progenitor cell principals. Blood. 2007;109:1801-1809. [PubMed] |
| 15. | Mura M, Swain RK, Zhuang X, Vorschmitt H, Reynolds G, Durant S, Beesley JF, Herbert JM, Sheldon H, Andre M. Identification and angiogenic role of the novel tumor endothelial marker CLEC14A. Oncogene. 2012;31:293-305. [RCA] [PubMed] [DOI] [Full Text] [Cited by in Crossref: 89] [Cited by in RCA: 88] [Article Influence: 6.8] [Reference Citation Analysis (0)] |
| 16. | Jones CA, London NR, Chen H, Park KW, Sauvaget D, Stockton RA, Wythe JD, Suh W, Larrieu-Lahargue F, Mukouyama YS. Robo4 stabilizes the vascular network by inhibiting pathologic angiogenesis and endothelial hyperpermeability. Nat Med. 2008;14:448-453. [RCA] [PubMed] [DOI] [Full Text] [Full Text (PDF)] [Cited by in Crossref: 321] [Cited by in RCA: 307] [Article Influence: 18.1] [Reference Citation Analysis (0)] |
| 17. | Biankin AV, Waddell N, Kassahn KS, Gingras MC, Muthuswamy LB, Johns AL, Miller DK, Wilson PJ, Patch AM, Wu J. Pancreatic cancer genomes reveal aberrations in axon guidance pathway genes. Nature. 2012;491:399-405. [RCA] [PubMed] [DOI] [Full Text] [Cited by in Crossref: 1690] [Cited by in RCA: 1647] [Article Influence: 126.7] [Reference Citation Analysis (0)] |
| 18. | Suzuki HI, Miyazono K. Emerging complexity of microRNA generation cascades. J Biochem. 2011;149:15-25. [RCA] [PubMed] [DOI] [Full Text] [Cited by in Crossref: 100] [Cited by in RCA: 103] [Article Influence: 6.9] [Reference Citation Analysis (0)] |
| 19. | Newman MA, Hammond SM. Emerging paradigms of regulated microRNA processing. Genes Dev. 2010;24:1086-1092. [PubMed] |
| 20. | Balaguer F, Link A, Lozano JJ, Cuatrecasas M, Nagasaka T, Boland CR, Goel A. Epigenetic silencing of miR-137 is an early event in colorectal carcinogenesis. Cancer Res. 2010;70:6609-6618. [RCA] [PubMed] [DOI] [Full Text] [Full Text (PDF)] [Cited by in Crossref: 244] [Cited by in RCA: 235] [Article Influence: 15.7] [Reference Citation Analysis (0)] |
| 21. | He C, Klionsky DJ. Regulation mechanisms and signaling pathways of autophagy. Annu Rev Genet. 2009;43:67-93. [RCA] [PubMed] [DOI] [Full Text] [Full Text (PDF)] [Cited by in Crossref: 2982] [Cited by in RCA: 2881] [Article Influence: 180.1] [Reference Citation Analysis (0)] |
| 22. | Heng DY, Bukowski RM. Anti-angiogenic targets in the treatment of advanced renal cell carcinoma. Curr Cancer Drug Targets. 2008;8:676-682. [PubMed] |
| 23. | Mikhaylova O, Stratton Y, Hall D, Kellner E, Ehmer B, Drew AF, Gallo CA, Plas DR, Biesiada J, Meller J. VHL-regulated MiR-204 suppresses tumor growth through inhibition of LC3B-mediated autophagy in renal clear cell carcinoma. Cancer Cell. 2012;21:532-546. [RCA] [PubMed] [DOI] [Full Text] [Cited by in Crossref: 241] [Cited by in RCA: 264] [Article Influence: 20.3] [Reference Citation Analysis (0)] |
| 24. | Martino MM, Mochizuki M, Rothenfluh DA, Rempel SA, Hubbell JA, Barker TH. Controlling integrin specificity and stem cell differentiation in 2D and 3D environments through regulation of fibronectin domain stability. Biomaterials. 2009;30:1089-1097. [RCA] [PubMed] [DOI] [Full Text] [Full Text (PDF)] [Cited by in Crossref: 278] [Cited by in RCA: 248] [Article Influence: 15.5] [Reference Citation Analysis (0)] |
| 25. | Sheets K, Wunsch S, Ng C, Nain AS. Shape-dependent cell migration and focal adhesion organization on suspended and aligned nanofiber scaffolds. Acta Biomater. 2013;9:7169-7177. [RCA] [PubMed] [DOI] [Full Text] [Cited by in Crossref: 83] [Cited by in RCA: 81] [Article Influence: 6.8] [Reference Citation Analysis (0)] |
| 26. | Singh P, Carraher C, Schwarzbauer JE. Assembly of fibronectin extracellular matrix. Annu Rev Cell Dev Biol. 2010;26:397-419. [RCA] [PubMed] [DOI] [Full Text] [Cited by in Crossref: 602] [Cited by in RCA: 707] [Article Influence: 47.1] [Reference Citation Analysis (0)] |
| 28. | Llovet JM, Di Bisceglie AM, Bruix J, Kramer BS, Lencioni R, Zhu AX, Sherman M, Schwartz M, Lotze M, Talwalkar J. Design and endpoints of clinical trials in hepatocellular carcinoma. J Natl Cancer Inst. 2008;100:698-711. [RCA] [PubMed] [DOI] [Full Text] [Cited by in Crossref: 1232] [Cited by in RCA: 1325] [Article Influence: 77.9] [Reference Citation Analysis (0)] |
| 29. | Wijelath ES, Rahman S, Murray J, Patel Y, Savidge G, Sobel M. Fibronectin promotes VEGF-induced CD34 cell differentiation into endothelial cells. J Vasc Surg. 2004;39:655-660. [PubMed] |
| 30. | Xiong YQ, Sun HC, Zhang W, Zhu XD, Zhuang PY, Zhang JB, Wang L, Wu WZ, Qin LX, Tang ZY. Human hepatocellular carcinoma tumor-derived endothelial cells manifest increased angiogenesis capability and drug resistance compared with normal endothelial cells. Clin Cancer Res. 2009;15:4838-4846. [RCA] [PubMed] [DOI] [Full Text] [Cited by in Crossref: 153] [Cited by in RCA: 164] [Article Influence: 10.3] [Reference Citation Analysis (0)] |


